

We use cookies to ensure our website works properly and to personalise your experience. Cookies policy
University Institute of Pharmacy, Oriental University, Indore, India.
Background: Contract manufacturing organizations (CMOs) produce a large and growing share of the world's medicines, yet they remain over-represented in regulatory enforcement. This study asks which compliance and quality assurance problems recur at CMOs, why they recur, and what practical controls would reduce them. Methods: A mixed-methods design combined (i) a retrospective classification of 214 USFDA Warning Letters issued to contract manufacturing sites between January 2019 and December 2025 into eight deficiency categories, and (ii) a cross-sectional online survey of 88 quality assurance, quality control and regulatory affairs professionals with CMO or CDMO experience. Data were analysed with descriptive statistics, Pareto analysis, cross-tabulation and chi-square testing (? = 0.05). Results: Data integrity and computerised systems were cited in 68.7% of letters (76% in 2025, up from 61% in 2019-20), followed by laboratory controls and OOS investigation (60.3%). Survey respondents attributed data integrity risk mainly to inadequate audit trail review resourcing (69.3%) and shared logins (61.4%). Only 35.2% performed effectiveness checks on all CAPAs, and fewer than half had quality agreements that set change-notification (44.3%) or deviation escalation (40.9%) timelines. Self-assessed quality system maturity rose with organization size in every element measured; 39.4% of small-organization respondents scored below the scale midpoint on a composite index, against 4.2% of large-organization respondents. Conclusions: The leading problems are systemic (resourcing, system design, and sponsor-CMO governance) rather than individual. Four tools are proposed: a CMO-specific risk-scoring matrix, a model quality technical agreement clause set, a four-layer data integrity governance model and a ten-point self-inspection checklist, delivered through a phased twelve-month roadmap sized for resource-constrained CMOs.
Pharmaceutical manufacturing has moved from a fully integrated, in-house model to a distributed network in which production, packaging and testing are often outsourced. Contract manufacturing organizations (CMOs), and contract development and manufacturing organizations (CDMOs) that add development services, now supply innovator, generic and biotechnology companies alike. Rising development costs, patent expiries, the need to scale new modalities such as biologics and cell and gene therapies, and sponsors' wish to convert fixed capital into variable cost have all driven this growth. Outsourcing has not simplified regulation. A single CMO site usually serves several sponsors with marketing authorizations in different jurisdictions, and may be inspected by the USFDA, European and national competent authorities, the WHO Prequalification Programme, India's CDSCO and others. Each applies its own current good manufacturing practice (cGMP) expectations [1-4], although harmonization through ICH guidelines and the Pharmaceutical Inspection Co-operation Scheme (PIC/S) [5] has narrowed the differences. In India, the revised Schedule M adds explicit expectations for computerised system validation and structured self-inspection [6].
The feature that makes CMOs commercially attractive, serving many clients from a shared site, is also the source of their main regulatory exposure. One lapse in data integrity, deviation handling or change control can threaten the authorizations of several unrelated sponsors at once and interrupt the supply of essential medicines. Responsibility is shared by contract but not equally visible: the sponsor holds the marketing authorization, while the CMO holds the shop floor and the data. Regulators expect the sponsor to oversee the contract giver's outsourced activities through a written quality agreement [3,7], and ICH Q10 extends the management responsibility of the pharmaceutical quality system to outsourced activities [8].
Public enforcement data show that contract manufacturers are over-represented among recipients of USFDA Warning Letters. The recurring citations include failure to investigate discrepancies (21 CFR 211.192), inadequate laboratory controls (211.160 and 211.194), weak control of electronic records and the quality unit's failure to exercise its authority (211.22) [2]. This pattern suggests that the central problem is implementation rather than regulatory ambiguity. CMOs struggle to turn generic quality system principles into practices that withstand inspection by several authorities, and sponsors often see little of day-to-day CMO quality performance until a finding has already formed.
Two gaps motivate this study. First, enforcement correspondence is free-text and facility-specific, and is rarely aggregated into categories that reveal cross-industry patterns. Second, enforcement data say what regulators found, not why it happened, and practitioner evidence on root causes in CMOs is sparse. This paper combines both sources. Its objectives were to (1) classify the deficiencies cited against contract manufacturing sites in USFDA Warning Letters from 2019 to 2025; (2) obtain practitioner evidence on quality system maturity, data integrity practice, CAPA effectiveness, quality agreements, technology transfer and audit burden; (3) identify the root causes behind the recurring issues; and (4) translate the findings into practical tools that CMOs and sponsors can adopt.
METHODS
2.1 Study design
The study used a mixed-methods, descriptive-analytical design with two components designed to validate each other: a retrospective analysis of public regulatory enforcement documents, which gives a regulator-derived view of what is cited, and a cross-sectional practitioner survey, which gives an insider view of causes, practices and barriers that enforcement letters rarely state. Findings from the two sources were compared directly (triangulation) because the survey domains were built to mirror the deficiency categories used to code the letters.
2.2 Secondary data: Warning Letter analysis
USFDA Warning Letters issued between January 2019 and December 2025 were identified from the agency's public database [13] and cross-checked against industry CMO and CDMO directories. A letter was included if it was addressed to a facility identifiable as performing contract or toll manufacturing, packaging or testing for one or more separate marketing authorization holders, and if it contained GMP manufacturing content. Letters were excluded when the recipient could not be confirmed as a contract manufacturer (about 61% of exclusions), when they concerned only non-manufacturing matters such as promotional labelling (about 27%), or when they were superseded drafts. Of 341 candidate letters, 214 met the criteria (62.8%).
The 21 CFR sections cited in each letter were extracted and assigned to eight deficiency categories: (1) data integrity and computerised systems; (2) laboratory controls and out-of-specification (OOS) investigation [14]; (3) production record review and batch documentation; (4) quality unit authority and oversight; (5) deviation and CAPA management; (6) facility, equipment and contamination control; (7) stability programme; and (8) complaint handling and product quality review. A letter citing several categories was counted once in each, so category counts exceed 214. A random sample of 40 letters (19%) was coded independently by a second reviewer; category-level agreement before reconciliation was 91.4%, with no systematic directional bias. Two supporting analyses used the same scheme: a sample of publicly summarised Form 483 observations and EMA or national authority non-compliance statements, and 47 publicly reported recall events at contract manufacturing sites (2019-2025), classified by root cause. Facilities were also tabulated by region and by primary dosage form.
2.3 Primary data: practitioner survey
A structured online questionnaire of 34 items covered respondent and organization profile, quality management system (QMS) maturity mapped to ICH Q10 elements [8], data integrity practice, deviation, CAPA and OOS practice, quality agreements and sponsor communication, and open-ended items on the greatest compliance challenge and the most effective solution observed. Closed items used five-point Likert or categorical formats. Five professionals pilot-tested the instrument, which led to rewording of two Likert items, an added response option for computerised system validation status ("partially validated / validation in progress") and shorter open-ended items; pilot responses were excluded.
Eligible respondents were QA, QC or regulatory affairs professionals with at least two years of CMO or CDMO experience within the preceding five years. They were recruited by purposive and snowball sampling over an eight-week window. Of 96 responses received, 88 met the criteria and were analysed (response rate among eligible invitees about 62%). Participation was voluntary and anonymous, and no personal or organization-identifying data were collected. Table 1 gives the respondent profile.
Table 1: Profile of Survey Respondents (N = 88)
| Characteristic | Category | n (%) |
|---|---|---|
| Role | Quality assurance | 41 (46.6%) |
| Quality control | 21 (23.9%) | |
| Regulatory affairs | 26 (29.5%) | |
| Experience | 2-5 years | 29 (33.0%) |
| 6-10 years | 34 (38.6%) | |
| More than 10 years | 25 (28.4%) | |
| Organization size | Small (< 250 employees) | 33 (37.5%) |
| Medium (250-1000) | 31 (35.2%) | |
| Large (> 1000) | 24 (27.3%) | |
| Primary market | US/EU-regulated | 52 (59.1%) |
| India domestic / semi-regulated | 36 (40.9%) |
2.4 Analysis
Closed-item responses were summarised as frequencies, percentages, means and standard deviations. Responses were cross-tabulated by organization size and primary market, and a chi-square test of association (α = 0.05) was planned to examine whether either stratum was associated with self-reported maturity. Enforcement categories were examined by Pareto analysis. For each maturity item, a gap score was calculated as 5 minus the mean score. A Composite Compliance Confidence Index (CCCI), used descriptively and not as a validated scale, averaged each respondent's six QMS maturity items, two CAPA items and four quality-agreement items on the 1-5 scale; a CCCI below 3.0 was taken to indicate a self-assessed posture below the scale midpoint. Open-ended answers were coded inductively by two coders, reconciled by discussion, and grouped into themes. Analysis used spreadsheet software. All regulatory documents were already in the public domain, and the survey presented minimal ethical risk to adult professional volunteers.
RESULTS
3.1 Enforcement analysis (214 Warning Letters, 2019-2025)
Deficiency categories. Data integrity and computerised systems were cited in 147 of 214 letters (68.7%), the largest category, followed by laboratory controls and OOS investigation in 129 (60.3%) (Table 2, Figure 1). Together with production record review (45.8%), these three categories account for the bulk of citations. The share of letters citing data integrity is higher than the figures usually reported for the industry as a whole, which is consistent with the elevated data integrity risk of multi-client, multi-system sites.
Table 2: Deficiency Categories Cited in 214 Warning Letters to Contract Manufacturing Sites
| Rank | Deficiency category | Letters (n) | % of letters |
|---|---|---|---|
| 1 | Data integrity and computerised systems | 147 | 68.7% |
| 2 | Laboratory controls and OOS investigation | 129 | 60.3% |
| 3 | Production record review and batch documentation | 98 | 45.8% |
| 4 | Quality unit authority and oversight | 91 | 42.5% |
| 5 | Deviation / CAPA management | 84 | 39.3% |
| 6 | Facility, equipment and contamination control | 62 | 29.0% |
| 7 | Stability programme deficiencies | 38 | 17.8% |
| 8 | Complaint handling and product quality reviews | 29 | 13.6% |
A letter could cite more than one category, so counts exceed 214.
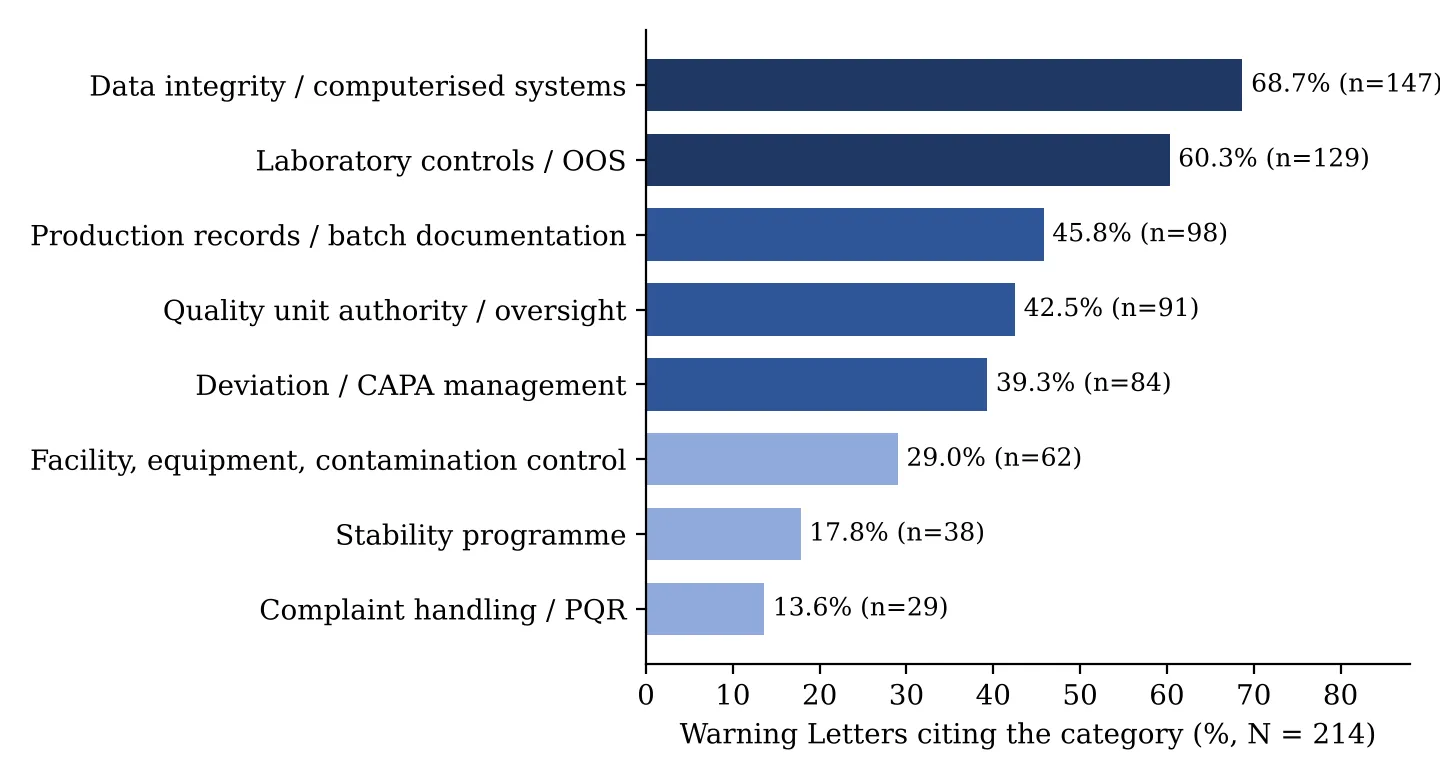
Figure 1: Distribution of Deficiency Categories Across 214 Warning Letters (Percentage of Letters).
Temporal trend. The share of letters citing data integrity rose from 61% in 2019-20 to 76% in 2025, while laboratory controls (58% to 61%) and production records (48% to 46%) were stable and quality unit oversight (40% to 45%) and deviation/CAPA (36% to 42%) drifted upward (Figure 2). Two explanations are plausible and the data cannot separate them: a true rise in computerised-system deficiencies as digitalization outpaced validation and access-control investment, or greater inspection emphasis on data integrity after the dedicated guidance issued in the mid-2010s [10,11].
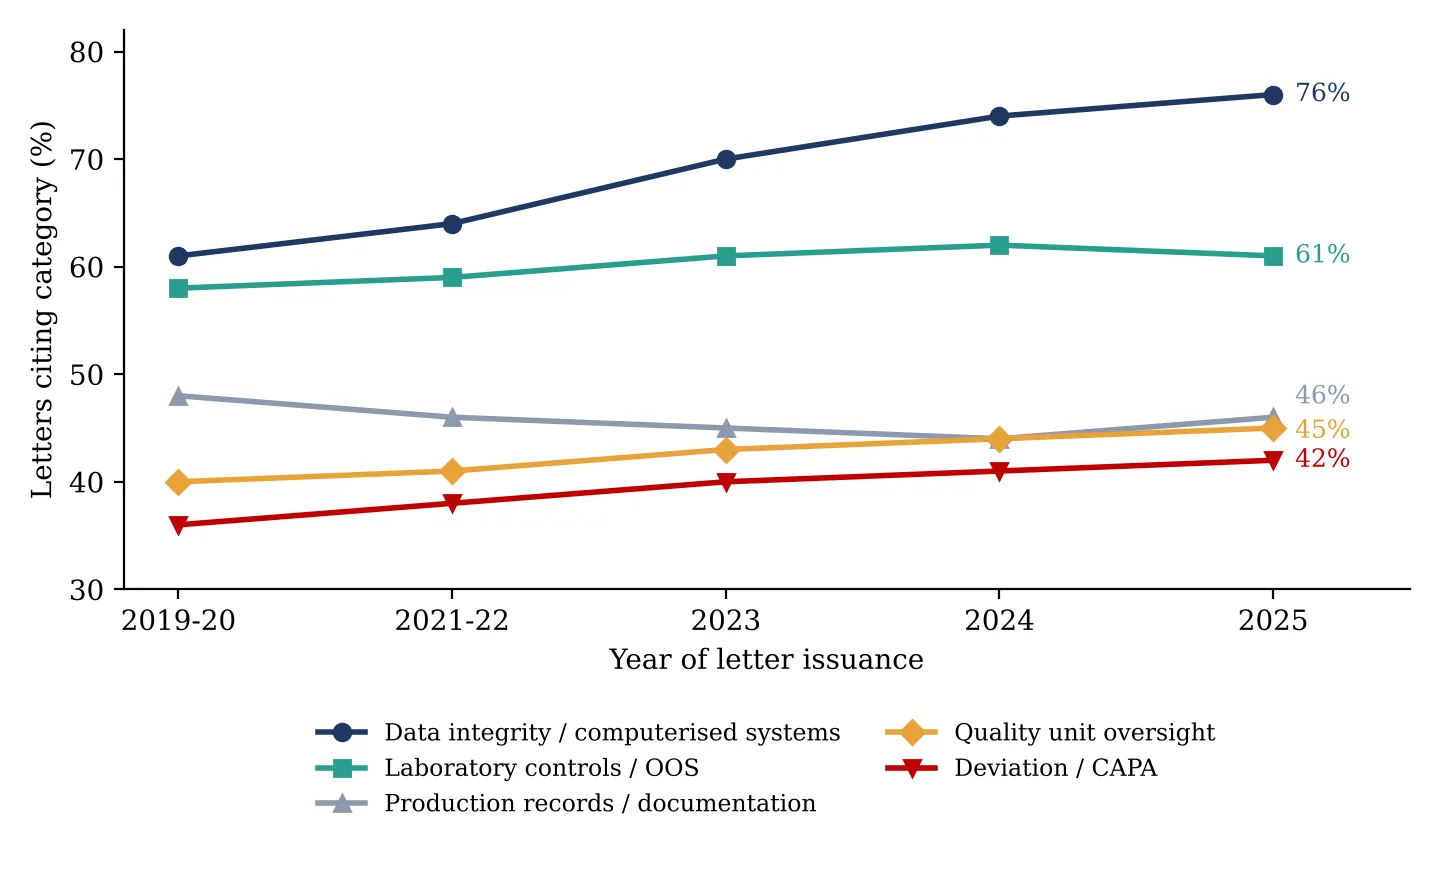
Figure 2: Share of Warning Letters Citing the Five Leading Deficiency Categories, 2019-2025.
Table 3: Ten Most Frequently Cited Sections of 21 CFR Part 211
| Section | Subject | Citations (n) | % of letters |
|---|---|---|---|
| 211.192 | Production record review / investigation of discrepancies | 132 | 61.7% |
| 211.22 | Responsibilities of the quality control unit | 118 | 55.1% |
| 211.68 | Automatic, mechanical and electronic equipment | 104 | 48.6% |
| 211.160 | General laboratory controls | 97 | 45.3% |
| 211.194 | Laboratory records | 93 | 43.5% |
| 211.100 | Written procedures; deviations | 81 | 37.9% |
| 211.42 | Design and construction features | 47 | 22.0% |
| 211.166 | Stability testing | 38 | 17.8% |
| 211.198 | Complaint files | 29 | 13.6% |
| 211.113 | Control of microbiological contamination | 26 | 12.1% |
What the letters describe. Within the data integrity category, the commonest findings were audit trails not reviewed, reviewed for only a few batches, or reviewed without documented evidence; shared logins and excessive administrator privileges; and, in a smaller and more severe subset, deliberate manipulation such as selective reporting of passing results, backdating or deletion of electronic data. Many letters noted the absence of a documented data integrity risk assessment across GMP-critical systems, which regulators treated as a symptom of a wider quality system gap. Laboratory findings centred on invalidating an initial OOS result without scientific justification ("testing into compliance"), not extending investigations to other batches, and weak links between root cause and corrective action [14]. Quality unit findings described batch disposition influenced by production or commercial considerations, and significant deviations reaching the quality unit only after release. Repeat deviations that had previously been "closed" by a CAPA, with no effectiveness check, recurred across deviation/CAPA findings.
Geography. India (79 letters, 36.9%) and China (41, 19.2%) together accounted for about 56% of letters (Table 4), broadly in line with their share of global API and generic finished-dose contract capacity. The analysis could not adjust for inspection frequency or facility numbers, so the distribution is not evidence of differing quality performance. The leading category differed by region: data integrity in India and China, quality unit oversight in US domestic sites and deviation/CAPA in Europe.
Table 4: Region of Cited Facility
| Region | n | % of total | Most frequent category |
|---|---|---|---|
| India | 79 | 36.9% | Data integrity / computerised systems |
| China | 41 | 19.2% | Data integrity / laboratory controls |
| United States | 38 | 17.8% | Quality unit oversight |
| Europe | 22 | 10.3% | Deviation / CAPA management |
| Rest of Asia-Pacific | 19 | 8.9% | Data integrity / documentation |
| Other (Latin America, Middle East, Africa) | 15 | 7.0% | Facility / equipment controls |
Dosage form. Contamination-control citations were far more frequent at sterile/parenteral (52.7%) and biologics (49.1%) sites than at oral solid dosage sites (21.3%), whereas data integrity (72.1% and 74.6%) and laboratory-control citations (64.4% and 68.2%) predominated at oral solid dosage and API sites (Figure 3). Risk assessment of a CMO therefore needs modality-specific weighting.
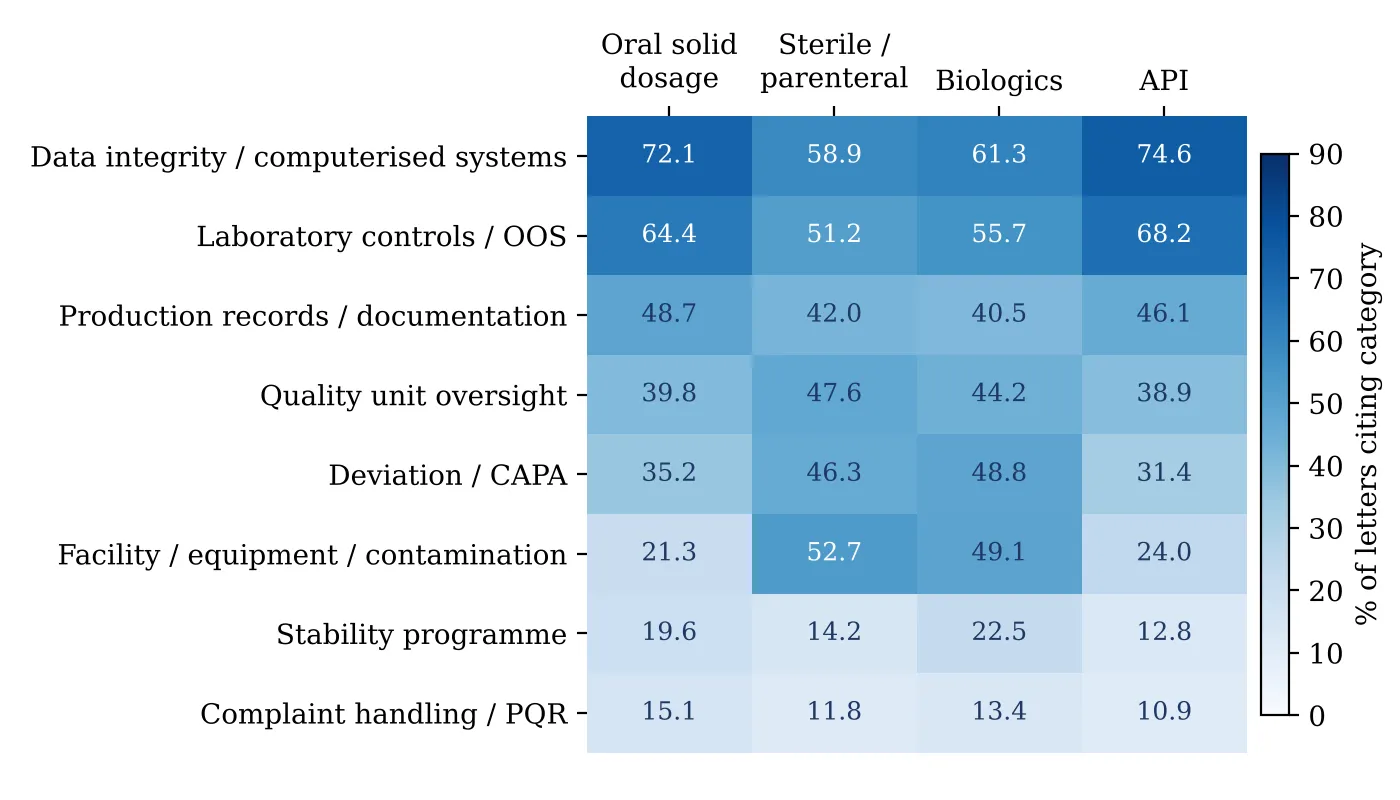
Figure 3: Deficiency Category by Dosage-Form Segment (Percentage of Letters in Segment).
Recalls. Of 47 recall events attributable to contract-site quality issues, content uniformity or assay failure was the most common root cause (14 events, 29.8%), followed by microbial or sterility contamination (9, 19.1%) and labelling or packaging mix-ups on multi-client lines (8, 17.0%) (Table 5). Mix-ups were detected fastest (median 1.0 month), usually through distributor or pharmacy complaints rather than internal controls, while stability failures were detected slowest (median 8.0 months).
Table 5: Recall Root Causes at Contract Manufacturing Facilities (N = 47)
| Root cause | n | % | Median time to detection |
|---|---|---|---|
| Content uniformity / assay out of specification | 14 | 29.8% | 4.5 months |
| Microbial / sterility contamination | 9 | 19.1% | 2.0 months |
| Labelling / packaging mix-up (multi-client line) | 8 | 17.0% | 1.0 month |
| Stability failure / degradation product | 7 | 14.9% | 8.0 months |
| Foreign particulate matter | 6 | 12.8% | 3.0 months |
| Dissolution / impurity profile deviation | 3 | 6.4% | 6.0 months |
3.2 Survey results (n = 88)
Quality-system maturity. Mean self-rated maturity (5-point scale) was highest for document control (3.6) and lowest for computerised system validation (2.8) and self-inspection (2.9) (Figure 4). Every domain showed a monotonic gradient with organisation size: small CMOs rated CAPA at 2.5 and CSV at 2.1, against 3.8 and 3.7 for large CMOs. Self-ratings are subject to optimism bias, so the absolute levels are probably overstated; the between-group gradient is the more robust finding.
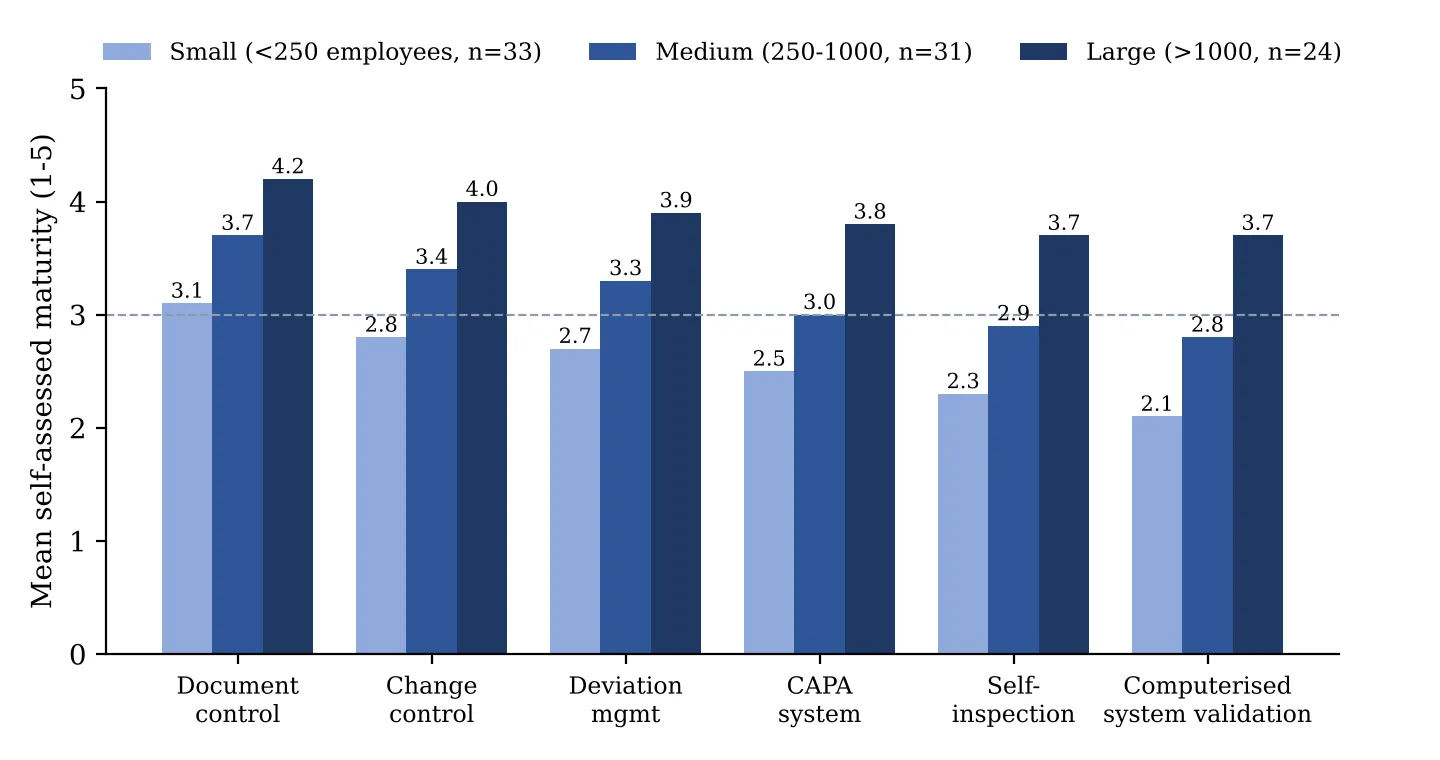
Figure 4: Mean Self-Rated Quality-System Maturity by Organisation Size (5-Point Scale).
Data integrity root causes. Among respondents who identified data integrity as a concern, the most frequently selected root causes were insufficient resourcing for audit-trail review (61 respondents, 69.3%), shared logins or generic accounts (54, 61.4%) and legacy instruments lacking compliant software (49, 55.7%) (Table 6, Figure 5). Production pressure (53.4%) and training gaps (46.6%) followed, while fear of reporting was selected by about one in three (33.0%). Most selected causes are structural and resource-related rather than behavioural.
Table 6: Perceived Root Causes of Data Integrity Gaps (Respondents Could Select Several)
| Root cause | n | % |
|---|---|---|
| Insufficient resources for audit-trail review | 61 | 69.3% |
| Shared logins / generic accounts | 54 | 61.4% |
| Legacy instruments without compliant software | 49 | 55.7% |
| Production or delivery pressure | 47 | 53.4% |
| Inadequate training / data integrity awareness | 41 | 46.6% |
| No second-person verification of critical entries | 33 | 37.5% |
| Fear of reporting errors | 29 | 33.0% |
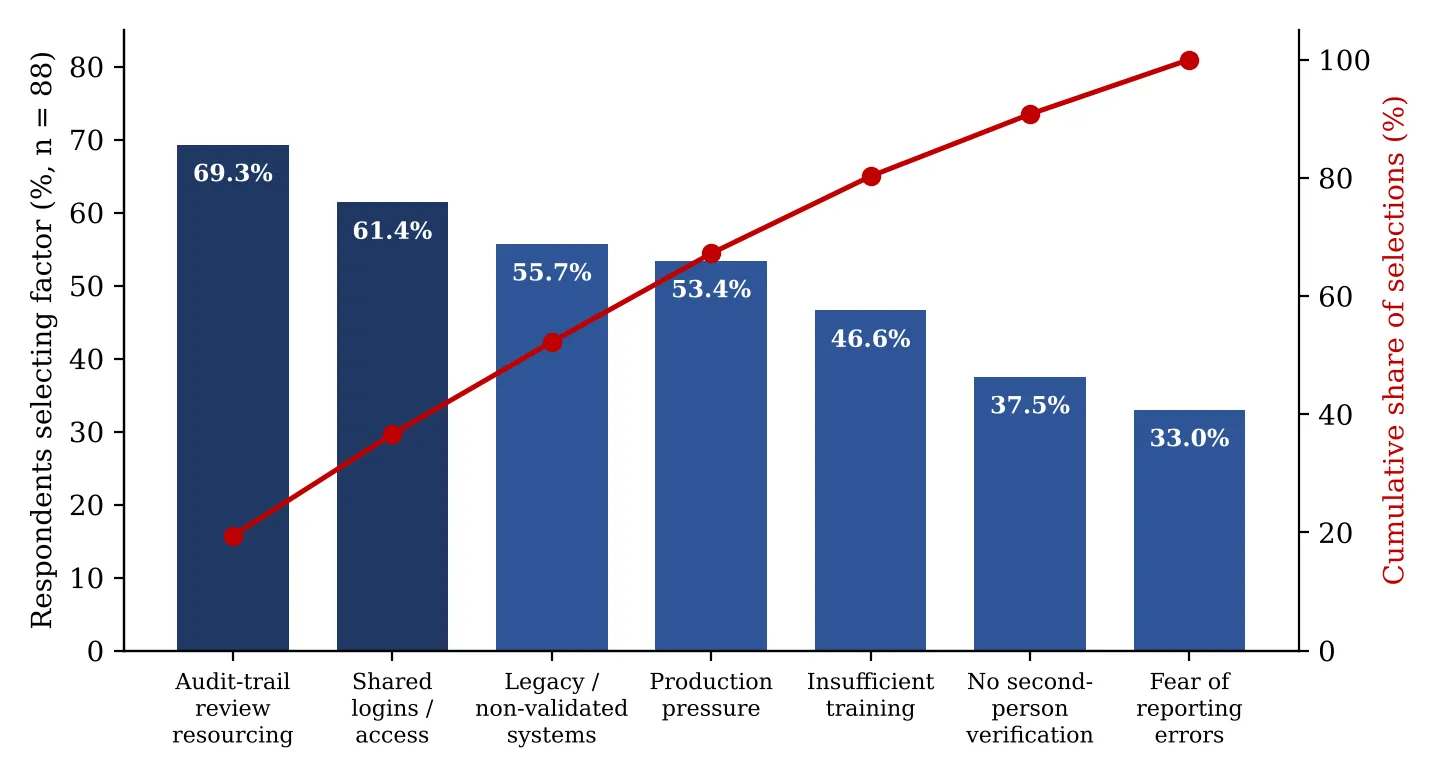
Figure 5: Pareto Chart of Perceived Data Integrity Root Causes (Bars: % Of Respondents; Line: Cumulative Share of Selections).
CAPA and quality agreements. Only 35.2% of respondents verified effectiveness for all CAPAs; 43.2% did so for major CAPAs only, 17.0% ad hoc and 4.5% not at all. Among quality-agreement practices (Table 7), 59.1% reported QA involvement with key suppliers, 50.0% annual supplier requalification, 44.3% defined change-notification timelines, 40.9% deviation/OOS escalation timelines and only 30.7% a dispute-resolution clause.
Table 7: CAPA Effectiveness Verification and Quality-Agreement Practices
| Practice | % of respondents |
|---|---|
| Effectiveness verified for all CAPAs | 35.2% |
| Effectiveness verified for major CAPAs only | 43.2% |
| Effectiveness verified ad hoc | 17.0% |
| No effectiveness verification | 4.5% |
| QA involvement with key suppliers | 59.1% |
| Annual supplier requalification | 50.0% |
| Defined change-notification timelines in agreements | 44.3% |
| Defined deviation/OOS escalation timelines | 40.9% |
| Dispute-resolution clause in agreements | 30.7% |
Technology transfer and audit burden. Of 71 respondents with technology-transfer experience, 58.0% reported gaps in process know-why, 49.3% delays in receiving historical data, 46.5% insufficient joint risk assessment and 39.4% unclear acceptance criteria. Audit fatigue was reported by 74.4%, with CMOs hosting 8-15 sponsor audits a year, and that load competes with the internal self-inspection programme.
Regional contrast. Respondents at sites serving US/EU markets reported higher mean maturity (3.4) than those serving primarily India-based operations (3.0), consistent with the stronger enforcement environment in the former.
Composite Compliance Confidence Index. The CCCI, the mean of the six maturity domains with the share of respondents scoring below 3.0, was 3.14 overall (SD 0.68; 22.7% below 3.0) (Table 8). It rose from 2.71 in small CMOs (39.4% below 3.0) to 3.19 in medium and 3.74 in large CMOs (4.2%), and was lower for India-oriented (2.94; 33.3%) than US/EU-oriented sites (3.28; 15.4%). No inferential testing was performed; the index is descriptive.
Table 8: Composite Compliance Confidence Index by Segment
| Segment | Mean CCCI | SD | % below 3.0 |
|---|---|---|---|
| Overall | 3.14 | 0.68 | 22.7% |
| Small CMOs | 2.71 | 0.71 | 39.4% |
| Medium CMOs | 3.19 | 0.59 | 19.4% |
| Large CMOs | 3.74 | 0.52 | 4.2% |
| US/EU-oriented | 3.28 | 0.63 | 15.4% |
| India-oriented | 2.94 | 0.70 | 33.3% |
Triangulation. The two data sources converge. Data integrity dominates both the enforcement record (68.7% of letters) and respondent concern; CAPA effectiveness and quality-unit oversight weaknesses seen in letters match the low self-rated CAPA and self-inspection maturity; and incomplete quality agreements and technology-transfer gaps explain several recall patterns in the enforcement set.
4. Proposed compliance framework
The findings were translated into an integrated framework with five components, prioritised by a quality risk management (QRM) matrix and implemented through a phased roadmap (Figure 6).
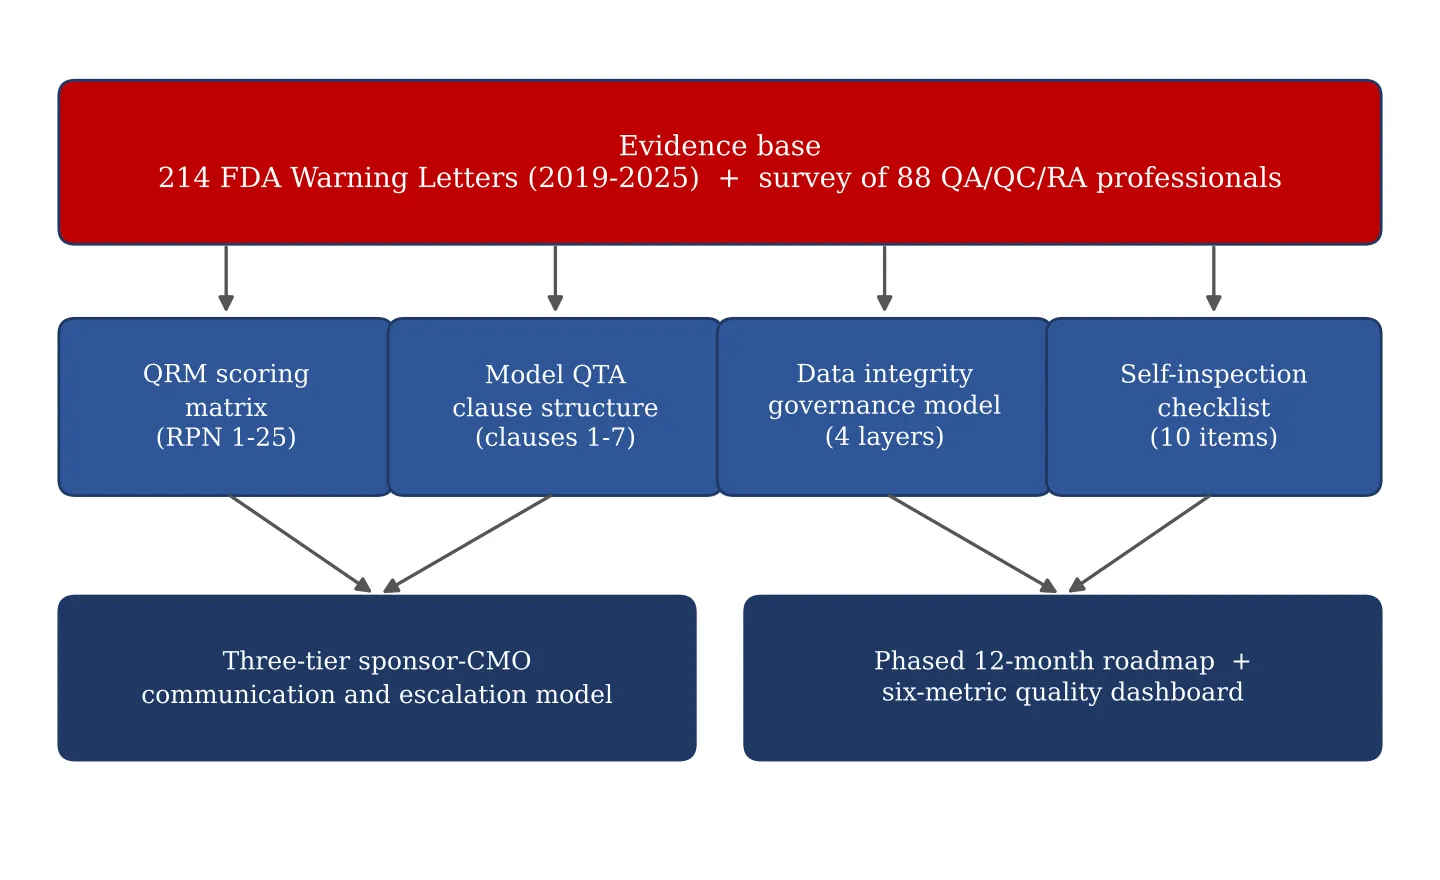
Figure 6: Integrated Compliance Framework for Contract Manufacturing Organizations.
4.1 Risk prioritisation
Each gap was scored for likelihood and severity (1-5) following ICH Q9 (R1) principles [8], giving a risk priority number (RPN = likelihood x severity). RPN of 15 or more calls for immediate action, 8-14 for the next annual plan and below 8 for routine monitoring (Table 9). Audit-trail review gaps and shared access rank highest (RPN 20), reflecting both their frequency in the enforcement record and their severity for product release decisions.
Table 9: Quality Risk Management Prioritisation of Compliance Gaps
| Gap | Likelihood | Severity | RPN | Action |
|---|---|---|---|---|
| Audit-trail review gaps | 4 | 5 | 20 | Immediate |
| Shared access / generic accounts | 4 | 5 | 20 | Immediate |
| CAPA effectiveness not verified | 3 | 4 | 12 | Next annual plan |
| Incomplete quality technical agreement | 3 | 4 | 12 | Next annual plan |
| Technology-transfer gaps | 3 | 4 | 12 | Next annual plan |
| Audit fatigue | 3 | 3 | 9 | Next annual plan |
| Supplier requalification gaps | 2 | 4 | 8 | Next annual plan |
4.2 Model quality technical agreement (QTA)
A model QTA should, beyond the roles and responsibilities matrix required by EU GMP Chapter 7 [13], contain: (i) scope and a RACI matrix for GMP activities; (ii) change control, with immediate notification of changes affecting critical quality attributes or regulatory commitments and 30 days advance notice for others; (iii) escalation of deviations, OOS results and CAPA to the sponsor within 24-48 hours; (iv) data access and audit rights, including remote access to electronic records; (v) restrictions on sub-contracting without sponsor approval; (vi) a dispute-escalation pathway; and (vii) annual joint review of the agreement and quality metrics.
4.3 Data integrity governance
A four-layer model aligned with ALCOA+ principles [10,11] is proposed: (1) governance, with senior-management ownership, a data integrity policy and a risk assessment of every GMP-critical system; (2) technical controls, namely unique user accounts, role-based privileges, enabled audit trails and secure time stamps; (3) procedural controls, namely periodic risk-based audit-trail review, second-person verification and defined data lifecycle rules; and (4) culture, namely non-punitive error reporting, training and management metrics that do not reward speed over accuracy.
4.4 Self-inspection and CAPA effectiveness
A ten-point self-inspection checklist is proposed, covering quality unit independence, batch disposition decisions, deviation and OOS handling, audit-trail review evidence, access control, change control, supplier and contractor oversight, stability, training effectiveness and CAPA effectiveness. Self-inspection should be conducted by staff independent of the area assessed, scheduled on a risk basis, and should itself be tracked to closure. CAPAs should carry predefined, measurable effectiveness criteria and a verification date.
4.5 Sponsor-CMO communication
A three-tier model is proposed: operational (daily or weekly batch and deviation communication), quality (monthly review of metrics, deviations, changes and CAPA) and executive (quarterly or annual governance review). Joint audit programmes and acceptance of shared third-party audit reports can reduce audit fatigue without lowering oversight.
4.6 Implementation roadmap and monitoring
Implementation is proposed over 12 months in four phases (Table 10), with a six-metric dashboard monitored monthly. Escalation triggers are CAPA effectiveness completion below 90%, repeat-deviation rate above 10%, audit-trail coverage below 100% for release-critical systems, QTA currency below 95%, change-notification timeliness below 95% and on-time self-inspection below 100%.
Table 10: Twelve-month Phased Implementation Roadmap
| Phase | Months | Key activities |
|---|---|---|
| 1. Foundation | 1-3 | Data integrity risk assessment of all GMP systems; eliminate shared accounts; baseline maturity assessment; appoint governance owner |
| 2. Agreements | 4-6 | Revise QTAs to the model structure; define change-notification and escalation timelines; set up three-tier communication |
| 3. Systems | 7-9 | Implement risk-based audit-trail review; validate or retire legacy systems; introduce CAPA effectiveness criteria |
| 4. Assurance | 10-12 | Run independent self-inspection using the ten-point checklist; launch metrics dashboard; management review and plan for next cycle |
DISCUSSION
This study combined a systematic classification of 214 Warning Letters with a practitioner survey to describe where contract manufacturers fall short and why. Three findings stand out. First, data integrity is the leading enforcement category (68.7%) and its share is rising (61% to 76%), and respondents attribute it mainly to structural causes: unresourced audit-trail review, shared accounts and legacy systems. This suggests that technical and resourcing remedies will achieve more than additional training alone. Second, maturity falls steeply with organisation size (CCCI 2.71 for small versus 3.74 for large CMOs), so small CMOs, which are often chosen for cost, carry the highest residual risk for sponsors. Third, quality agreements are frequently incomplete, with only 44.3% defining change-notification timelines and 30.7% a dispute-resolution clause, a gap that the recall data connect to delayed detection of problems at multi-client sites.
The framework in Section 4 responds with measures that are low-cost relative to a Warning Letter or recall: a standard QTA structure, unique-account and audit-trail controls, effectiveness criteria for every CAPA, and a small set of leading indicators. It is aligned with, and does not replace, 21 CFR Parts 210 and 211, EU GMP Chapter 7, ICH Q9 (R1) and Q10, PIC/S and WHO guidance [1-9].
CONCLUSIONS
Regulatory compliance failures at CMOs are concentrated in a small number of recurring, largely preventable areas, with data integrity foremost. Quality maturity is strongly related to organisation size, and incomplete quality agreements and weak CAPA effectiveness verification leave sponsors exposed. A risk-prioritised framework combining a model QTA, a four-layer data integrity model, independent self-inspection, three-tier communication and a 12-month roadmap offers a practical route to sustained compliance. Its value now needs prospective testing.
Conflicts of interest.
The authors declare no conflicts of interest.
REFERENCES


Kalpesh Sonwane, Rajesh Nagar, Shikhar Rathore, Regulatory Compliance and Quality Assurance in Contract Manufacturing Organizations (CMOs): Issues and Solutions, Int. J. of Pharm. Sci., 2026, Vol 4, Issue 11, 2526-2536. https://doi.org/10.5281/zenodo.24300293
 10.5281/zenodo.24300293