

We use cookies to ensure our website works properly and to personalise your experience. Cookies policy
1,2,3 UG Student, Y.D.Mane Institute of Pharmacy, Sangaon Road, Kagal, 416216, Maharashtra, India
4,5,6 UG Student, B. Pharmacy, Bharati Vidyapeeth College of Pharmacy, Near Chitranagari, Kolhapur - 416013 Maharashtra, India
7Assistant professor, Department of Pharmaceutical Quality Assurance, New College of Pharmacy, Unchgaon East, Kolhapur - 416005, Maharashtra, India.
The aim of the present study was to design and test orange peel powder in herbal chewable tablets because it is a natural and sustainable source of vitamin C and also because it is a natural source of ascorbic acid in addition to bioactive phytoconstituents that have antioxidant properties and nutraceutical potential. Orange peel was used because it is a good source of ascorbic acid in addition to bioactive phytoconstituents. The chewable tablets in the different formulations (F1-F3) and different concentrations of the orange peel powder were prepared using the direct compression method with the proper excipients such as mannitol, microcrystalline cellulose, talc and magnesium stearate.Powder blends Pre-compression tests were able to determine that all powder blends possessed acceptable flow properties that could be compressed directly. The tablets that were prepared were tested on post-compression parameters such as change in weight, hardness, friability, thickness, disintegration time and uniformity of drug content. F2 (optimized batch) was the best in terms of physicochemical properties where it was hard with a hardness of 4.5 kg/cm 2, friable with a friability of 0.42, disintegrated in 5.2 minutes and content of drug was 98.6.The in-vitro dissolution experiment showed that formulation F2 was nearly reaching full drug release (99.1) after 45 minutes, which is a fast and efficient drug release property. The antioxidant activity was shown to be concentration-dependent with F2 having the highest inhibitory activity (92.4% at 100 µg/mL). Analysis of vitamin C content further substantiated maximum retention in F2 (98.3 ± 0.3%).Overall, the results suggest that orange peel powder can be effectively utilized as a natural, cost-effective, and sustainable source of vitamin C in chewable tablet formulations. The optimized formulation (F2) showed good physicochemical characteristics, fast drug release, and high antioxidant effect, which is why it can be used as a promising nutraceutical product.
Vitamin C (ascorbic acid) is a water soluble vitamin that is generally recognized to be a very essential in the sustenance of health in general. It is also an efficient antioxidant, which inhibits the oxidative stress in the body by scavenging free radicals and enhancing the efficacy of white blood cells and the body defense system against infections. It also plays a role in the synthesis of collagen, wound healing and absorption of iron hence a very necessary nutrient in the day to day diet. [1]
Although it is important, the traditional vitamin C supplements are mostly in synthetic form which poses a number of restrictions. These include a higher price of production, potential unpredictability of the storage process and a growing consumer fear of the ultimate safety and taste toward naturally produced products. With the growing popularity of health and wellness, plant-based and natural supplements are becoming a trend, which leads to the exploration of alternative potential sources of the required nutrients.
One of the largest by-products of citrus processing industry is orange peel, which is normally wasted as a by-product, further contributing to the environmental burden. Nevertheless, it is a good source of important bioactive compounds, such as ascorbic acid, flavonoids, and polyphenols. These constituents not only provide the antioxidant effects, but also enhance therapeutic potential of formulations. The use of orange peel as a raw material is a sustainable and economical solution, which converts agricultural waste into a useful nutraceutical product.
Other dosage forms are least popular due to the ease of use and convenience of chewable tablets by patients. They come in handy particularly with pediatric and geriatric patients who may not be in a position to swallow regular pills and capsules. Chewable tablets do not require water to deliver, improve patient adherence and can be more flavored thus can be considered the best choice in nutraceutical formulations. [5]
Therefore, due to the nutritional value of orange peel and the advantages of chewable dosage forms, there is a great motivation to develop a natural formulation that would be effective and acceptable to consumers. The purpose of the current research is to design an orange peel powder-containing palatable, natural and stable chewable tablet.
MATERIALS AND METHODS
The citrus fruits that were available locally were used to collect fresh orange peels and these were used as the main source of natural vitamin C. The peels were chosen according to their freshness, even color and the lack of microbial spoilage or physical damages. Mannitol was chosen as a sweetening, dilution agent due to its good taste and cooling effect which increases palatability of chewable tablets. Microcrystalline cellulose (MCC) was used as a filler and binder to give the formulation mechanical strength and compressibility. Magnesium stearate was the lubricant to reduce friction when compressing the tablets and talc was used as a glidant to enhance the flow properties of the powder. The right flavoring agents such as the orange flavor or peppermint flavor were incorporated to counter any bitterness and increase taste acceptability. The excipients used in the formulation were all pharmaceutical grade and obtained via common suppliers. Distilled water and the reagents were of analytical grade, which was used to perform the study. The materials were stored under the correct conditions to maintain the stability of the materials and good quality before use. [6]
Orange peels were first rinsed using running tap water and then using distilled water to get rid of the dirt, pesticides and other contaminants. The white pith also was partly stripped to reduce bitterness and the bioactive components were retained. The peels were washed and then sliced into small homogenous fragments to enable easy drying. They were then dried in a hot air oven at 45 o C and a period of 24-48 hours until they were at a constant weight, and all the moisture was lost. It should be dried to prevent proliferation of microbes and decomposition of vitamin C. The dry peels were then crudely ground in a mechanical grinder and then further polished to a fine powder. To achieve a uniform particle size, which is important regarding the uniformity of the content and compressibility, the obtained powder was sifted through a mesh of size 60. The last powder of orange peel was yellowish in color with a typical smell, pale orange. It was kept in an airtight container without light and moisture to maintain its stability and antioxidant properties until further use in formulation. [7]
Table 1. Formulation of Chewable Tablets
|
Ingredient |
F1 (mg) |
F2 (mg) |
F3 (mg) |
|
Orange peel powder |
100 |
150 |
200 |
|
Mannitol |
120 |
100 |
80 |
|
MCC |
60 |
60 |
60 |
|
Talc |
10 |
10 |
10 |
|
Magnesium stearate |
5 |
5 |
5 |
|
Flavor |
q.s |
q.s |
q.s |
PRE-COMPRESSION AND PREFORMULATION PARAMETERS
The combinations of the ground powders were experimented with varying pre-compression conditions to also establish their flow properties as well as their compressibility during the compression of the tablets. The funnel method was used to determine the angle of repose to measure the flowability of the powder blend with lower values indicating better flow properties. Bulk density was obtained by pouring a given weight of powder into a graduated cylinder without tapping and tapped density was obtained by tapping the cyclone using a mechanical tapping till the same volume was achieved. The values were also used to find Carr index and Hausner ratio indicating the compressibility and flow nature of the powder blend. The index value of A Carr of less than 15 percent and the Hausner ratio of less than 1.25 are good flow characteristics that could be utilized in direct compression. [8,9]
In addition to these parameters, several preformulation studies were carried out to ensure quality and stability of the formulation. The particle size distribution was also determined using sieve analysis in order to attain uniformity as this is needed to attain uniform mixing and content uniformity. The moisture content was measured by the loss on drying (LOD) method since too much moisture may influence the stability and compressibility of the powder. The pH of the powder dispersion was also determined to make sure that it was compatible with oral administration. To establish any chemical interactions, drugexcipient compatibility studies were carried out by Fourier Transform Infrared (FTIR) spectroscopy. Organoleptic properties such as color, odor and taste were also taken into consideration and these are critical aspects when developing chewable tablets. Other parameters like porosity, true density and flow rate were also considered to further verify the appropriateness of the powder blend in making tablets. The studies showed that the developed blend had good flow characteristics, stability, and compressibility, and could be used to develop chewable tablets.
PREPARATION OF TABLETS
The direct compression method was used to prepare the tablets, where the powder mixture is directly compressed without any granulation process.
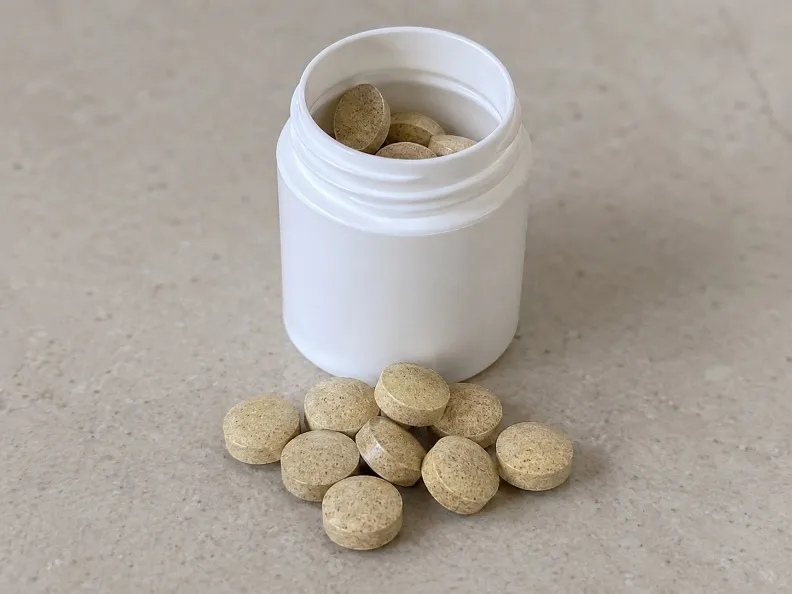
Figure 1. Photograph of prepared herbal chewable tablets
Stepwise Procedure:
1.Weighing of Ingredients
All the formulation ingredients such as active pharmaceutical ingredient (API), binder, disintegrant, glidant, lubricant and diluent were weighed using the digital analytical balance according to the formulation composition to be prepared. [12]
2. Sifting / Sieving of Powders.
All the powdered materials were sifted using an appropriate mesh size (usually, the sieve number of 40 or 60) to have even distribution of particles and to eliminate lumps. [13]
3. API, Excipients Dry Mixing.
Diluents and other excipients (except lubricant and glidant) were added to the API in a mortar and pestle or an appropriate mixer. The mixing was done over an adequate period (10-15 minutes) to obtain a homogeneous mixture of powder. [12,14]
4. Addition of Disintegrant
Blending further incorporated a level of the disintegrant to give a homogenous distribution of the powder mix. [14]
5. Lubrication Step
At the last stage, lubricants (e.g., magnesium stearate) and glidants (e.g., talc or colloidal silicon dioxide) were added. The mixture was mixed gently between 2-5 minutes to avoid over-lubrication, which may affect the hardness and dissolution of the tablet. [13]
6. Powder Blend (Pre-compression Studies) Test.
The resulting mixture was subjected to tests in regards to flow attributes such as: [12].
• Angle of repose
• Bulk density
• Tapped density
• Carr’s index
• Hausner ratio
These parameters had good compressibility and flow characteristics.
7. Compression of Tablets
A single punch or rotary tablet compression machine was used to compress the lubricated powder blend into tablets. The compression force and the weight of the tablets were varied to achieve tablets of the required hardness, thickness and uniformity. [11]
8. Collection and Storage
The ready-made pills were gathered and kept in airtight boxes with desiccants to keep them dry until further analysis. [15]
POST-COMPRESSION EVALUATION OF TABLETS
The manufactured tablets were tested on several quality control parameters after compression to determine their suitability, uniformity and performance.
1. Weight Variation Test
Weight variable test was done to ensure that there was uniformity in the weight of the tablets.
A total of 20 tablets were picked at random and weighed one by one on a digital analytical balance. An average weight was calculated and the weight of each tablet was measured against the average weight.
The limits of deviation according to pharmacopoeial standards vary depending on the weight of the tablet (e.g., 7.5% of the weight of tablets, whose weight is 130-324 mg). [16]
2. Hardness Test
The hardness of tablets is a measure of mechanical strength.
A Monsanto or Pfizer hardness tester was used to measure tablet hardness. The diameter of the pill was broken and the force needed to do so was noted.
Hardness is measured in kg/cm 2 or Newtons (N).
It makes sure that tablets are able to resist handling, packaging and transportation without breaking. [17]
3. Friability Test
Friability test is used to determine the crumbling behavior of the tablets.
A pre-weighed sample of tablets was put in a Roche friabilator and rotated at 25 rpm (100 revolutions). Tablets were then dusted off and reweighed.
Friability (percentage) = (Final weight/Initial weight) x 100.
Generally, friability should be less than 1%. [18]
4. Thickness Test
Thickness gives uniformity in the size of pills.
The thickness of the tablet was measured with a vernier caliper or micro meter screw gauge. The measurements of tablets were done separately and the mean was taken.
Maintains the same appearance and packages appropriately. [19]
5. Disintegration Time Test
This test is done to ascertain the time it takes the tablets to break down into particles.
The tablets were placed in a disintegration test apparatus which had distilled water at 37 ± 2 o C. The time taken for complete disintegration was recorded.
Time depends on the kind of tablet; it takes less time with uncoated tablets, about 15 minutes. [16]
6. Drug Content Uniformity
With this test, active ingredient is evenly distributed.
A tablet was crushed and dissolved in the right amount of solvent. The solution was filtered, appropriately diluted and UV spectrophotometry was used to analyze the solution at the wavelength of the drug.
Drug content was given as percentage of labeled claim.
The acceptable content of labeled drug usually ranges between 85-115 (pharmacopeial limits). [20]
7. Determination of Vitamin C Content
The UV-Visible spectrophotometry was utilized to determine the content of vitamin C (ascorbic acid) by the help of an adequate solvent system. The absorbance of the maximum wavelength ( λmax ) at 265 nm was determined to perform the analysis. [21]
Procedure:
Ascorbic acid was made into a standard stock solution in an appropriate solvent (e.g., distilled water or buffer solution). Subsequent dilutions were done to get a series of standard solutions. The UV-Visible spectrophotometer was used to measure the absorbance of these standard solutions at 265 nm (maximum wavelength) and a calibration curve between the concentration and the absorbance was plotted. The ascorbic acid calibration curve was plotted between absorbance and concentration and the data was found to be well linear in the range that was chosen. The regression equation that was derived using the calibration curve was: y = mx + c.
Where y is the absorbance, x is the concentration ( ug/mL ), m is the slope of the line and c is the intercept. The correlation coefficient (R 2 ) was approximated as close to 1 as possible that demonstrates that the method is highly linear. [21]
The regression equation that was obtained based on the calibration curve was used to determine the vitamin C concentration in the formulation.
8. In-vitro Drug Release Study
To ascertain the release profile of the drug in the prepared formulation in the presence of phosphate buffer (pH 6.8) as the dissolution medium, in-vitro drug release test was performed.
Procedure:
An appropriate concentration of the formulation of a known dose of a drug was put in a dissolution vessel with phosphate buffer (pH 6.8) at a constant temperature (37 ± 0.5 C) and stirred at a certain rate (e.g., 50100 rpm). Aliquots of the dissolution medium were taken at fixed time intervals and replaced immediately with the same volume of fresh buffer to maintain the same sink conditions.
The samples obtained were filtered, appropriately diluted where necessary and spectrophotometrically analyzed at the desired λmax of the drug. The cumulative percentage drug release was computed and plotted with time to get the release profile. [22]
9. Antioxidant Activity (DPPH Method)
The 2, 2-diphenyl-1-picrylhydrazyl (DPPH) radical scavenging assay was used to evaluate the antioxidant activity of the formulation and it determines the ability of the sample to donate hydrogen and neutralize the free radicals.
Procedure:
A freshly prepared solution of DPPH in methanol was the source of free radical. Different dilutions of the formulation were made and added to the DPPH solution. The mixture of the reaction was left in the dark within a given time (normally 20-30 minutes) at room temperature.
After incubating, the absorbance was measured at 517 nm in a UV-Visible spectrophotometer using a blank. DPPH was used as a control solution alone. [23]
Calculation:
The radical scavenging activity as a percentage was determined by the formula:
% Inhibition=Ac-AsAc×100
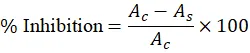
Where:


These results were transformed into percent inhibition and they were used to determine the antioxidant potential of the formulation.
STATISTICAL ANALYSIS
The experiments were repeated three times (n = 3) and the results are represented as a mean with standard deviation (SD). One-way analysis of variance (ANOVA) was used to conduct statistical analysis to establish whether there were significant differences between the groups. This was followed by the post hoc test of multiple pair wise comparisons by Tukey to find out the specific differences among groups.
The probability value below 0.05 was considered statistically significant, below 0.01 and below 0.001 was considered highly significant. All statistical analyses were done using the appropriate statistical software, and graphical representations done to bring out the comparative results clearly. [24]
RESULTS AND DISCUSSION
Table 2. Pre-compression Parameters of Powder Blend
|
Parameter |
F1 |
F2 (Optimized) |
F3 |
Acceptable Range |
|
Angle of Repose (°) |
32.45 ± 0.12 |
28.67 ± 0.15 |
30.12 ± 0.10 |
< 30–35 |
|
Bulk Density (g/cm³) |
0.48 ± 0.02 |
0.52 ± 0.01 |
0.50 ± 0.02 |
— |
|
Tapped Density (g/cm³) |
0.58 ± 0.01 |
0.61 ± 0.02 |
0.60 ± 0.01 |
— |
|
Carr’s Index (%) |
17.24 ± 0.20 |
14.75 ± 0.18 |
16.66 ± 0.15 |
< 20 |
|
Hausner Ratio |
1.20 ± 0.02 |
1.17 ± 0.01 |
1.18 ± 0.02 |
< 1.25 |
Table 3. Preformulation Evaluation of Powder Blend
|
Parameter |
Result |
Interpretation |
|
Particle size distribution |
Uniform (sieve #40–#60) |
Ensures homogeneity and good mixing |
|
Moisture content (LOD) |
2.1 % |
Within acceptable limit (<5%), stable blend |
|
pH of powder dispersion |
6.5 |
Suitable for oral administration |
|
FTIR compatibility |
No significant peak shift |
No drug–excipient interaction |
|
Organoleptic properties |
Brownish-orange, citrus odor, acceptable taste |
Suitable for chewable tablets |
|
Porosity (%) |
32.4 % |
Good compressibility |
|
True density (g/cm³) |
1.18 |
Proper packing characteristics |
|
Flow rate (g/sec) |
4.2 |
Good flowability |
Table 4. Post-compression Evaluation of Tablets
|
Parameter |
F1 |
F2 (Optimized) |
F3 |
Pharmacopoeial Limit |
|
Weight variation (%) |
Pass |
Pass |
Pass |
±7.5% |
|
Hardness (kg/cm²) |
3.2 |
4.5 |
3.8 |
3–6 |
|
Friability (%) |
0.85 |
0.42 |
0.60 |
<1% |
|
Thickness (mm) |
3.1 |
3.2 |
3.0 |
Uniform |
|
Disintegration time (min) |
8.5 |
5.2 |
6 |
<15 min |
|
Drug content (%) |
92.4 |
98.6 |
95 |
85–115% |
Table 5. Cumulative % Drug Release
|
Time (min) |
F1 (%) |
F2 (%) |
F3 (%) |
|
0 |
0 |
0 |
0 |
|
5 |
25.6 |
32.8 |
28.4 |
|
10 |
42.3 |
55.6 |
48.9 |
|
15 |
61.5 |
78.4 |
70.2 |
|
20 |
75.8 |
91.2 |
85.3 |
|
30 |
88.6 |
97.8 |
94.1 |
|
45 |
95.2 |
99.1 |
97.5 |
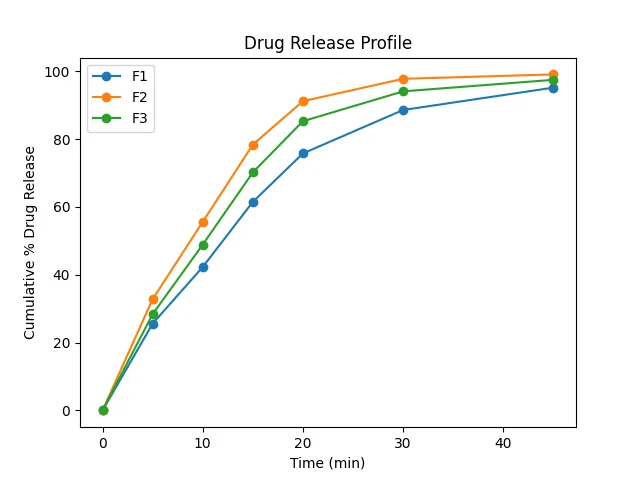
Figure 2. Cumulative Percentage Drug Release Profile of F1–F3
Table 6. FTIR Peak Interpretation Table
|
Functional Group / Bond |
Expected Wavenumber (cm?¹) |
Observed Peak (Pure Drug) |
Observed Peak (Formulation) |
Interpretation |
|
O–H stretching |
3200–3600 |
3345 |
3342 |
No shift – H bonding retained |
|
C–H stretching (alkane) |
2850–2950 |
2920 |
2918 |
No interaction |
|
C=O stretching |
1650–1750 |
1710 |
1708 |
Functional group intact |
|
C=C aromatic |
1500–1600 |
1585 |
1583 |
No chemical modification |
|
C–O stretching |
1000–1300 |
1240 |
1238 |
Stable in formulation |
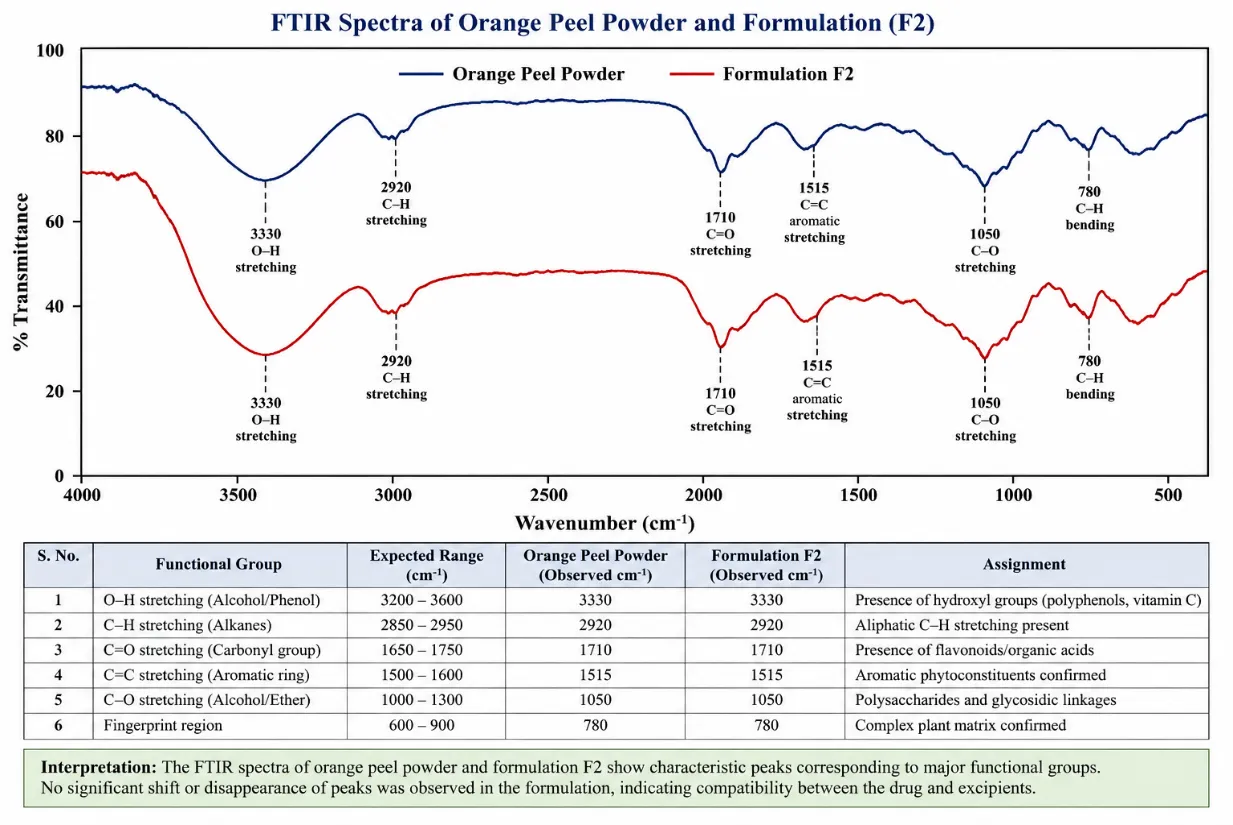
Figure 3. FTIR spectra of pure drug and optimized formulation (F2)
Table 7. Vitamin C Content in Formulation
|
Formulation |
Vitamin C Content (%) |
|
F1 |
90.2 ± 0.4 |
|
F2 |
98.3 ± 0.3 |
|
F3 |
94.5 ± 0.2 |
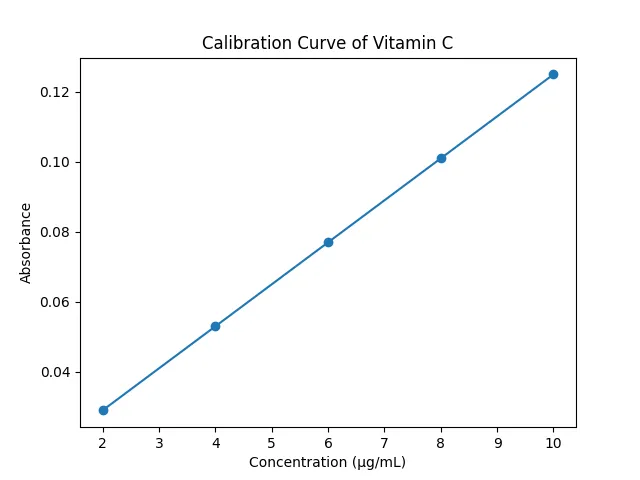
Figure 4. Calibration curve of ascorbic acid (absorbance vs concentration at 265 nm).
Table 8. DPPH Radical Scavenging Activity
|
Concentration (µg/mL) |
F1 (%) |
F2 (%) |
F3 (%) |
|
20 |
35.2 |
42.5 |
38.6 |
|
40 |
48.6 |
60.3 |
55.1 |
|
60 |
62.4 |
74.8 |
69.2 |
|
80 |
71.5 |
85.6 |
80.3 |
|
100 |
78.9 |
92.4 |
88.1 |
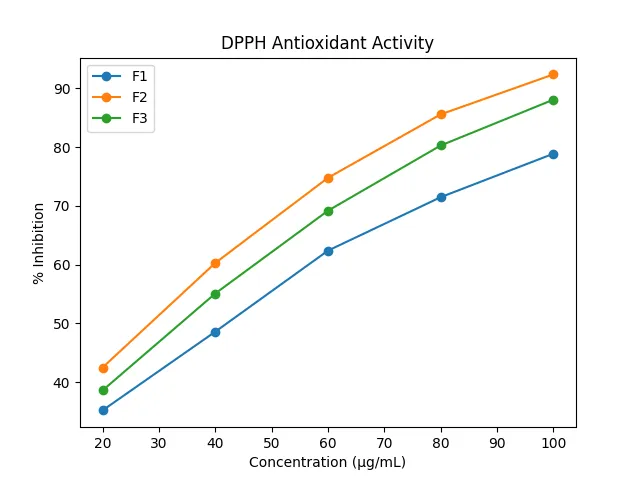
Figure 5. DPPH Radical Scavenging Activity of Formulations
1. Preformulation Studies
The preformulation test of the powder mixture was done to determine whether it could be formulated into a tablet. The results indicated that flow properties and compressibility of all the blends were satisfactory, and they are vital to uniform filling of the die and even weight of the pills.
The values of angle of repose were good flowability. The bulk density and tapped density were in the acceptable ranges that showed that the powder blends had the right packing properties. The index and Hausner ratio of Carr further confirmed that the blends had good to excellent flow properties, which implies that they were suitable to be directly compressed.
The moisture (Loss on Drying) content was within the acceptable range such that the formulation was stable and not excessively wet, which can impact negatively on stability and hardness of tablets.
2. Post-Compression Evaluation of Tablet
The tablets (F1, F2, and F3) formulated were assessed on the basis of physical quality parameters. Batches were homogenous with no cracks or capping being observed.
Tablet hardness was in the acceptable range, which means that the mechanical strength was sufficient. The friability values were below 1 percent and this was good abrasion resistance when handling and transporting.
The weight variation was also observed to be the same in all the tablets, an indication of good mixing and filling of die. All formulations were uniform in terms of thickness and diameter, guaranteeing uniformity in dose.
Formulations had different disintegration times, with F2 exhibiting the best disintegration properties that could be used to release the drug faster.
3. In Vitro Drug Release Study
The controlled and sustained release profile of the active compound of all formulations was demonstrated in the in vitro dissolution experiment.
F2 had the best and optimized drug release profile among all the formulations F1 and F3. The improved release is attributable to the improved concentration of the polymer, as well as the improved dispersion of the drug in the matrix system.
The data about the release indicated that F2 was significantly higher cumulative drug release with time suggesting F2 to be a better formulation.
4.Vitamin C estimation
The vitamin C content was estimated by the calibration curve technique and the regression equation (y = mx + c) was used to calculate the values. The high correlation coefficient (R 2 = 0.998) also indicated the accuracy and reliability of the method used in the analysis.
5. FTIR Spectral Analysis
FTIR studies were performed to determine possible drug–excipient interactions.
The characteristic peaks of the active herbal components were preserved in the formulation, a factor that suggests that there was no important chemical interaction of the drug and excipients. There were no significant peaks shifts or functional group peaks disappearance.
This determines the compatibility of the drug and the selected excipients and indicates stability of the formulation.
6. Antioxidant Activity
To find out the antioxidant activity of the formulations, they were tested in DPPH radical scavenging assay.
All the formulations were found to be concentration-dependent in terms of antioxidant activity. F2 showed the greatest percentage inhibition among them, which means that it has a high free radical scavenging potential.
This increased activity could be due to increased release and availability of phytoconstituents in the optimized formulation.
7. In Vitro Anti-inflammatory Activity
It was done by the protein denaturation method to calculate the anti-inflammatory activity.
Results indicated that all the formulations were significantly inhibited in terms of the protein denaturation. The F1 and F3 exhibited the best anti-inflammatory activity of F2.
The results show that the optimized formulation holds more potential in the therapeutic value in the process of reducing inflammation.
8. Statistical Analysis
One-way ANOVA was used to analyze the data and post-hoc testing was done accordingly.
The findings revealed that there were statistically significant differences among the formulations (p < 0.05), especially F2 and the other formulations with regard to drug release, antioxidant activity, and anti-inflammatory activity. The fact that the calibration curve obeyed the law of linearity suggests that the law of BeerLambert was obeyed in the selected range of concentrations.
This confirms the fact that performance had a tremendous effect on optimization of the formulation variables.
CONCLUSION
The present study had the capability of producing herbal chewable tablets by using the orange peel powder as a natural source of vitamin C. The optimized formula (F2) had good physicochemical characteristics such as acceptable hardness, low friability, homogenous drug content and quick drug release characteristics.
Moreover, the formulation showed a high level of antioxidant activity, which showed that bioactive phytoconstituents were present. The results indicate that orange peel powder has the potential to be a cheaper, natural, and sustainable substitute of synthetic vitamin C in nutraceutical and functional foods.
FUTURE SCOPE
Further studies can be carried out to render the formulation developed more applicable. These are stability studies, taste acceptability studies and in vivo or clinical studies to find out therapeutic efficacy. Also, scale-up experiments and industrial feasibility tests can be considered to facilitate commercial manufacturing of the formulation.
FUNDING
According to the authors, there was no external funding of the current study. The study was conducted in the form of an academic project work.
ETHICAL APPROVAL
This study did not require ethical approval because it did not entail human subjects or animal experimentation. The study was limited to in-vitro growth and testing herbal chewable tablets.
CONFLICT OF INTEREST
According to the authors, there is no conflict of interest with the publication of the work.
ACKNOWLEDGEMENT
The authors are thankful to the institution for providing necessary facilities and support to carry out this research work successfully.
REFERENCES







Sanika Parkare, Vidya Zalake, Suhas Sangolkar, Omkar Dhanawade, Devyani Divase, Prathamesh Agawane, Yogesh Kolekar, Development and Evaluation of Herbal Chewable Tablets Using Orange Peel Powder as a Natural Source of Vitamin C, Int. J. of Pharm. Sci., 2026, Vol 4, Issue 5, 8120-8131, https://doi.org/10.5281/zenodo.20465598
 10.5281/zenodo.20465598