

We use cookies to ensure our website works properly and to personalise your experience. Cookies policy
Mandesh Institute of Pharmaceutical Science and Research Center, Mahswad, Man, Satara, Maharashtra, India 415509
Pioglitazone and Rosiglitazone tablets contain two oral antihyperglycemic drugs used in the management of type 2 diabetes: Pioglitazone and Rosiglitazone hydrochloride. A simple, new, precise, economic, accurate, robust, rugged, specific and sensitive, isocratic RP- HPLC stability indicating method has been developed and subsequently validated for the determination of Pioglitazone and Rosiglitazone in API and pharmaceutical dosage forms as per ICH guidelines. A stability-indicating RP-HPLC method was developed and validated for simultaneous estimation of Pioglitazone and Rosiglitazone. Chromatographic separation was achieved on a Phenomenex Gemini C18 column (250 × 4.6 mm, 5 µm) using Methanol:Phosphate Buffer pH 4.2 (20:80 v/v), flow rate 1.0 mL/min, detection at 246 nm, and run time 7 min. Retention times were approximately 2.47 min (Pioglitazone) and 4.32 min (Rosiglitazone). The method was validated according to ICH guidelines and applied to assay, linearity, precision, accuracy, robustness, ruggedness and forced degradation studies.
Type 2 diabetes mellitus is commonly treated with oral antihyperglycemic agents. Reliable analytical methods are required for quality control and stability assessment of combined dosage forms containing Pioglitazone and Rosiglitazone. Rosiglitazone and Pioglitazone work by helping to restore your body’s proper response to the insulin you naturally produce. Pharmaceutical analysis is the branch of chemistry involved in separating, identifying and determining the relative amounts of the components making up a sample of matter. It is mainly involved in the qualitative identification or detection of compounds and quantitative measurements of the substances present in bulk drug and pharmaceutical preparations.
Drug profile:
Name of the Drug: Pioglitazone
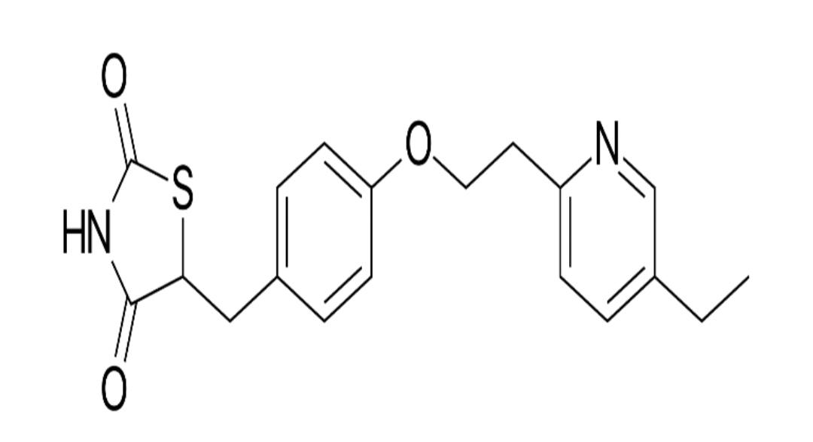
Fig. no.1
Name of the drug : Dulaglutie
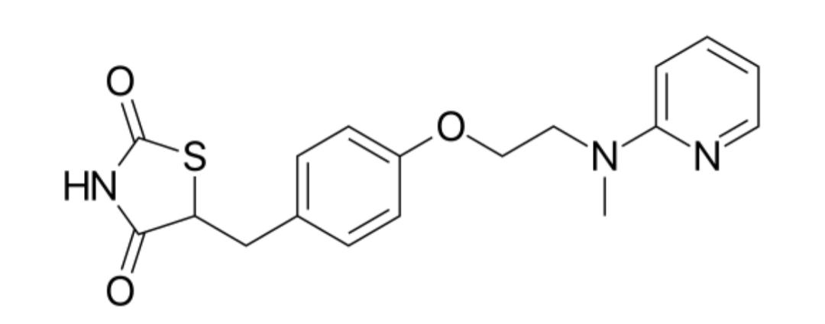
Fig. No.2
MATERIALS AND METHODS:
Column: Phenomenex Gemini C18 (250×4.6 mm, 5 µm). Mobile phase: Methanol : Phosphate Buffer pH 4.2 (20:80 v/v). Flow rate: 1.0 mL/min. Detection wavelength: 246 nm. Injection volume and validation studies were performed according to ICH guidelines.
Method Development
RP-HPLC Method Development and Validation for Pharmaceutical Analysis:
An RP-HPLC method was developed for the simultaneous estimation of Pioglitazone and Rosiglitazone. Various mobile phase compositions comprising methanol, acetonitrile, and water were evaluated during method optimization. Optimum chromatographic separation with satisfactory peak shape and resolution was achieved using a mobile phase consisting of Methanol: Phosphate Buffer (pH 4.2) in the ratio of 20:80 (% v/v).
Different stationary phases including C18, Symmetry, and X-Bridge columns were investigated. The Phenomenex Gemini C18 column (250 mm × 4.6 mm, 5 µm) was selected as the most suitable column due to its superior chromatographic performance.
The optimized chromatographic conditions were: Phenomenex Gemini C18 column (250 mm × 4.6 mm, 5 µm), mobile phase of Methanol: Phosphate Buffer (pH 4.2) (20:80 v/v), flow rate of 1.0 mL/min, detection wavelength of 246 nm, injection volume of 20 µL, column temperature of 32°C, and run time of 7 min. Analysis was performed using a Waters HPLC system equipped with an autosampler and PDA detector.
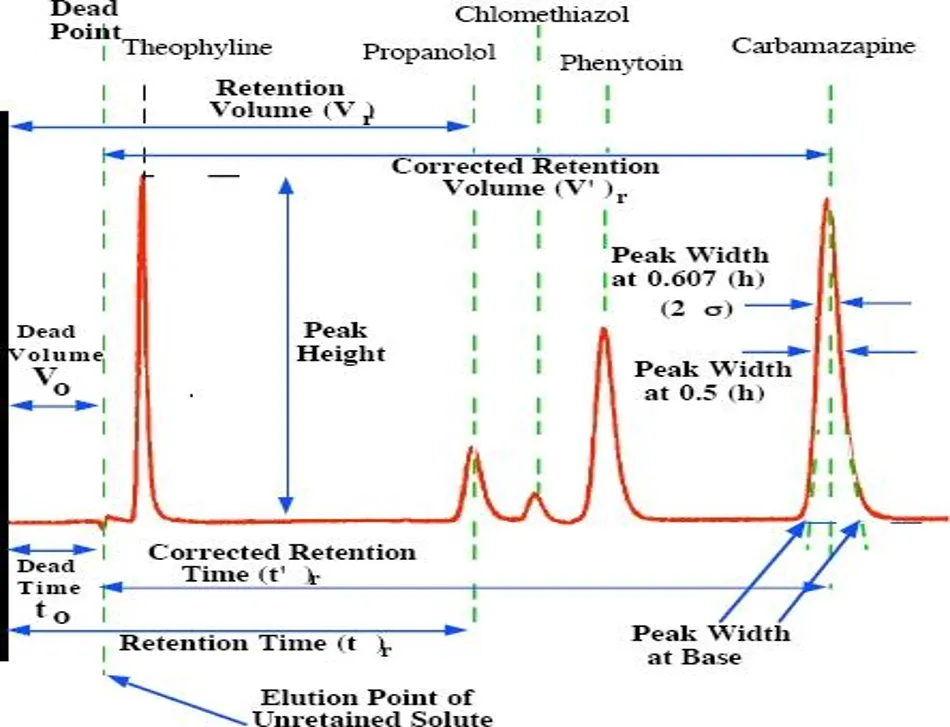
Fig.no.3-The Nomenclature of Chromatogram
Method Validation
The developed method was validated according to ICH guidelines for system suitability, specificity, linearity, and precision.
System Suitability: The standard solution containing Pioglitazone (60 µg/mL) and Rosiglitazone (80 µg/mL) was injected five times. The %RSD of peak areas was found to be within acceptable limits, indicating good system performance.
Specificity: The method demonstrated adequate specificity with no interference from tablet excipients at the retention times of Pioglitazone and Rosiglitazone. Assay analysis confirmed accurate quantification of both analytes in the pharmaceutical formulation.
Linearity: Linearity was evaluated over the concentration ranges of 20–100 µg/mL for Pioglitazone and 40–120 µg/mL for Rosiglitazone. Calibration curves were constructed by plotting peak area against concentration, and excellent linear relationships were obtained with correlation coefficients (r²) close to 1.000.
Precision: Method precision was assessed by repeatability studies using six replicate injections of the standard solution. The %RSD values for peak areas were within the acceptable limit of less than 2%, demonstrating the precision and reproducibility of the method.
The validated RP-HPLC method was found to be simple, precise, specific, and suitable for routine quality control analysis of Pioglitazone and Rosiglitazone in pharmaceutical dosage forms.
Characterization of Pioglitazone and Rosiglitazone
Solubility Studies
The solubility of Pioglitazone and Rosiglitazone was evaluated in various solvents according to the Indian Pharmacopoeia (I.P., 1996) procedure. Accurately weighed drug samples were subjected to solubility testing using water, methanol, and DMSO under ambient conditions.
Pioglitazone exhibited good solubility in methanol, ethanol, DMF, and DMSO, while it was found to be practically insoluble in water and insoluble in ether. The drug showed slight solubility in acetone and acetonitrile.
Rosiglitazone was found to be freely soluble in water and exhibited slight solubility in alcohol. However, it was practically insoluble in acetone and methylene chloride.
The solubility profile of both drugs indicated that methanol was a suitable solvent for the preparation of standard and sample solutions during method development and validation studies.
UV Spectrophotometric Method :
A simple, accurate, and economical UV spectrophotometric method was developed for the simultaneous estimation of Pioglitazone and Rosiglitazone using methanol as the solvent. Standard stock solutions of both drugs were prepared by dissolving accurately weighed 10 mg of each drug in methanol and suitably diluting to obtain working standard solutions.The absorption spectra of Pioglitazone and Rosiglitazone were recorded in the wavelength range of 200–400 nm. The maximum absorbance (λmax) was observed at 223 nm for Pioglitazone and 264 nm for Rosiglitazone, while the isosbestic point was found at 254 nm.Calibration curves were constructed by measuring absorbance at the selected wavelengths over concentration ranges of 2–80 μg/mL for Pioglitazone and 5–70 μg/mL for Rosiglitazone. Beer–Lambert’s law was obeyed within these concentration ranges. The regression equations obtained were:
Pioglitazone
At 223 nm: y = 0.0303x + 0.0489 (R² = 0.9997)
At 264 nm: y = 0.0185x + 0.0408 (R² = 0.9998)
Rosiglitazone
At 223 nm: y = 0.0213x + 0.0242 (R² = 0.9997)
At 264 nm: y = 0.0307x + 0.0055 (R² = 0.9996)
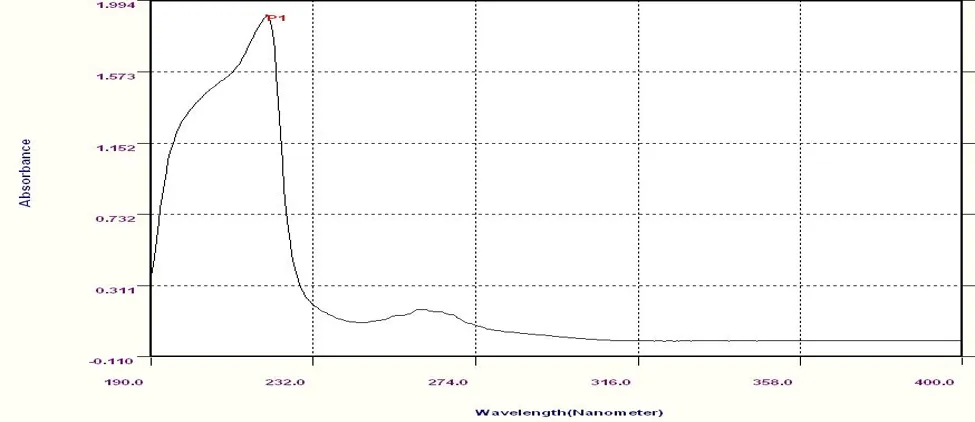
Fig.no.4 UV spectrum for Pioiglitazone
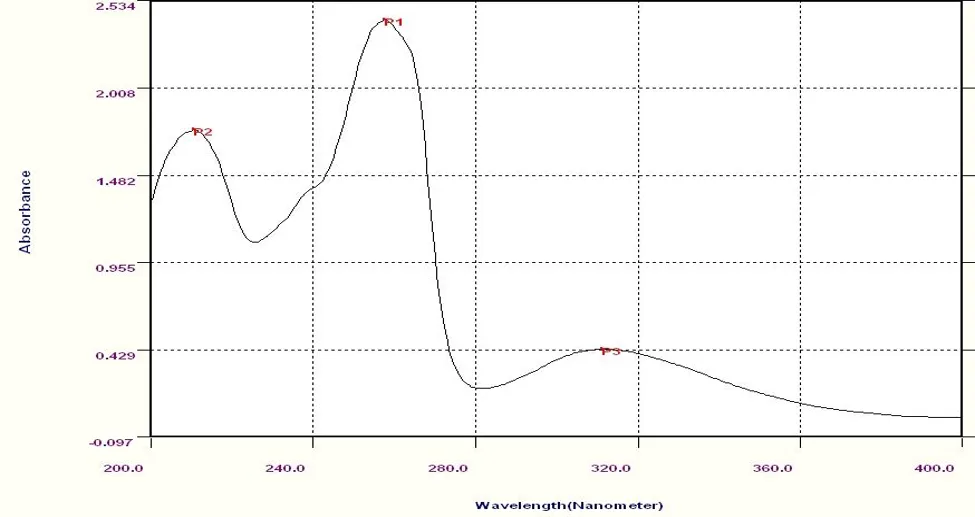
Fig.no.5:- UV Spectrum for Rosiglitazone (264nm)
Method Validation
The developed method was validated according to ICH guidelines with respect to linearity, accuracy, precision, sensitivity, and assay.
Linearity
Excellent linearity was observed over the concentration ranges of 2–80 μg/mL for Pioglitazone and 5–70 μg/mL for Rosiglitazone, with correlation coefficients greater than 0.999, indicating a strong linear relationship between concentration and absorbance.
Accuracy
Accuracy was evaluated using the recovery method at three concentration levels. The mean percentage recoveries were 99.38% for Pioglitazone and 99.78% for Rosiglitazone, with %RSD values below 1%, demonstrating the accuracy of the method.
Precision
Repeatability studies were performed at the target concentration level (n = 6). The %RSD values obtained were 0.437% for Pioglitazone and 0.096% for Rosiglitazone, confirming the excellent precision of the developed method.
Limit of Detection and Limit of Quantification
The sensitivity of the method was evaluated using LOD and LOQ values. The LOD values were found to be 0.3265 μg/mL for Pioglitazone and 0.9256 μg/mL for Rosiglitazone, while the LOQ values were 0.4265 μg/mL and 1.2154 μg/mL, respectively, indicating good sensitivity.
Assay of Pharmaceutical Formulation
The validated method was successfully applied to the analysis of tablet dosage forms. The assay results showed drug contents of 14.856 mg/tablet for Pioglitazone and 499.785 mg/tablet for Rosiglitazone, confirming the applicability of the method for routine quality control analysis.
Conclusion
The proposed UV spectrophotometric method was found to be simple, rapid, precise, accurate, and sensitive for the simultaneous estimation of Pioglitazone and Rosiglitazone in bulk drugs and pharmaceutical dosage forms. The method complies with ICH validation requirements and is suitable for routine analytical applications.
RESULT AND DISCUSSION:
TRAILS FOR METHOD DEVELOPMENT
Trail 1:
Mobile phase : Methanol: Water (80:20%v/v)
Column : X-Bridge (4.6 ×150mm, 5µm particle size)
Waters Flow rate : 1.0ml/min
Wavelength : 246nm
Column temp : 32ºC
Injection Volume : 20µl
Run time : 5 minutes
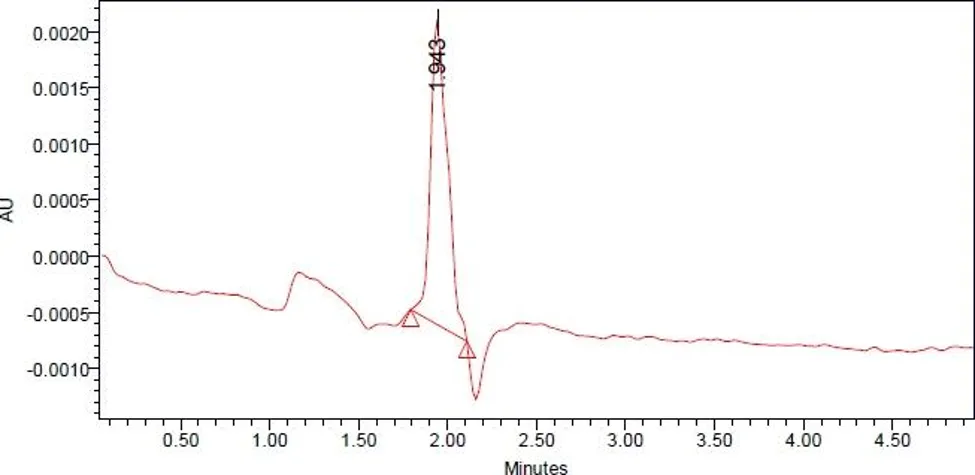
Fig. 6 (a) :- Chromatogram for Trial 1
Table 1 (a) :- Peak Results for Trail 1
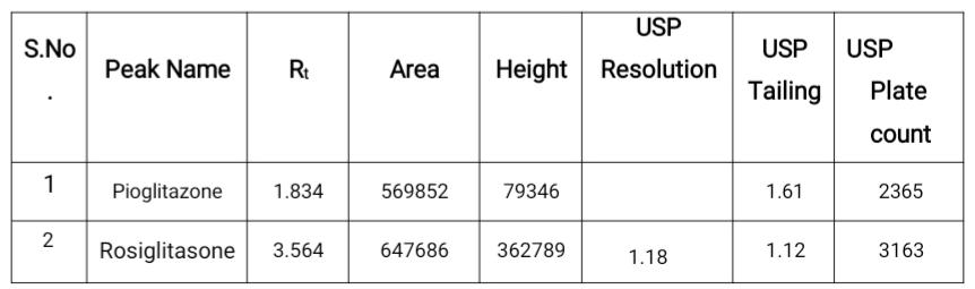
Observation: This trial shows improper separation of sample peaks and less plate count, improper baseline in the chromatogram. So more trials were required for obtaining good peaks.
Trail 2:
Mobile phase : Methanol: Acetonitrile (40:60 v/v)
Column : Hypersil C18 (4.6mm×250mm) 5µ Particle Size
Flow rate : 0.9 ml/min
Wavelength : 246nm
Ambient Injection Volume : 10µl
Run time : 10 minutes
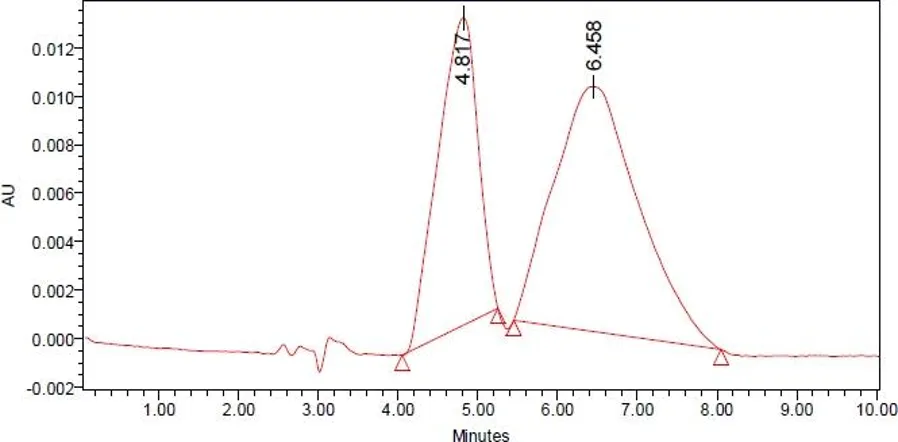
Fig. 6 (b) :- Chromatogram for Trail 2
Table2(b) :- Peak Results for Trail 2
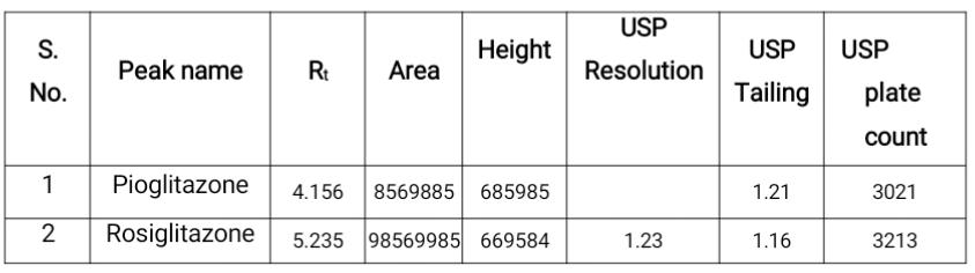
Observation: From the above chromatogram it was observed that the baseline is improper and sample peaks are not well separated. So it requires more trials to obtain well peaks.
Trail 3:
Mobile phase : Methanol: Water (60:40 % v/v)
Column : Symmetry C18 (4.6 × 250mm 5µm)
Flow rate : 0.9 ml/min
Wavelength : 255 nm
Column temp : 30ºC
Injection Volume : 15µl
Run time : 6 minutes
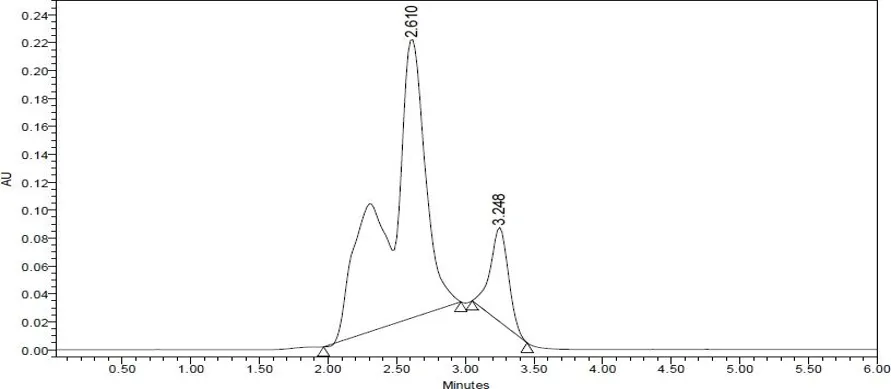
Fig. 6 © :- Chromatogram for Trail 3
Table 1© :- Peak Results for Trail 3
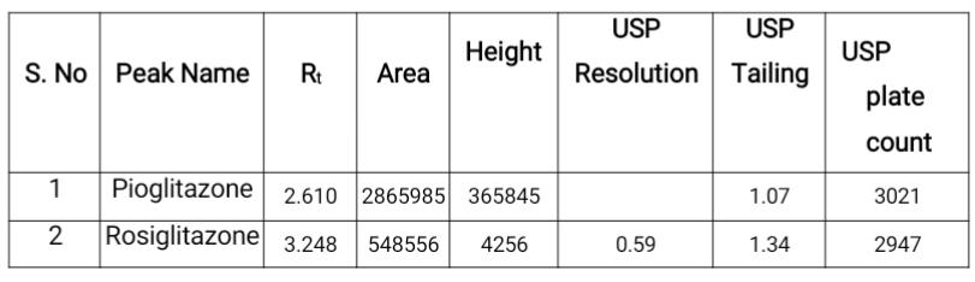
Observation: This trial show very less plate count and sample peaks are not well separated, so more trials were required for obtaining good peaks.
Trail 4:
Mobile phase : Acetonitrile: Acetate Buffer (30:70 % v/v)
Column : Symmetry C18 (4.6mm×150mm, 5µm)
Flow rate : 1.0 ml/min
Wavelength : 246 nm
Column temp : 34ºC
Injection Volume : 10µl
Run time : 10 minutes
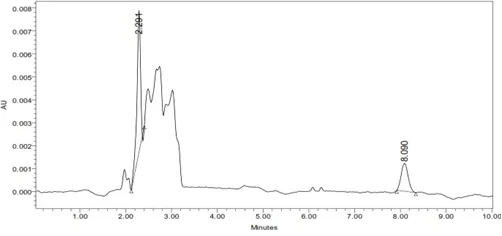
Fig.6 (d) :- Chromatogram for Trail 4
Table 1 (d) :- Peak Results for Trail 4
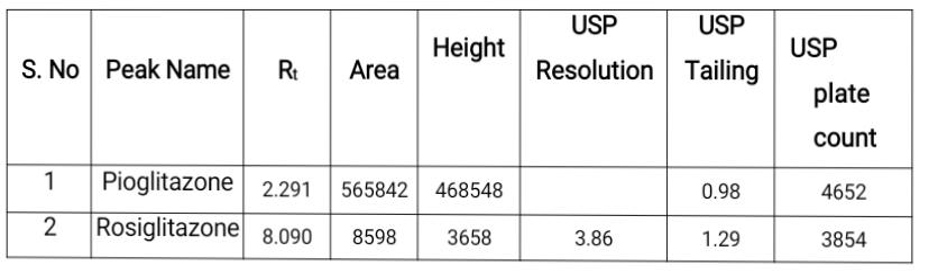
Observation: This trial show very narrow peak and also retention time was more, so more trials were required for obtaining good peaks.
Trail 5:
Mobile phase : Methanol: Phosphate Buffer pH-3.6 (45:55v/v)
Column : Phenomenex Gemini (250mmx4.6mm) 5µm Particle size
Column Flow rate : 0.9 ml/min
Wavelength : 246 nm
Column temp : 38ºC
Injection Volume : 15µl
Run time : 10 minutes
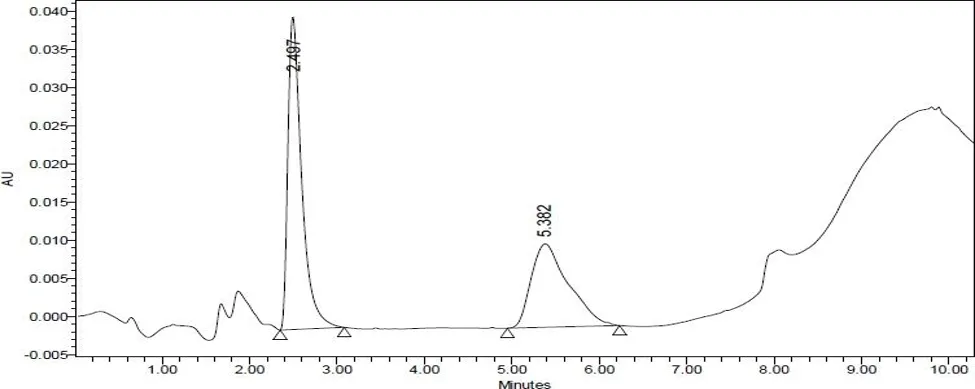
Fig. 6( e):- Chromatogram for Trail 5
Table 1 E :- Peak Results for Trail 5
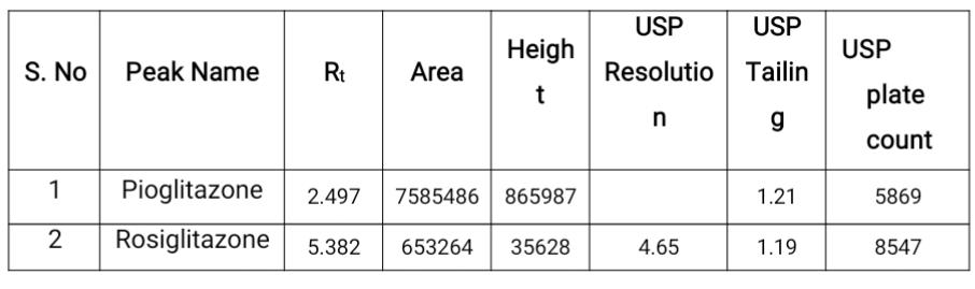
Observation: Stabilization was not good and more tailing peaks were observed, theoretical plates were less and tailing was more than limit.
Optimized Chromatogram (Sample)
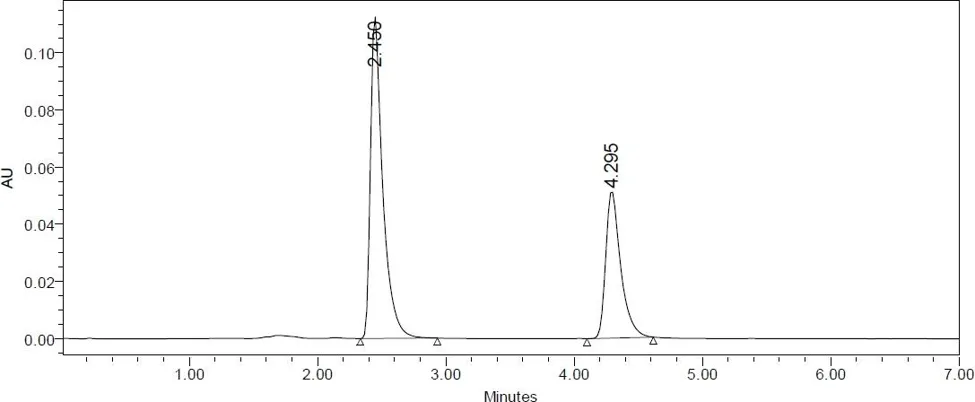
Fig. 7:- Optimized Chromatogram (Sample)
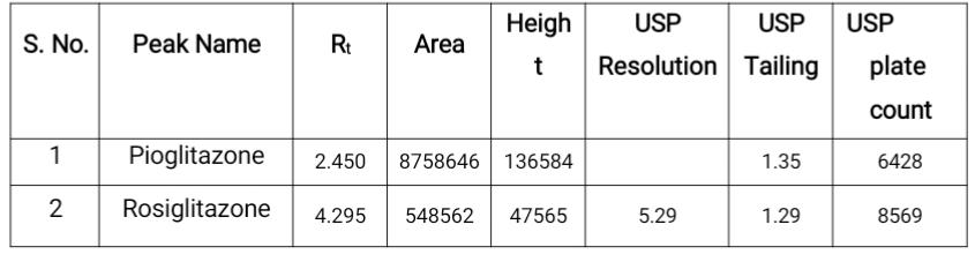
Table 2:- Optimized Chromatogram (Sample)
Acceptance Criteria:
Optimized chromatographic conditions produced well resolved peaks with retention times near 2.466 min and 4.323 min for Pioglitazone and Rosiglitazone, respectively. Validation studies demonstrated acceptable system suitability, precision, accuracy, linearity, robustness, ruggedness and specificity. Forced degradation studies under acidic, basic, oxidative, thermal, photolytic and neutral conditions confirmed the stability-indicating nature of the method. RP-HPLC Method Development and Validation for Simultaneous Estimation of Pioglitazone and Rosiglitazone
Method Development
Several chromatographic conditions were investigated to achieve satisfactory separation of Pioglitazone and Rosiglitazone. Different mobile phase compositions, columns, flow rates, and chromatographic parameters were evaluated. Initial trials using methanol-water, methanol-acetonitrile, and acetonitrile-buffer systems resulted in inadequate peak separation, poor baseline resolution, low theoretical plate counts, and peak tailing.
An optimized chromatographic condition was achieved using a Phenomenex Gemini C18 column (250 mm × 4.6 mm, 5 μm particle size) with a mobile phase consisting of Methanol: Phosphate Buffer (pH 4.2) in the ratio of 20:80 (%v/v). The flow rate was maintained at 1.0 mL/min, the column temperature at 32°C, and detection was carried out at 246 nm with an injection volume of 20 μL.Under the optimized conditions, Pioglitazone and Rosiglitazone were eluted at retention times of 2.466 min and 4.323 min, respectively. The chromatographic peaks were well resolved with a resolution value of 5.28. The tailing factors were 1.34 and 1.28, while theoretical plate counts were 6358 and 8476 for Pioglitazone and Rosiglitazone, respectively, indicating excellent chromatographic performance.
Method Validation
System Suitability
System suitability studies were performed by injecting standard solutions five times. The %RSD of peak areas was found to be 0.042% for Pioglitazone and 0.17% for Rosiglitazone, demonstrating adequate system performance. All chromatographic parameters met the predefined acceptance criteria, including resolution (>2), theoretical plate count (>2000), and tailing factor (<2).
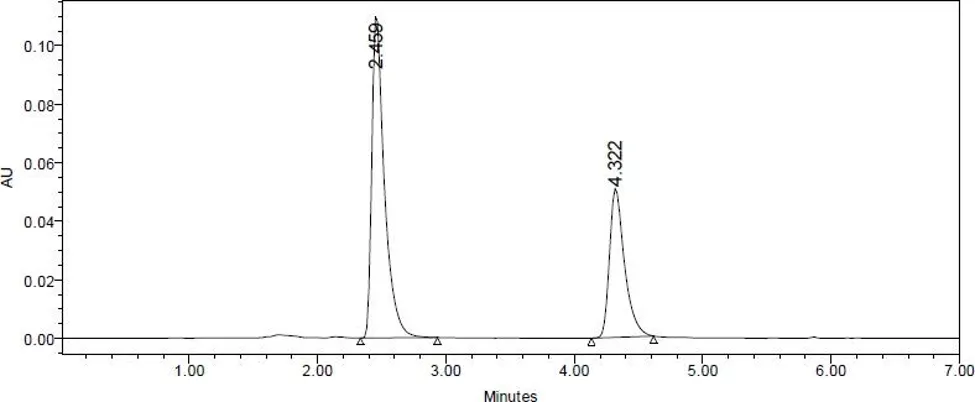
Fig. 8 (a) :- Chromatogram showing injection – 1
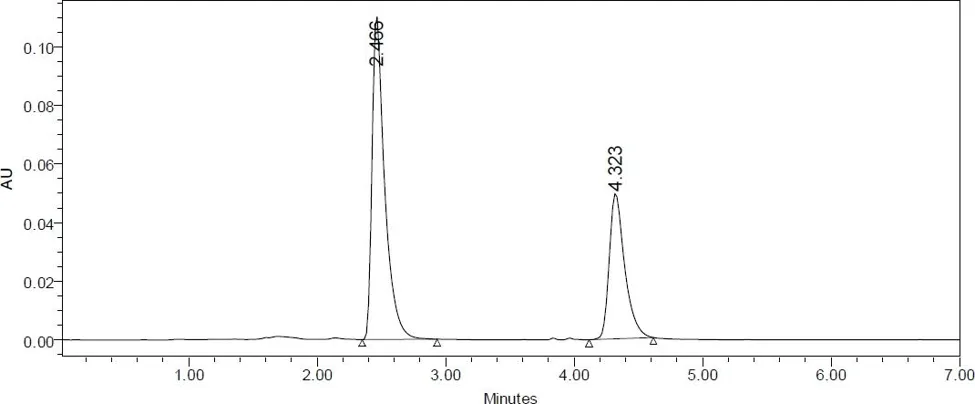
Fig. 8 (b) :- Chromatogram showing injection – 2
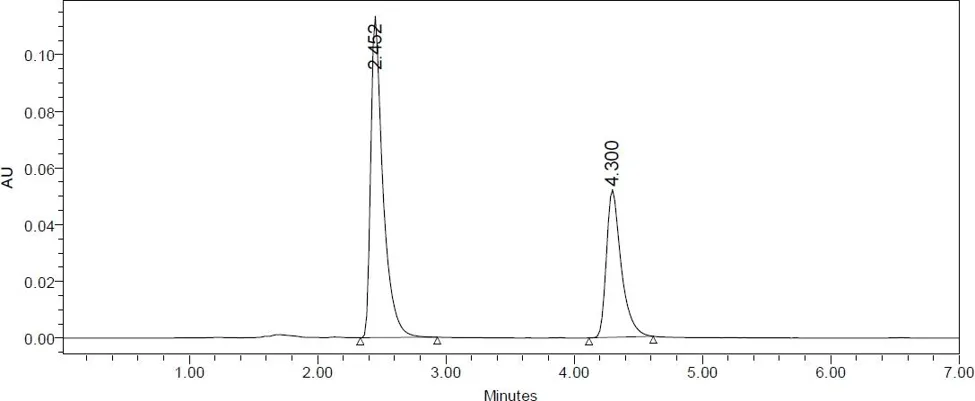
Fig. 8© :- Chromatogram showing injection – 3
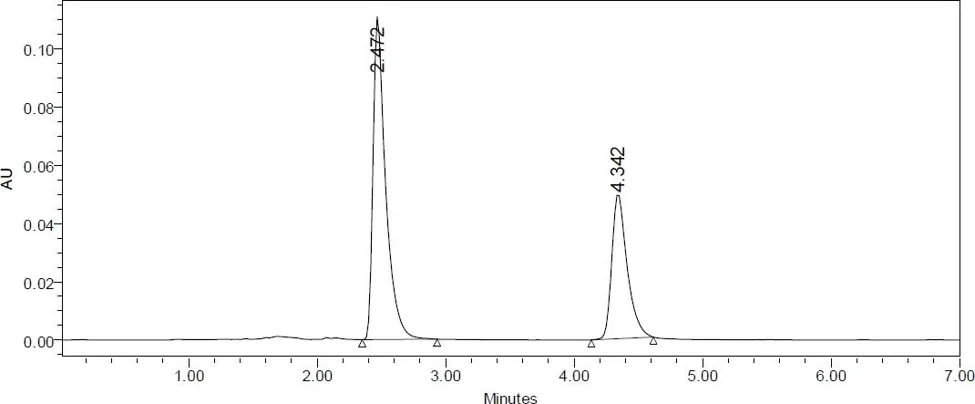
Fig. 8 (d) :- Chromatogram showing injection – 4
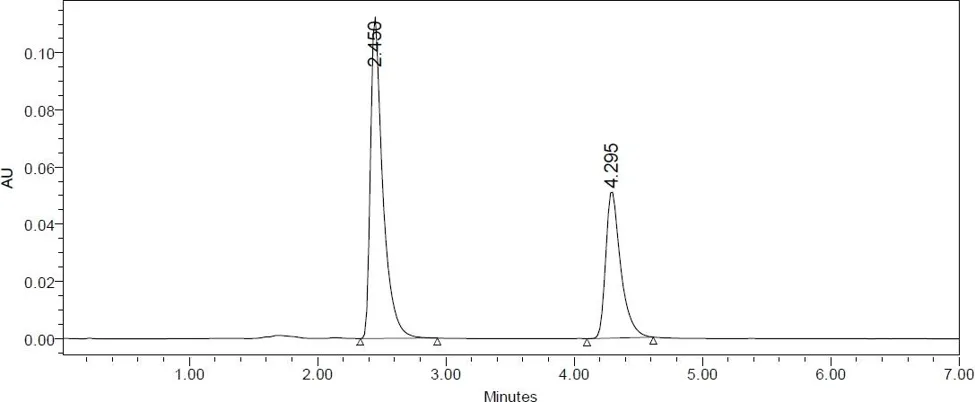
Fig. 8 E:- Chromatogram showing injection – 5
Specificity
The method exhibited excellent specificity, as no interference from excipients, mobile phase components, or other matrix constituents was observed at the retention times of the analytes. Well-resolved and symmetrical peaks were obtained for both drugs in standard and sample chromatograms.
Table no. 3
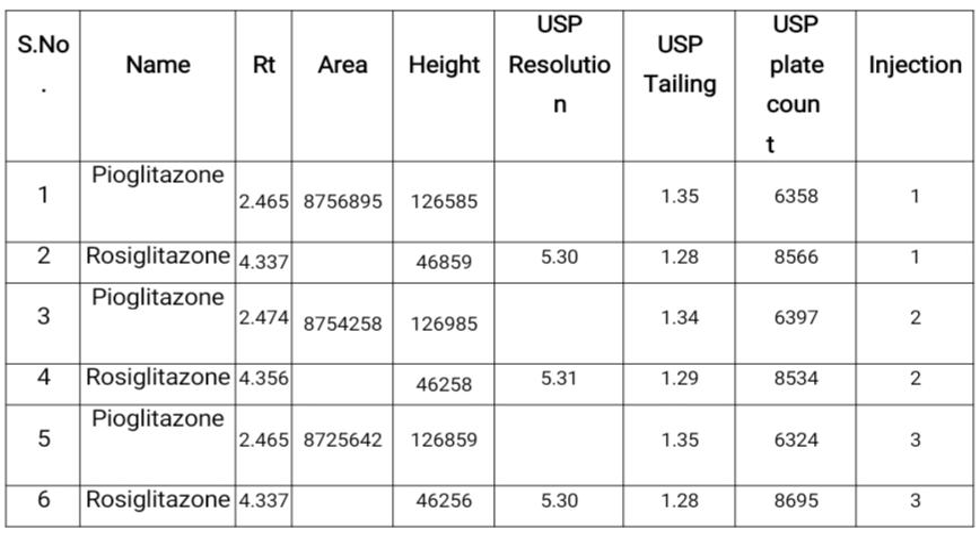
Conclusion :The % purity of Pioglitazone and Rosiglitazone in pharmaceutical dosage form was found to be 99.98%.
Linearity
Linearity was established over the concentration range of 20–100 μg/mL for Pioglitazone and 40–120 μg/mL for Rosiglitazone. Calibration plots of peak area versus concentration showed excellent linearity with correlation coefficients (r²) of 0.999 for both analytes.
Regression equations obtained were:
Pioglitazone: y = 137797x + 160071 (r² = 0.999)
Rosiglitazone: y = 6966.9x + 13995 (r² = 0.999)
Table no.4 Chromatographic data for linearity study
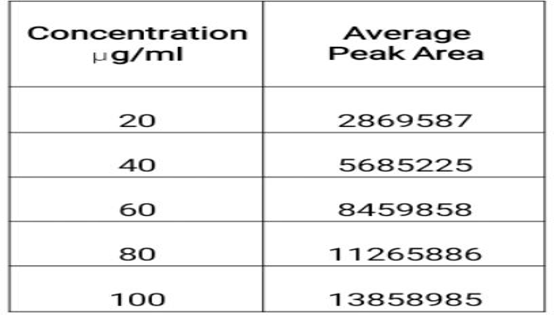
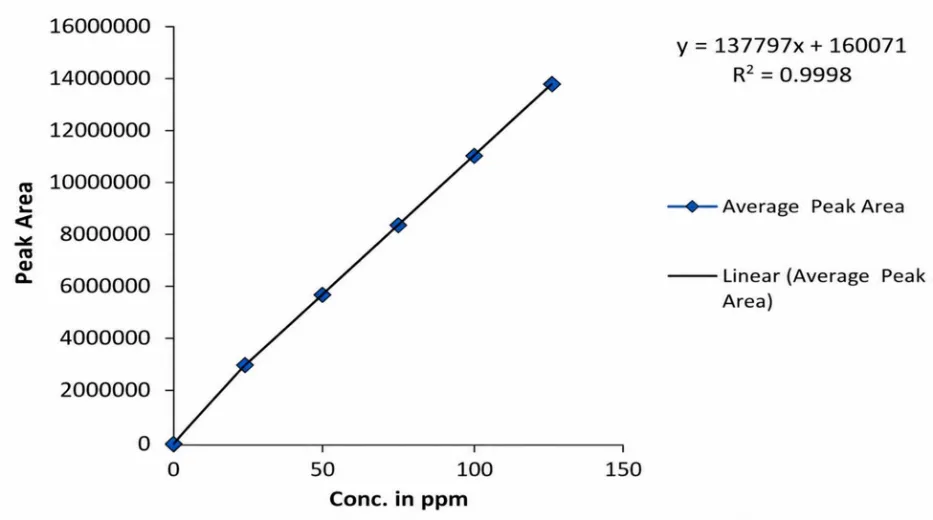
Fig. No.9 Calibration graph for pioglitazone
Conclusion: Correlation Coefficient ® is 0.99, and the intercept is 160071. These values meet the validation criteria.
Rosiglitasone:
Table no.5 Chromatographic data for linearity study
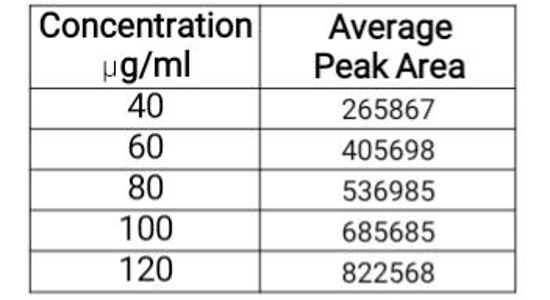
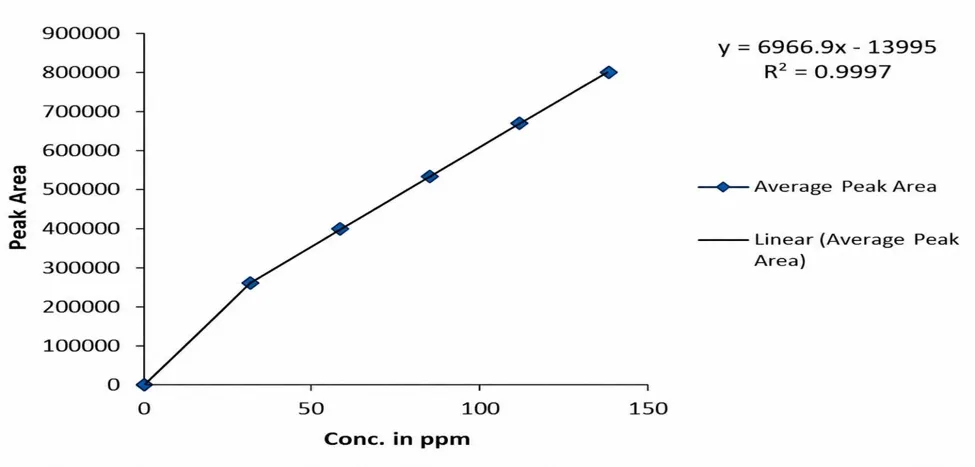
Fig no.10 Calibration graph for Rosiglitazone
Conclusion: Correlation Coefficient is 0.99, and the intercept is 13995. These values meet the validation criteria.
Precision:
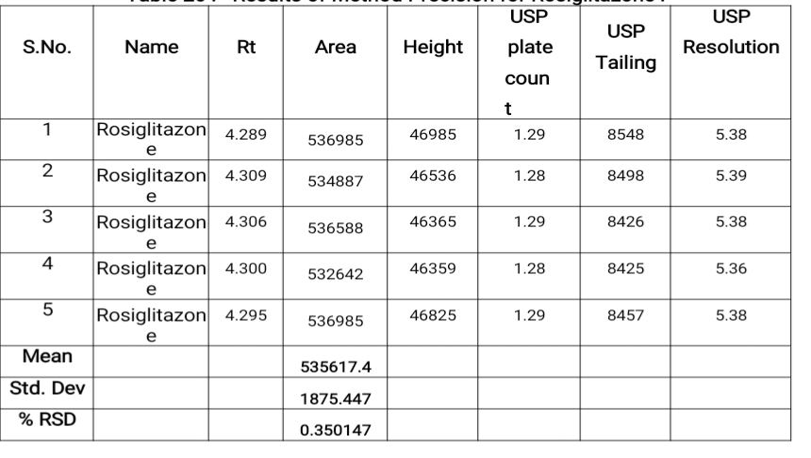
Repeatability studies demonstrated excellent precision with %RSD values of 0.035% for Pioglitazone and 0.350% for Rosiglitazone. Intermediate precision studies conducted on two different days also showed %RSD values below 2%, confirming the reproducibility and ruggedness of the method.
Table no.6 Results of Method Precision for Pioglitazone :
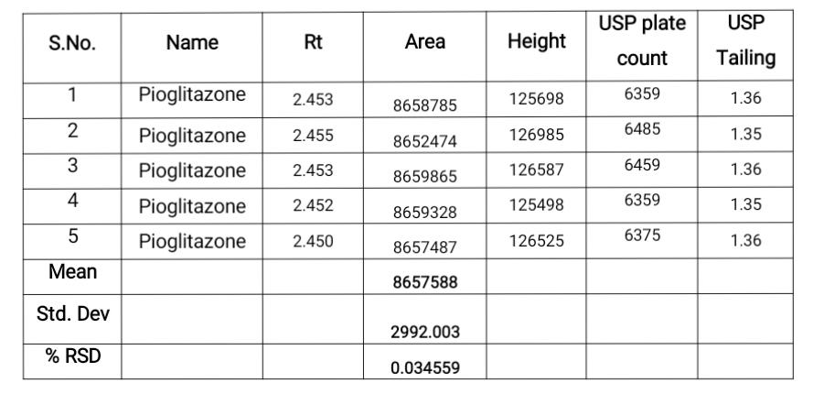
Table no.7 Results of Method Precision for Rosiglitazone
Accuracy
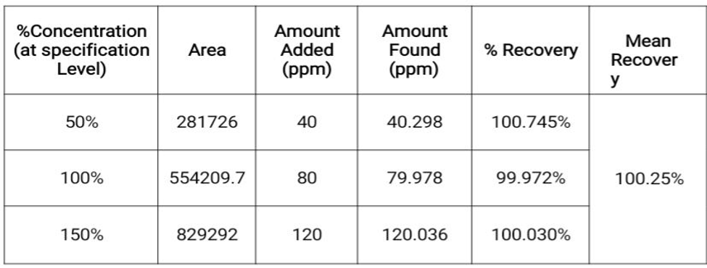
Accuracy was evaluated by recovery studies at 50%, 100%, and 150% concentration levels. The mean percentage recoveries were found to be 100.20% for Pioglitazone and 100.25% for Rosiglitazone. These results indicate that the method is accurate and free from interference by formulation excipients.
Table no 8 :- The accuracy results for Pioglitazone
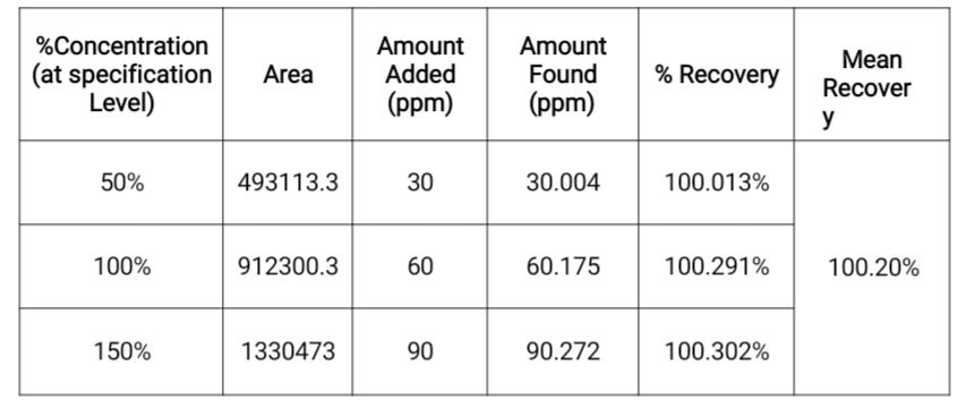
Table no 9 :- The accuracy results for Rosiglitazone
Limit of Detection:
The detection limit of an individual analytical procedure is the lowest amount of analyte in a sample which can be detected but not necessarily quantitated as an exact value.
LOD= 3.3 × σ / s
Where
Σ = Standard deviation of the response, S = Slope of the calibration curve
Result:
Pioglitazone: 0.98µg/ml
Rosiglitazone: 1.27µg/ml
Limit of quantification:
The quantitation limit of an individual analytical procedure is the lowest amount of analyte in a sample which can be quantitatively determined.
LOQ = 10×σ/S
Where
Σ = Standard deviation of the response S = Slope of the calibration curve Result:
Pioglitazone: 2.94µg/ml
Rosiglitazone: 3.81µg/ml
Robustness:
Robustness was evaluated by deliberately varying chromatographic conditions, including flow rate (0.9–1.1 mL/min) and mobile phase composition (±5% organic phase). No significant changes were observed in retention time, resolution, tailing factor, or theoretical plate count. The method remained unaffected by these minor variations, confirming its robustness.
Table no 10:- Results for Robustness Pioglitazone
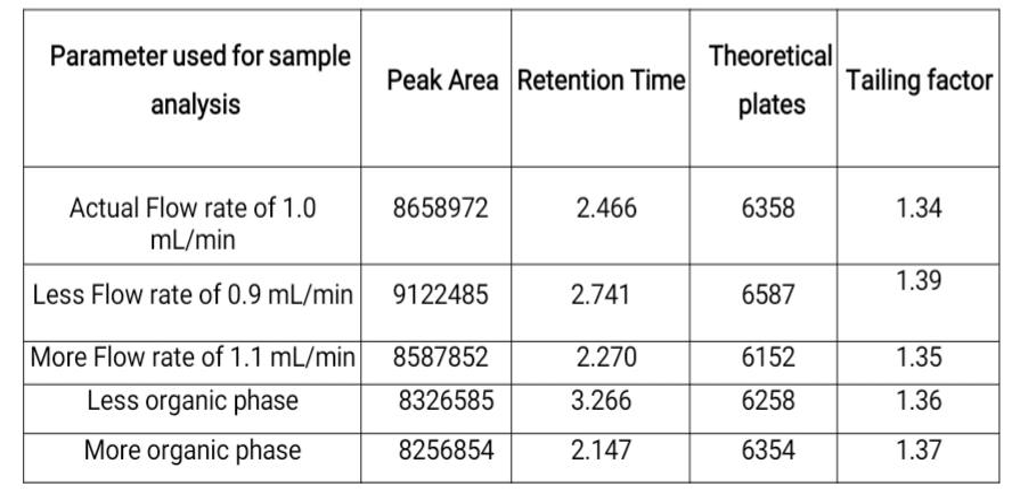
Table no11:- Results for Robustness Rosiglitasone
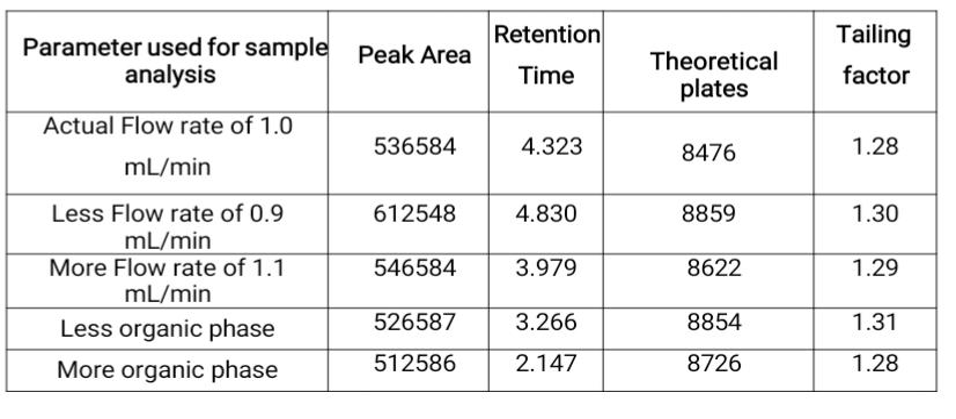
Acceptance Criteria: The trailing factor should be less than 2.0 and the number of theoretical plates (N) should be more than 2000.
CONCLUSION:
A simple, precise, accurate, robust, and sensitive RP-HPLC method was successfully developed and validated for the simultaneous estimation of Pioglitazone and Rosiglitazone. The method complied with ICH validation requirements and demonstrated excellent specificity, linearity, precision, accuracy, and robustness. Therefore, it is suitable for routine quality control analysis of Pioglitazone and Rosiglitazone in pharmaceutical dosage forms.
REFERENCES

Supriya Davkare, Gayatri Maneri, Kodalkar V. N., Waghmode A. B., Dr. Nagaraju Potnuri, Development and Validation for Simultaneous Estimation of Pioiglitazone and Rosiglitazone in Bulk by RP-HPLC Method, Int. J. of Pharm. Sci., 2026, Vol 4, Issue 7, 1569-1586. https://doi.org/10.5281/zenodo.21261014
 10.5281/zenodo.21261014