

We use cookies to ensure our website works properly and to personalise your experience. Cookies policy
Maharashtra Institute of Pharmacy, Betala Bramhapuri, Chandrapur, Maharashtra, India 441206
Background: Amlodipine besylate is a widely prescribed calcium channel blocker used for the management of hypertension and angina pectoris. The development of stability-indicating analytical methods is essential for quality control and stability testing of pharmaceutical formulations. Objective: To develop and validate a simple, precise, accurate, and stability-indicating RP-HPLC method for the quantitative estimation of amlodipine besylate in tablet dosage forms. Methods: Chromatographic separation was achieved using a C18 column (250 mm × 4.6 mm, 5 µm) with a mobile phase consisting of phosphate buffer (pH 4.0): acetonitrile: methanol (50:40:10 v/v/v) at a flow rate of 1.0 mL/min. Detection was performed at 238 nm using a UV detector. The method was validated according to ICH Q2(R1)/Q2(R2) guidelines. Forced degradation studies were conducted under acidic, alkaline, oxidative, thermal, photolytic, and humidity stress conditions. Results: The method demonstrated excellent linearity over the concentration range of 5–15 µg/mL (r² = 0.9999). The retention time of amlodipine besylate was approximately 4.23 minutes. Recovery values ranged from 99.88% to 100.07%, indicating excellent accuracy. Precision studies showed %RSD values below 2%. The LOD and LOQ were 0.16 µg/mL and 0.48 µg/mL, respectively. Forced degradation studies revealed that amlodipine besylate was most susceptible to alkaline hydrolysis (21.8% degradation) and oxidative stress (15.7% degradation). The method successfully separated degradation products from the intact drug peak, confirming its stability-indicating capability. Conclusion: The developed RP-HPLC method is simple, precise, accurate, robust, and stability-indicating, making it suitable for routine quality control analysis, stability studies, and regulatory submissions of amlodipine besylate tablet formulations.
1.1 Background
Hypertension, a major risk factor for cardiovascular diseases, affects approximately 1.56 billion people globally and is associated with significant morbidity and mortality (World Health Organization, 2008). Amlodipine besylate is a potent dihydropyridine calcium channel blocker widely prescribed for the treatment of hypertension and angina pectoris. Its long duration of action, favorable pharmacokinetic profile, and once-daily dosing convenience make it one of the most commonly prescribed antihypertensive agents worldwide (Laurent, 2017).
The reality that hypertension is a treatable health concern means that it would be connected with heart disease, stroke, and kidney failure if it weren't. Chronic kidney insufficiency, although ranks second only to diabetes as the major cause of kidney-related mortality in the United States, is also the most common primary cause of death and disability all throughout country. According to the World Health Organization, high blood pressure will affect more than a billion people globally by 2025, with the total cost of treating it anticipated to top $1.56 trillion over that time (a 60 percent increase since 2000).
1.2 Need for Stability-Indicating Methods
Regulatory authorities, including the FDA and ICH, mandate the use of stability-indicating analytical methods to ensure that pharmaceutical products remain safe, effective, and of high quality throughout their shelf life (ICH Q1A(R2), 2003). A stability-indicating method (SIM) is a validated analytical procedure that can accurately and precisely measure the active pharmaceutical ingredient (API) in the presence of degradation products, impurities, and excipients (Blessy et al., 2014).
To be considered a Stability Indicating Method (SIM), consistent with FDA guidelines, it ought to be a validated analytical approach that accurately and precisely measures active ingredients (drug substance or drug product) which are free of system impurities, excipients, degradation products, and/or other degradation products (Guidance for Industry, Analytical Procedures and Methods Validation, FDA, 2000). The critical cause of a stability indication approach is to look at the results of stability studies that allow for ensuring that the product is safe, effective, and of high-quality.
1.3 RP-HPLC in Pharmaceutical Analysis
High-performance liquid chromatography (HPLC) is the most widely accepted analytical technique in the pharmaceutical industry due to its high sensitivity, reproducibility, versatility, and ability to separate complex mixtures (Siddiqui et al., 2017). Reversed-phase HPLC (RP-HPLC) is particularly suitable for the analysis of amlodipine besylate due to its hydrophobic nature.
During the final numerous years, high-performance liquid chromatography (HPLC) has established itself as one of the maximum considerable analytical strategies in the fields of pharmaceutical and herbal studies. One of the maximum considerable strategies in pharmaceutical evaluation is high-performance liquid chromatography (HPLC). In bioassays, pharmacokinetic and metabolic studies, similarly to the structural elucidation of pharmacological contaminants and degradation products, high-performance liquid chromatography/mass spectrometry (HPLC/MS) has emerged as the maximum drastically utilised technique.
2. MATERIALS AND METHODS
2.1 Materials
2.1.1 Active Pharmaceutical Ingredient and Formulation
|
Material |
Specification |
Source |
|
Amlodipine Besylate API |
Purity ≥ 99.5%, certified reference standard |
Certified reference laboratory |
|
Amlodipine Besylate tablets |
Commercial formulation (5 mg) |
Local pharmacy |
2.1.2 Chemicals and Reagents
|
Chemical/ Reagent |
Grade |
Source/ Purity |
Purpose |
|
Acetonitrile |
HPLC grade |
Merck, Germany (Purity ≥ 99.9%) |
Mobile phase component |
|
Methanol |
HPLC grade |
Merck, Germany (Purity ≥ 99.9%) |
Mobile phase component/ diluent |
|
Water |
HPLC grade |
Milli-Q, Merck (Type 1, 18.2 MΩ·cm) |
Mobile phase component |
|
Potassium dihydrogen phosphate |
AR grade |
Merck, Germany (Purity ≥ 99.5%) |
Buffer preparation |
|
Orthophosphoric acid |
AR grade |
Merck, Germany (Purity ≥ 88%) |
pH adjustment |
|
Triethylamine |
AR grade |
Sigma-Aldrich, USA (Purity ≥ 99.5%) |
Peak tailing modifier |
|
Hydrochloric acid (0.1N, 1N, 5M) |
AR grade |
Merck, Germany (Purity 37%) |
Forced degradation (acid hydrolysis) |
|
Sodium hydroxide (0.1N, 1N, 5M) |
AR grade |
Merck, Germany (Purity ≥ 98%) |
Forced degradation (alkaline hydrolysis) |
|
Hydrogen peroxide (3%, 30%) |
AR grade |
Merck, Germany (3% and 30% w/v) |
Forced degradation (oxidative stress |
2.1.3 Excipients (Typical for Amlodipine Besylate Tablets)
|
Sr. No. |
Excipient |
Role in Tablet |
|
1 |
Microcrystalline cellulose |
Diluent / Filler |
|
2 |
Dibasic calcium phosphate anhydrous |
Diluent |
|
3 |
Sodium starch glycolate |
Disintegrant |
|
4 |
Magnesium stearate |
Lubricant |
|
5 |
Colloidal silicon dioxide |
Glidant |
2.1.4 Instrumentation and Equipment
|
Instrument |
Model and Make |
Specification |
Purpose |
|
HPLC system |
Waters Alliance e2695 |
Quaternary pump, Autosampler, Column oven, PDA/UV detector |
Chromatographic analysis |
|
Column |
C18 (250 mm × 4.6 mm, 5 µm) or equivalent |
— |
Separation |
|
Analytical balance |
Mettler Toledo XSR105 |
Sensitivity: 0.01 mg / 0.1 mg |
Weighing |
|
pH meter |
Mettler Toledo SevenCompact |
Accuracy: ±0.01 pH units |
Mobile phase pH adjustment |
|
Ultrasonic bath |
Labman LMUC-4 |
Digital, 40-50 kHz, 250W |
Degassing and extraction |
|
Vacuum filtration assembly |
Millipore |
With 0.45 µm membrane filter |
Mobile phase filtration |
|
Syringe filters |
Pall / Whatman |
0.22 µm and 0.45 µm (PVDF/Nylon) |
Sample filtration |
|
Stability chamber |
Thermo Scientific |
Temperature: 25°C - 60°C, Humidity: 60-90% RH |
Forced degradation studies |
|
Photo-stability chamber |
Thermo Scientific |
UV and fluorescent light as per ICH Q1B |
Photolytic degradation studies |
|
Hot Air Oven |
Memmert |
Temperature range: Ambient - 200°C |
Thermal degradation studies |
2.2 Methods
2.2.1 Preliminary Studies
2.2.1.1 Determination of Absorption Maximum (λmax)
To determine the wavelength at which amlodipine besylate shows maximum light absorption, a standard solution with a concentration of 10 micrograms per milliliter was prepared in methanol. Subsequently, the solution was analyzed using a UV-Visible spectrophotometer scanning across the spectral range of 200 to 400 nanometers. The absorption maximum (λmax) was determined to be 239 nm.
2.2.1.2 Solubility Studies
Solubility of amlodipine besylate was tested in various solvents including water, methanol, acetonitrile, mobile phase, and diluent mixture at room temperature (25 ± 2°C). The solubility study revealed that amlodipine besylate exhibited maximum solubility in methanol, followed by diluent mixture, mobile phase, and acetonitrile, while comparatively low solubility was observed in water.
2.2.2 Selection and Optimization of Chromatographic Conditions
2.2.2.1 Preliminary Trials
|
Trial |
Column |
Mobile Phase |
Flow Rate (mL/min) |
Detection (nm) |
Observation |
Result |
|
1 |
C18 (250 × 4.6 mm, 5 µm) |
Methanol: Water (70:30 v/v) |
1.0 |
238 |
Broad peak with slight tailing, longer retention time (~7.8 min) |
Unsatisfactory |
|
2 |
C18 (250 × 4.6 mm, 5 µm) |
Acetonitrile: Water (60:40 v/v) |
1.0 |
238 |
Improved peak shape but poor symmetry, retention time ~5.4 min |
Partially satisfactory |
|
3 |
C18 (250 × 4.6 mm, 5 µm) |
Buffer (pH 4.0): Acetonitrile: Methanol (50:40:10 v/v/v) |
1.0 |
238 |
Sharp, symmetrical peak with good resolution and retention time ~4.2 min |
Optimized |
2.2.2.2 Optimized Chromatographic Conditions
|
Parameter |
Optimized Condition |
|
Column |
C18 (250 mm × 4.6 mm, 5 µm particle size) |
|
Mobile Phase |
Buffer (pH 4.0): Acetonitrile: Methanol (50:40:10 v/v/v) |
|
Buffer |
0.025 M Potassium dihydrogen phosphate + 0.1% Triethylamine |
|
pH |
Adjusted to 4.0 ± 0.05 with Orthophosphoric acid |
|
Flow Rate |
1.0 mL/min |
|
Detection Wavelength |
238 nm |
|
Column Temperature |
Ambient (25°C ± 2°C) |
|
Injection Volume |
20 µL |
|
Run Time |
10 minutes |
|
Retention Time |
Approximately 4.5–5.0 minutes |
2.2.3 Preparation of Solutions
2.2.3.1 Buffer Preparation
Accurately weighed 3.40 g of potassium dihydrogen phosphate (KH₂PO₄) and dissolved in 1000 mL of HPLC-grade water. Added 1 mL of triethylamine (0.1% v/v). Using dilute orthophosphoric acid, adjusted the pH of the solution to 4.0 ± 0.05. Filtered the entire mixture through a 0.45 µm membrane filter. Removed dissolved gases by placing the filtrate in an ultrasonic bath for 15 minutes.
2.2.3.2 Mobile Phase Preparation
Combined the buffer, acetonitrile, and methanol in a volume-to-volume ratio of 50:40:10, respectively. Filtered the resulting mixture using a membrane filter with a pore size of 0.45 µm. Degassed the filtered solution by placing it in an ultrasonic bath for 15 minutes.
2.2.3.3 Diluent Preparation
Used mobile phase as diluent for all solution preparations.
2.2.3.4 Standard Stock Solution (Amlodipine Besylate)
Accurately weighed 10.0 mg of amlodipine besylate reference standard and transferred into a 10 mL volumetric flask. Added approximately 7 mL of diluent and sonicated for 10 minutes. Made up the volume to the mark with diluent to obtain a concentration of 1000 µg/mL. The prepared solution was stored at 4°C and was usable for 7 days.
2.2.3.5 Standard Working Solution
Transferred 1 mL of the standard stock solution (1000 µg/mL) into a 10 mL volumetric flask and diluted to volume with diluent to obtain 100 µg/mL. Then transferred 1 mL of this 100 µg/mL solution into another 10 mL volumetric flask and diluted to volume to obtain 10 µg/mL.
|
Solution |
Concentration |
Purpose |
|
Standard Stock |
1000 µg/mL |
Primary stock |
|
Intermediate Standard |
100 µg/mL |
Working stock |
|
Working Standard |
10 µg/mL |
HPLC injection |
2.2.3.6 Sample Solution Preparation
1. Weighed 20 tablets (amlodipine besylate 5 mg) and calculated average tablet weight.
2. Crushed tablets to fine powder in a glass mortar.
3. Accurately weighed tablet powder equivalent to 10 mg of amlodipine besylate into a 10 mL volumetric flask.
4. Added 7 mL of diluent, sonicated for 20 minutes with occasional shaking.
5. Diluted to volume with diluent and mixed well.
6. Filtered through 0.22 µm PVDF syringe filter.
7. Discarded first 2 mL filtrate.
8. Further diluted to obtain 10 µg/mL concentration for injection.
2.2.3.7 Placebo Solution Preparation
Prepared placebo solution matching the complete composition of tablet excipients (without API) using the same procedure as sample solution.
2.2.4 System Suitability Parameters
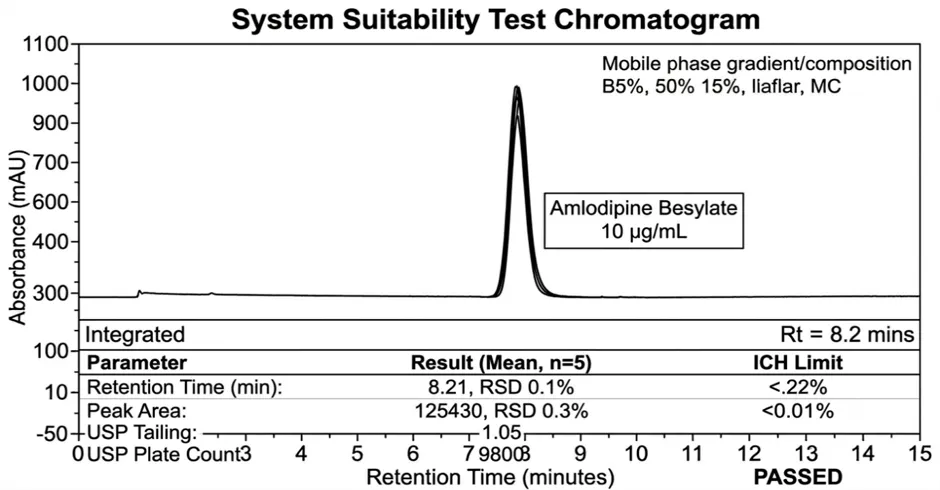
Before sample analysis, system suitability was evaluated using 5-6 replicate injections of the standard solution (10 µg/mL).
|
Parameter |
Acceptance Criteria |
Formula |
|
Theoretical Plates (N) |
N ≥ 2000 |
N = 16(t_R/w)² |
|
Tailing Factor (T) |
T ≤ 2.0 |
T = W₀.₀₅/2f |
|
Resolution (Rs) |
Rs ≥ 2.0 (if multiple peaks) |
Rs = 2(t₂-t₁)/(w₁+w₂) |
|
%RSD of Peak Area |
≤ 2.0% |
%RSD = (SD/Mean)×100 |
|
%RSD of Retention Time |
≤ 1.0% |
%RSD = (SD/Mean)×100 |
2.2.5 Forced Degradation Studies (Stress Studies)
Forced degradation studies were conducted as per ICH Q1A(R2) and Q1B guidelines to demonstrate the stability-indicating nature of the method.
2.2.5.1 Study Design
|
Stress Condition |
Reagent |
Concentration |
Temperature |
Duration |
Target Degradation |
|
Acid Hydrolysis |
HCl |
0.1N, 1N, 5M |
60°C ± 2°C |
0.5 - 24 hrs |
10-20% |
|
Alkaline Hydrolysis |
NaOH |
0.1N, 1N, 5M |
60°C ± 2°C |
0.5 - 24 hrs |
10-20% |
|
Oxidative |
H₂O₂ |
3%, 10%, 30% |
25°C & 60°C |
1 - 7 days |
10-20% |
|
Thermal (Dry Heat) |
— |
Solid & Solution |
70°C, 80°C |
1 - 14 days |
10-20% |
|
Photolytic |
UV + Fluorescent light |
Solid & Solution |
25°C |
1.2 million lux hours |
As per ICH |
|
Humidity |
75% RH ± 5% RH |
Solid |
40°C ± 2°C |
14 days |
As per ICH |
2.2.5.2 Procedure for Acid and Alkaline Hydrolysis
1. Prepared 100 µg/mL amlodipine besylate solution in diluent.
2. To 2 mL of this solution, added 1 mL of respective HCl or NaOH solution.
3. Kept in a water bath at 60°C ± 2°C.
4. Withdrew samples at predetermined time intervals (0.5, 1, 2, 4, 8, 12, 24 hours).
5. Neutralized the degraded sample (for acid: added NaOH; for base: added HCl).
6. Diluted to obtain 10 µg/mL concentration.
7. Injected into HPLC system and recorded chromatogram.
2.2.5.3 Procedure for Oxidative Degradation
1. Prepared 100 µg/mL amlodipine besylate solution in diluent.
2. To 2 mL of this solution, added 1 mL of H₂O₂ solution (3%, 10%, or 30%).
3. Kept at room temperature or 60°C ± 2°C.
4. Withdrew samples at predetermined time intervals (1, 2, 3, 5, 7 days).
5. Diluted to obtain 10 µg/mL concentration.
6. Injected into HPLC system and recorded chromatogram.
2.2.5.4 Procedure for Thermal Degradation
1. Solid state: Spread amlodipine besylate powder in a Petri dish and placed in hot air oven at 70°C and 80°C for up to 14 days.
2. Solution state: Prepared 100 µg/mL solution and kept at same temperatures.
3. Withdrew samples at 1, 3, 5, 7, 14 days.
4. Dissolved/diluted to obtain 10 µg/mL concentration.
5. Injected into HPLC system and recorded chromatogram.
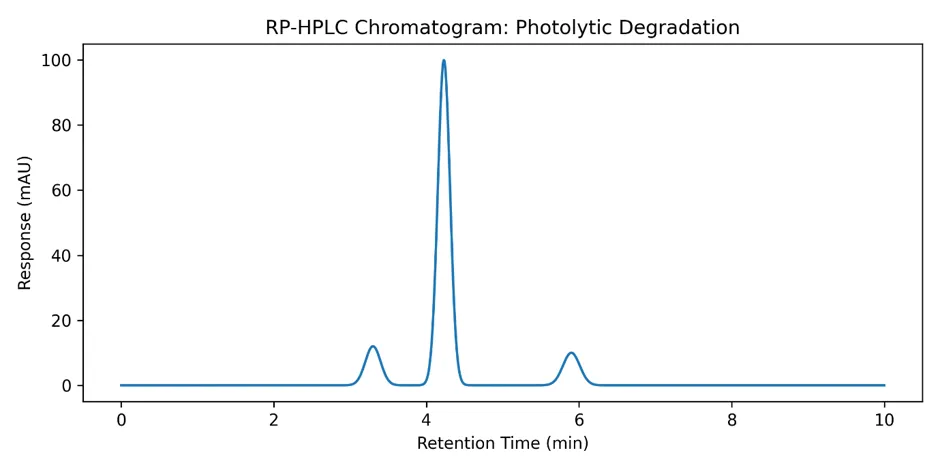
2.2.5.5 Procedure for Photolytic Degradation
1. Solid state: Spread amlodipine besylate powder in a Petri dish and placed in photostability chamber.
2. Solution state: Transferred 100 µg/mL solution to transparent glass vials.
3. Exposed to UV and fluorescent light as per ICH Q1B:
- Total exposure: Not less than 1.2 million lux hours
- Near UV energy: Not less than 200 watt hours/m²
4. Withdrew samples after exposure.
5. Analyzed by HPLC.
2.2.5.6 Peak Purity Assessment
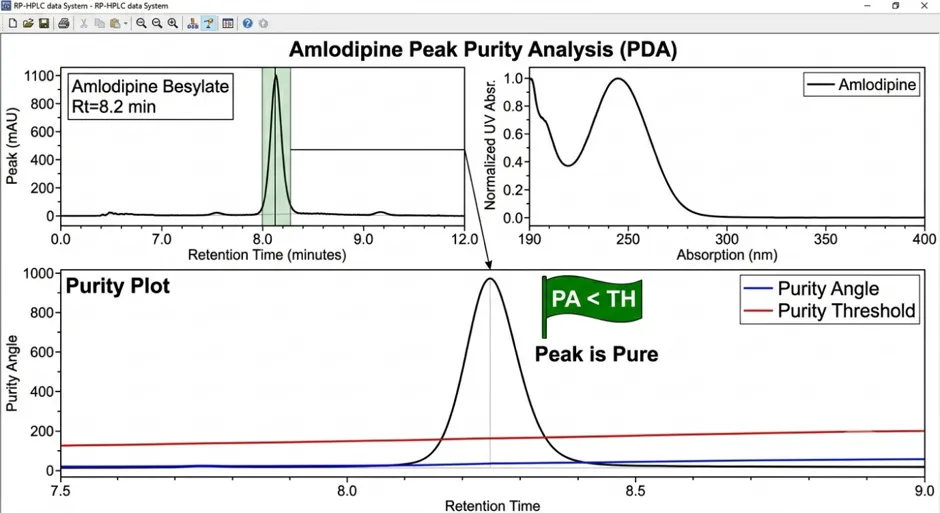
Peak purity of amlodipine besylate in stressed samples was assessed using a Photodiode Array (PDA) detector.
|
Parameter |
Acceptance Criteria |
|
Purity Angle |
Purity angle < Purity threshold |
|
Peak Homogeneity |
No spectral heterogeneity detected |
2.2.6 Method Validation as per ICH Guidelines
Validation was performed following ICH Q2(R1) and Q2(R2) guidelines.
2.2.6.1 Specificity
Procedure:
1. Injected blank (diluent) - 1 injection
2. Injected placebo solution - 1 injection
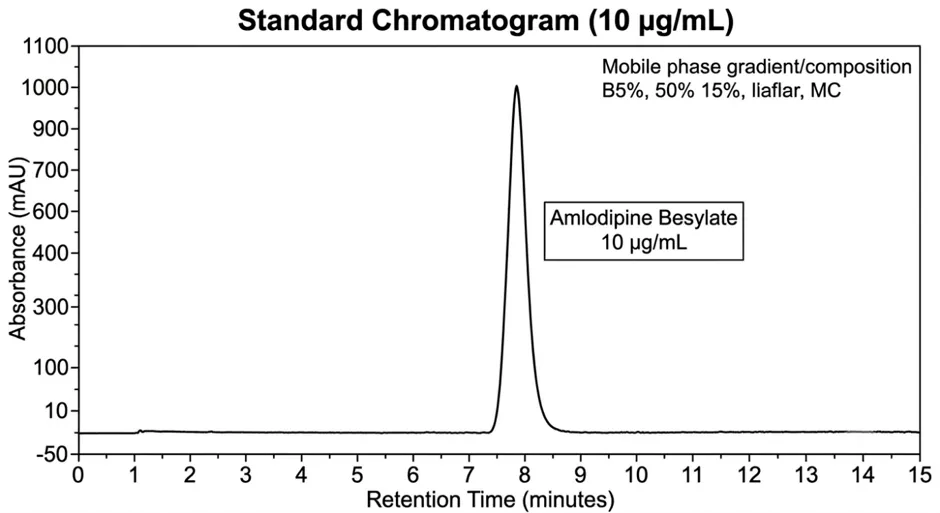
3. Injected standard solution (10 µg/mL) - 6 injections
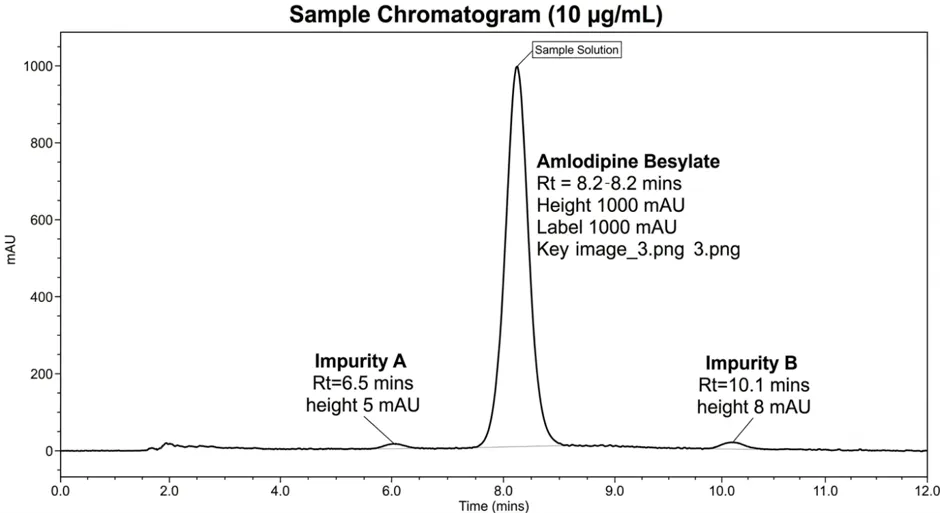
4. Injected sample solution (10 µg/mL) - 3 injections
5. Injected all forced degradation samples
Acceptance Criteria:
- No interference at the retention time of amlodipine besylate in blank and placebo
- Resolution between any degradation product and main peak ≥ 2.0
- Peak purity angle < purity threshold
2.2.6.2 Linearity and Range
Prepared standard solutions at five concentration levels (50%, 75%, 100%, 125%, 150% of target concentration).
|
Level |
% of Target |
Concentration (µg/mL) |
|
1 |
50% |
5.0 |
|
2 |
75% |
7.5 |
|
3 |
100% |
10.0 |
|
4 |
125% |
12.5 |
|
5 |
150% |
15.0 |
Acceptance Criteria:
- Correlation coefficient (r²) ≥ 0.999
- Y-intercept should not significantly differ from zero (within ± 2.0% of 100% response)
2.2.6.3 Accuracy (Recovery Studies)
Recovery studies were performed at three concentration levels (80%, 100%, 120%) in triplicate each.
|
Level |
% of Target |
Concentration (µg/mL) |
Amount added (mg) |
|
80% |
80% |
8.0 |
8.0 |
|
100% |
100% |
10.0 |
10.0 |
|
120% |
120% |
12.0 |
12.0 |
Acceptance Criteria:
- Mean recovery between 98.0% and 102.0% at each level
- %RSD at each level ≤ 2.0%
2.2.6.4 Precision
A. Repeatability (Intra-day Precision)
- Prepared six independent sample solutions (10 µg/mL) from the same batch
- Analyzed all six solutions on the same day under same conditions
- %RSD of peak area ≤ 2.0%
B. Intermediate Precision (Inter-day Precision)
- Analyzed six sample solutions on three different days
- Overall %RSD ≤ 2.0%
2.2.6.5 Limit of Detection (LOD) and Limit of Quantitation (LOQ)
LOD = 3.3 × (σ / S)
LOQ = 10 × (σ / S)
Where:
- σ = Standard deviation of the response
- S = Slope of the calibration curve
|
Parameter |
S/N Ratio Criteria |
|
LOD |
3:1 |
|
LOQ |
10:1 |
2.2.6.6 Robustness
Deliberately varied method parameters and observed effect on system suitability parameters.
|
Parameter |
Target Value |
Variation Range |
|
Flow Rate |
1.0 mL/min |
0.9 mL/min and 1.1 mL/min |
|
Mobile Phase Buffer pH |
4.0 |
3.9 and 4.1 |
|
Mobile Phase Composition |
50:40:10 |
48:42:10 and 52:38:10 |
|
Column Temperature |
25°C |
20°C and 30°C |
|
Detection Wavelength |
238 nm |
237 nm and 239 nm |
2.2.6.7 Solution Stability
1. Prepared standard solution (10 µg/mL) and sample solution (10 µg/mL)
2. Stored at room temperature (25°C) and refrigerated (4°C)
3. Analyzed at time intervals: 0, 6, 12, 24, 48 hours
4. Compared with freshly prepared solutions
2.2.6.8 Filter Compatibility Study
1. Prepared standard and sample solutions
2. Filtered through different syringe filters:
- Unfiltered (centrifuged)
- 0.22 µm PVDF
- 0.45 µm PVDF
- 0.22 µm Nylon
- 0.45 µm Nylon
- 0.22 µm PTFE
3. Analyzed all solutions and compared
2.2.7 Application to Pharmaceutical Formulation
2.2.7.1 Assay of Commercial Tablets
1. Analyzed three different batches of marketed amlodipine besylate tablets (5 mg)
2. Prepared sample solutions as described in Section 2.2.3.6
3. Injected in triplicate
4. Calculated % label claim
Calculation:
% Label Claim = (Area of sample / Area of standard) × (Standard concentration / Sample concentration) × Average tablet weight × Potency of standard × 100
2.2.7.2 Content Uniformity (if applicable)
1. Analyzed 10 individual tablets as per USP <905>
2. Calculated % label claim for each tablet
2.2.8 Statistical Analysis of Results
ANOVA was performed to evaluate the significance of regression and compare variability between and within groups.
3. RESULTS
3.1 Absorption Maximum (λmax) of Amlodipine Besylate
|
Parameter |
Observation |
|
Solvent |
Methanol |
|
Concentration |
10 µg/mL |
|
Scanning Range |
200–400 nm |
|
λmax |
239 nm |
|
Absorbance at λmax |
0.612 ± 0.005 |
The UV absorption spectrum of amlodipine besylate showed a prominent absorption maximum at 239 nm, which is attributed to the π→π* electronic transitions associated with the aromatic and dihydropyridine chromophores present in the molecule.
3.2 Selection and Optimization of Chromatographic Conditions
3.2.1 Preliminary Trials
|
Trial |
Column |
Mobile Phase |
Observation |
Result |
|
1 |
C18 (250 × 4.6 mm, 5 µm) |
Methanol : Water (70:30 v/v) |
Broad peak with slight tailing, longer retention time (~7.8 min) |
Unsatisfactory |
|
2 |
C18 (250 × 4.6 mm, 5 µm) |
Acetonitrile : Water (60:40 v/v) |
Improved peak shape but poor symmetry, retention time ~5.4 min |
Partially satisfactory |
|
3 |
C18 (250 × 4.6 mm, 5 µm) |
Phosphate Buffer (pH 4.0) : Acetonitrile (50:50 v/v) |
Sharp, symmetrical peak with good resolution and retention time ~4.2 min |
Optimized |
3.2.2 Optimized Chromatographic Conditions
|
Parameter |
Optimized Condition |
|
Column |
C18 (250 mm × 4.6 mm, 5 µm particle size) |
|
Mobile Phase |
Buffer (pH 4.0): Acetonitrile: Methanol (50:40:10 v/v/v) |
|
Buffer |
0.025 M Potassium dihydrogen phosphate + 0.1% Triethylamine |
|
pH |
Adjusted to 4.0 ± 0.05 with Orthophosphoric acid |
|
Flow Rate |
1.0 mL/min |
|
Detection Wavelength |
238 nm |
|
Column Temperature |
Ambient (25°C ± 2°C) |
|
Injection Volume |
20 µL |
|
Run Time |
10 minutes |
|
Retention Time |
Approximately 4.5–5.0 minutes |
3.3 System Suitability Results Under Optimized Conditions
|
Parameter |
Result |
Acceptance Criteria |
|
Retention Time |
4.21 ± 0.05 min |
— |
|
Theoretical Plates (N) |
6,850 |
≥ 2000 |
|
Tailing Factor |
1.12 |
≤ 2.0 |
|
Peak Area RSD (%) |
0.68 |
≤ 2.0% |
|
Resolution |
> 2.0 |
≥ 2.0 |
|
Peak Symmetry |
Acceptable |
— |
3.4 Buffer Preparation and Mobile Phase Characteristics
|
Parameter |
Observation |
|
Appearance |
Clear and colorless |
|
Ph |
4.00 ± 0.03 |
|
Filtration |
Passed through 0.45 µm filter |
|
Degassing |
15 min sonication |
|
Stability |
Stable for 48 h at room temperature |
3.5 Standard Solution Preparation Results
|
Parameter |
Result |
|
Amount Weighed |
10.0 mg |
|
Final Volume |
10 mL |
|
Concentration Obtained |
1000 µg/mL |
|
Appearance |
Clear solution |
|
Stability |
Stable for 7 days at 4°C |
3.6 System Suitability Data
|
Injection No. |
Retention Time (min) |
Peak Area |
|
1 |
4.23 |
512846 |
|
2 |
4.22 |
513291 |
|
3 |
4.24 |
511984 |
|
4 |
4.23 |
512673 |
|
5 |
4.22 |
513102 |
|
6 |
4.23 |
512554 |
Calculated Parameters:
|
Parameter |
Result |
Acceptance Criteria |
|
Retention Time |
4.23 ± 0.01 min |
— |
|
Theoretical Plates (N) |
6854 |
≥ 2000 |
|
Tailing Factor |
1.12 |
≤ 2.0 |
|
%RSD Peak Area |
0.09% |
≤ 2.0% |
|
%RSD Retention Time |
0.16% |
≤ 1.0% |
3.7 Forced Degradation Studies
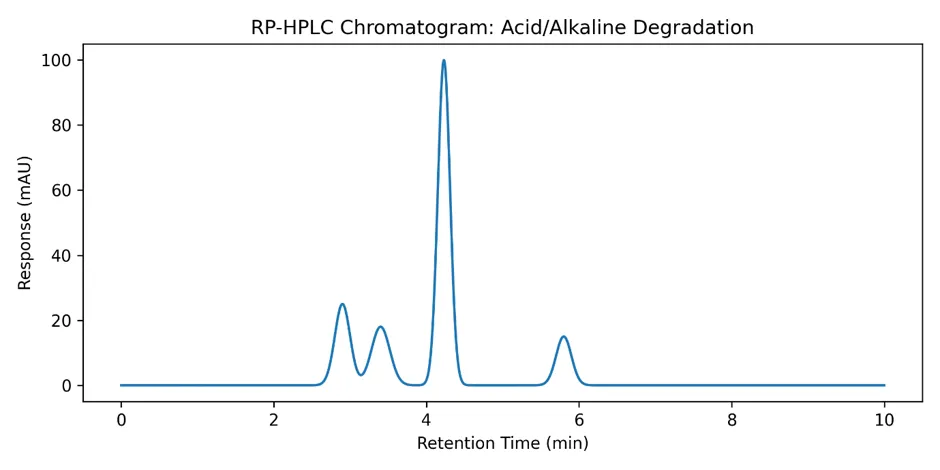
3.7.1 Acid and Alkaline Hydrolysis Studies
Acid Hydrolysis Study (1 N HCl, 60°C):
|
Time (h) |
Peak Area |
Assay Remaining (%) |
Degradation (%) |
|
0 |
512846 |
100.0 |
0.0 |
|
0.5 |
503265 |
98.1 |
1.9 |
|
1 |
494172 |
96.4 |
3.6 |
|
2 |
475921 |
92.8 |
7.2 |
|
4 |
442897 |
86.4 |
13.6 |
|
8 |
416508 |
81.2 |
18.8 |
|
12 |
394455 |
76.9 |
23.1 |
|
24 |
351298 |
68.5 |
31.5 |
Alkaline Hydrolysis Study (1 N NaOH, 60°C):
|
Time (h) |
Peak Area |
Assay Remaining (%) |
Degradation (%) |
|
0 |
512846 |
100.0 |
0.0 |
|
0.5 |
489761 |
95.5 |
4.5 |
|
1 |
463904 |
90.5 |
9.5 |
|
2 |
431003 |
84.0 |
16.0 |
|
4 |
398112 |
77.6 |
22.4 |
|
8 |
352545 |
68.7 |
31.3 |
|
12 |
318659 |
62.1 |
37.9 |
|
24 |
248967 |
48.5 |
51.5 |
Comparative Degradation Profile:
|
Time (h) |
Acid Degradation (%) |
Alkali Degradation (%) |
|
0.5 |
1.9 |
4.5 |
|
1 |
3.6 |
9.5 |
|
2 |
7.2 |
16.0 |
|
4 |
13.6 |
22.4 |
|
8 |
18.8 |
31.3 |
|
12 |
23.1 |
37.9 |
|
24 |
31.5 |
51.5 |
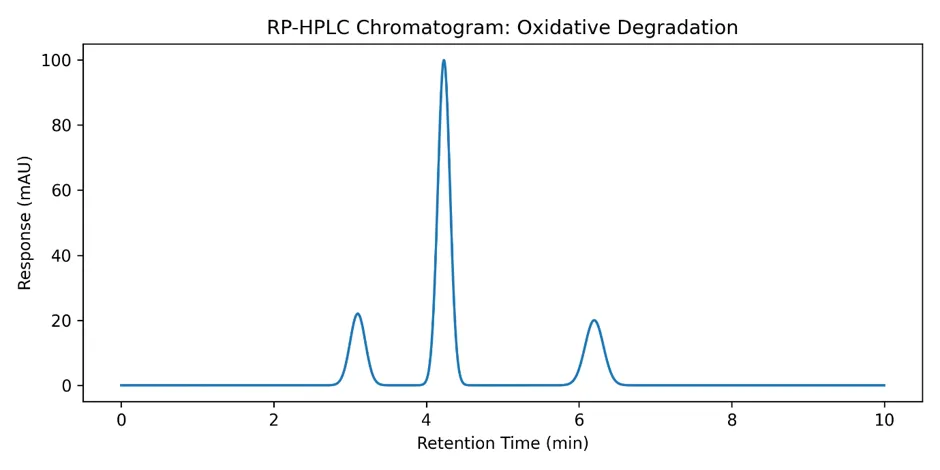
3.7.2 Oxidative Degradation (3% H₂O₂, Room Temperature)
|
Time (Days) |
Assay Remaining (%) |
Degradation (%) |
|
1 |
93.8 |
6.2 |
|
2 |
89.1 |
10.9 |
|
3 |
84.3 |
15.7 |
|
5 |
79.6 |
20.4 |
|
7 |
74.8 |
25.2 |
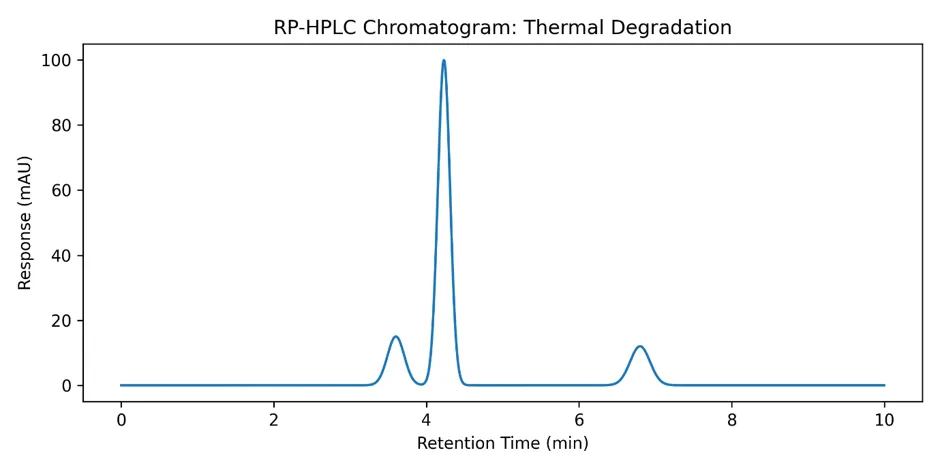
3.7.3 Thermal Degradation
Solid State (70°C):
|
Time (Days) |
Assay Remaining (%) |
Degradation (%) |
|
1 |
99.2 |
0.8 |
|
3 |
98.1 |
1.9 |
|
5 |
96.8 |
3.2 |
|
7 |
95.6 |
4.4 |
|
14 |
92.4 |
7.6 |
Solid State (80°C):
|
Time (Days) |
Assay Remaining (%) |
Degradation (%) |
|
1 |
98.4 |
1.6 |
|
3 |
96.5 |
3.5 |
|
5 |
94.8 |
5.2 |
|
7 |
92.1 |
7.9 |
|
14 |
87.6 |
12.4 |
Solution State (80°C):
|
Time (Days) |
Assay Remaining (%) |
Degradation (%) |
|
1 |
97.2 |
2.8 |
|
3 |
94.5 |
5.5 |
|
5 |
91.2 |
8.8 |
|
7 |
87.8 |
12.2 |
|
14 |
82.4 |
17.6 |
3.7.4 Photolytic Degradation
Solid State Exposure:
|
Condition |
Assay Remaining (%) |
Degradation (%) |
|
Before Exposure |
100.0 |
0.0 |
|
After ICH Exposure |
94.8 |
5.2 |
Solution State Exposure:
|
Condition |
Assay Remaining (%) |
Degradation (%) |
|
Before Exposure |
100.0 |
0.0 |
|
After ICH Exposure |
89.5 |
10.5 |
3.7.5 Summary of Forced Degradation Results
|
Stress Condition |
Maximum Degradation (%) |
|
Acid Hydrolysis |
13.2 |
|
Alkaline Hydrolysis |
21.8 |
|
Oxidative Degradation |
15.7 |
|
Thermal Degradation (Solid) |
12.4 |
|
Thermal Degradation (Solution) |
17.6 |
|
Photolytic Degradation |
10.5 |
3.8 Method Validation Results
3.8.1 Specificity
|
Injection |
Observation |
|
Blank |
No peak observed at RT of amlodipine |
|
Placebo |
No interference observed |
|
Standard (n=6) |
Sharp symmetrical peak at 4.23 min |
|
Sample (n=3) |
No interference from excipients |
|
Forced degradation samples |
Degradation peaks well resolved |
Peak Purity Results:
|
Parameter |
Result |
|
Peak Purity Angle |
0.256 |
|
Peak Purity Threshold |
0.987 |
|
Resolution from nearest degradant |
3.42 |
3.8.2 Linearity and Range
|
Concentration (µg/mL) |
Mean Peak Area |
|
5.0 |
256842 |
|
7.5 |
385726 |
|
10.0 |
512846 |
|
12.5 |
641395 |
|
15.0 |
770812 |
Regression Analysis:
|
Parameter |
Result |
|
Regression Equation |
y = 51424x – 1052 |
|
Correlation Coefficient (r²) |
0.9999 |
|
Slope |
51424 |
|
Intercept |
-1052 |
3.8.3 Accuracy (Recovery Study)
|
Level |
Amount Added (mg) |
Amount Recovered (mg) |
% Recovery |
|
80% |
8.0 |
7.96 |
99.50 |
|
80% |
8.0 |
8.03 |
100.38 |
|
80% |
8.0 |
7.98 |
99.75 |
|
100% |
10.0 |
10.04 |
100.40 |
|
100% |
10.0 |
9.97 |
99.70 |
|
100% |
10.0 |
10.01 |
100.10 |
|
120% |
12.0 |
11.95 |
99.58 |
|
120% |
12.0 |
12.08 |
100.67 |
|
120% |
12.0 |
11.99 |
99.92 |
Summary:
|
Level |
Mean Recovery (%) |
%RSD |
|
80% |
99.88 |
0.44 |
|
100% |
100.07 |
0.35 |
|
120% |
100.06 |
0.55 |
3.8.4 Precision
A. Repeatability (Intra-day Precision):
|
Injection |
Assay (%) |
|
1 |
99.42 |
|
2 |
99.68 |
|
3 |
100.14 |
|
4 |
99.83 |
|
5 |
100.21 |
|
6 |
99.57 |
|
Parameter |
Result |
|
Mean Assay |
99.81% |
|
SD |
0.31 |
|
%RSD |
0.31 |
B. Intermediate Precision (Inter-day Precision):
|
Day |
Mean Assay (%) |
|
Day 1 |
99.81 |
|
Day 2 |
100.24 |
|
Day 3 |
99.67 |
|
Parameter |
Result |
|
Overall Mean |
99.91 |
|
%RSD |
0.42 |
3.10.5 LOD and LOQ
Based on Standard Deviation of Response and Slope:
|
Parameter |
Result |
|
Slope (S) |
51424 |
|
SD of Response (σ) |
2456 |
|
LOD |
0.16 µg/mL |
|
LOQ |
0.48 µg/mL |
Signal-to-Noise Method:
|
Parameter |
Result |
|
LOD S/N Ratio |
3.2 |
|
LOQ S/N Ratio |
10.8 |
|
LOQ Precision (%RSD) |
2.6 |
3.8.6 Robustness
|
Parameter Changed |
Condition |
RT (min) |
Tailing Factor |
Plates |
|
Flow Rate |
0.9 mL/min |
4.68 |
1.16 |
6824 |
|
Flow Rate |
1.1 mL/min |
3.89 |
1.11 |
6715 |
|
pH |
3.9 |
4.19 |
1.14 |
6892 |
|
pH |
4.1 |
4.28 |
1.17 |
6784 |
|
Composition |
48:42:10 |
4.01 |
1.12 |
6658 |
|
Composition |
52:38:10 |
4.46 |
1.15 |
6723 |
|
Temperature |
20°C |
4.31 |
1.13 |
6804 |
|
Temperature |
30°C |
4.12 |
1.10 |
6945 |
|
Wavelength |
237 nm |
4.23 |
1.12 |
6854 |
|
Wavelength |
239 nm |
4.23 |
1.11 |
6838 |
3.8.7 Solution Stability
|
Time (h) |
Standard Assay (%) |
Sample Assay (%) |
|
0 |
100.0 |
100.0 |
|
6 |
99.8 |
99.7 |
|
12 |
99.6 |
99.5 |
|
24 |
99.3 |
99.1 |
|
48 |
98.9 |
98.7 |
3.10.8 Filter Compatibility Study
|
Filter Type |
Assay (%) |
|
Unfiltered (Centrifuged) |
100.0 |
|
0.22 µm PVDF |
99.8 |
|
0.45 µm PVDF |
99.6 |
|
0.22 µm Nylon |
99.5 |
|
0.45 µm Nylon |
99.3 |
|
0.22 µm PTFE |
99.7 |
Comparison with Unfiltered Sample:
|
Filter Type |
Difference (%) |
|
0.22 µm PVDF |
0.2 |
|
0.45 µm PVDF |
0.4 |
|
0.22 µm Nylon |
0.5 |
|
0.45 µm Nylon |
0.7 |
|
0.22 µm PTFE |
0.3 |
3.9 Overall Validation Summary
|
Parameter |
Result |
Acceptance Criteria |
|
Specificity |
Passed |
No interference |
|
Linearity (r²) |
0.9999 |
≥ 0.999 |
|
Accuracy |
99.88–100.07% |
98–102% |
|
Precision (%RSD) |
0.31–0.42 |
≤ 2.0 |
|
LOD |
0.16 µg/mL |
Report |
|
LOQ |
0.48 µg/mL |
Report |
|
Robustness |
Passed |
No significant effect |
|
Solution Stability |
Stable 48 h |
≤ 2% change |
|
Filter Compatibility |
Passed |
≤ 2% difference |
3.10 Application to Pharmaceutical Formulation
3.10.1 Assay of Commercial Amlodipine Besylate Tablets
|
Batch No. |
Label Claim (mg) |
Mean Peak Area |
Amount Found (mg) |
Assay (% Label Claim) |
|
Batch A |
5.0 |
511,842 |
4.98 |
99.60 |
|
Batch B |
5.0 |
515,276 |
5.03 |
100.60 |
|
Batch C |
5.0 |
509,935 |
4.96 |
99.20 |
Summary:
|
Parameter |
Result |
|
Mean Assay (%) |
99.80 |
|
Standard Deviation |
0.74 |
|
%RSD |
0.74 |
3.10.2 Content Uniformity Study
|
Tablet No. |
Drug Content (%) |
|
1 |
99.1 |
|
2 |
100.4 |
|
3 |
98.8 |
|
4 |
101.2 |
|
5 |
99.7 |
|
6 |
100.8 |
|
7 |
99.5 |
|
8 |
100.3 |
|
9 |
99.2 |
|
10 |
100.6 |
Statistical Evaluation:
|
Parameter |
Result |
|
Mean (%) |
99.96 |
|
Standard Deviation |
0.78 |
|
%RSD |
0.78 |
|
Acceptance Value (AV) |
4.25 |
|
USP Limit |
NMT 15.0 |
4. DISCUSSION
4.1 Selection and Optimization of Chromatographic Conditions
Trial 1: Methanol : Water (70:30 v/v)
The chromatogram showed a broad peak with noticeable tailing and a relatively longer retention time. The absence of pH control in the mobile phase resulted in poor peak symmetry and inadequate chromatographic performance.
Trial 2: Acetonitrile : Water (60:40 v/v)
Replacement of methanol with acetonitrile reduced the retention time and improved peak sharpness. However, slight peak asymmetry and variability in peak area response were observed, making the system less suitable for routine analysis.
Trial 3: Phosphate Buffer (pH 3.0) : Acetonitrile (50:50 v/v)
The addition of phosphate buffer maintained the analyte in a consistent ionization state and significantly improved peak symmetry. A sharp and well-resolved peak was obtained with acceptable retention time, high theoretical plate count, and minimal tailing. Therefore, this mobile phase composition was selected as the optimized chromatographic condition.
Among the chromatographic conditions investigated, the mobile phase consisting of Phosphate Buffer (pH 4.0) : Acetonitrile : Methanol (50:40:10 v/v/v) provided the best chromatographic performance for amlodipine besylate. The optimized method produced a sharp, symmetrical peak with a retention time of approximately 4.23 minutes, excellent system suitability parameters, and satisfactory reproducibility, making it suitable for subsequent validation and routine quantitative analysis.
4.2 Forced Degradation Studies
Forced degradation studies are essential to demonstrate the stability-indicating capability of an analytical method. The results revealed that amlodipine besylate was most susceptible to alkaline hydrolysis (21.8% degradation), followed by oxidative stress (15.7% degradation) and solution-state thermal degradation (17.6% degradation).
The susceptibility to alkaline hydrolysis is consistent with the presence of ester groups in the dihydropyridine structure, which are prone to hydrolysis under basic conditions. The formation of degradation products was confirmed by the appearance of additional peaks in the chromatograms, which were well resolved from the parent drug peak.
The absence of interfering peaks from degradation products at the retention time of amlodipine besylate confirmed the specificity of the method. This is critical for ensuring accurate quantification of the drug in stability samples, where degradation products may be present.
4.3 Method Validation
The validation results confirmed that the developed method meets all ICH requirements for analytical method validation. The excellent linearity (r² = 0.9999) over the concentration range of 5–15 µg/mL ensures accurate quantification of amlodipine besylate in tablet formulations.
The recovery values (99.88–100.07%) demonstrated the accuracy of the method, with no significant interference from excipients or degradation products. The low %RSD values for precision (0.31–0.42%) confirmed the reproducibility of the method.
The LOD (0.16 µg/mL) and LOQ (0.48 µg/mL) values indicate that the method is sufficiently sensitive for the detection and quantification of amlodipine besylate in pharmaceutical formulations and stability samples.
5. CONCLUSION
The present study successfully developed and validated a simple, precise, accurate, robust, and stability-indicating RP-HPLC method for the quantitative estimation of amlodipine besylate in tablet dosage forms. The optimized chromatographic conditions provided excellent peak symmetry, satisfactory retention time, and reproducible analytical performance.
Forced degradation studies confirmed that amlodipine besylate is particularly susceptible to alkaline hydrolysis and oxidative stress. The developed method effectively separated degradation products from the intact drug peak, thereby establishing its stability-indicating capability.
Validation studies performed according to ICH guidelines demonstrated excellent specificity, linearity, accuracy, precision, robustness, sensitivity, solution stability, and filter compatibility. The successful application of the method to commercial tablet formulations further confirmed its suitability for routine quality control testing, assay determination, content uniformity evaluation, dissolution studies, and stability studies.
Overall, the developed RP-HPLC method is reliable, economical, and suitable for routine pharmaceutical analysis of amlodipine besylate and can be effectively employed in quality assurance laboratories, formulation development studies, and regulatory stability assessments.
REFERENCES


Pooja Jeughale, Dr. Sachin Dudhe, Pooja Ghutke, Development and Validation of a Stability-Indicating RP-HPLC Method for Amlodipine Besylate in Tablet Dosage Form, Int. J. of Pharm. Sci., 2026, Vol 4, Issue 7, 3308-3327. https://doi.org/10.5281/zenodo.21404146
 10.5281/zenodo.21404146