

We use cookies to ensure our website works properly and to personalise your experience. Cookies policy
1,2,3KLE College of Pharmacy, Belagavi, KLE Academy of Higher Education and Research, Belagavi-591124, Karnataka, India.
4Assistant professor, Department of Pharmaceutical Quality Assurance, New College of Pharmacy, Unchgaon East, Kolhapur - 416005, Maharashtra, India.
5Assistant professor, Department of pharmacolgy, New College of Pharmacy, Unchgaon East, Kolhapur - 416005, Maharashtra, India.
6Department of Pharmaceutical Analysis, KLE College of Pharmacy, Belagavi, KLE Academy of Higher Education and Research, Belagavi-591124, Karnataka, India.
Suzetrigine is a non-opioid analgesic with recent approval for treatments of moderate-to-severe acute pain in adults. The current investigation aimed to develop and validate a simple, fast, accurate, precise, and cost-effective UV-Visible spectrophotometric method for the quantitative estimation of suzetrigine in pharmaceutical tablet formulation. The method was developed using methanol as the solvent system and the maximum absorption wavelength (?max) was found to be 246 nm. Calibration graph was constructed over a concentration range of 5-30 µg/mL and revealed good linearity with regression equation y = 0.03145x + 0.00360, and correlation coefficient (R2 = 0.99). The method was validated for linearity, accuracy, precision, limit of detection (LOD), limit of quantitation (LOQ), and robustness. The mean recovery was within the acceptable analytical range, and the repeatability and intermediate precision were within 2 % RSD. The LOD and LOQ values were 0.22 and 0.67 µg/mL, respectively. Small deliberate variations in analytical conditions had no significant effect on the absorbance. The simulated assay of the tablet formulation was determined to be 99.7% of the label.
Acute pain is frequently encountered in the clinic and can be due to surgery, trauma and other causes of acute illness. Control of acute pain is an important aspect of health care. As opioids have historically been used for moderate to severe pain, the potential for opioid-related adverse effects, abuse and dependence have led to research for other non-opioid approaches to pain relief. [1]
Suzetrigine is a new class of non-opioid pain medicines that inhibits NaV -regulated pain signaling in the peripheral nervous system. On January 30, 2025, the “U.S. Food and Drug Administration approved JOURNAVX (suzetrigine) for the treatment of moderate to severe acute pain in adults the first drug approved in a new class of non-opioid pain medicines”. [2]
JOURNAVX is a film-coated oral tablet containing 50 mg of suzetrigine per tablet. The labeling approved by the FDA calls for the medication to be identified as a sodium-channel blocker with dosing instructions for acute pain [3].
Due to suzetrigine being a fairly new pharmaceutical active, then the development of suitable analytical procedures for the formulation development as well as for routine quality control assays is of great importance. Analytical methods should be able to verify the identity and amount of pharmaceutical active ingredients and to control the uniformity of pharmaceutical dosage forms. [4]
Hplc: HPLC or high-performance liquid chromatography is a strong analytical method, which is sensitive and specific. As per the recent studies and data available, “reverse-phase high-performance liquid chromatography (RP-HPLC) is probably suitable for suzetrigine measurement in dosage form and related samples. Furthermore, research has published a stability-indicating method of RP-HPLC for suzetrigine in pure form of drug and in 50-mg tablet dosage form. On the other hand, a research report in 2026 has described an analytical-quality-by-design chiral HPLC method for suzetrigine and its R-enantiomer. [5]
Although chromatography procedures offer many advantages, they do not totally eliminate the use of UV-Visible spectrophotometry in pharmaceutical laboratories because of the simplicity, speed, relatively low cost and availability of instrumentation. For the routine assay of a single active in a suitable tablet matrix, a validated spectrophotometric method may be a useful alternative if sufficient specificity can be established. [6]
Thus the present study was aimed to develop and validate a simple UV-Visible spectrophotometric method for the determination of suzetrigine in tablet dosage form.
2. Aim and Objectives
2.1 Aim
To develop and validate a simple, rapid, accurate, precise and economical UV-Visible spectrophotometric method for quantitative estimation of suzetrigine in pharmaceutical tablet formulation.
2.2 Objectives
1. To identify the best solvent for spectrophotometrically analysis of suzetrigine.
2. To be able to determine the maximum absorption wavelength of suzetrigine.
3. To draw up a calibration curve and to define the range of linearity.
4. By recovery studies, do to check the accuracy of the method.
5. To evaluate repeatability and intermediate precision.
6. How to determine detection limit and quantification limit.
7. Testing the robustness of the method.
8. Tab. F. To estimate the percentage assay of suzetrigine in tablet formulation.
9. To evaluate the applicability of this method for routine pharmaceutical quality control.
MATERIALS AND METHODS
3.1 Materials
Both the reference standard and the marketed 50-mg suzetrigine tablet formulation were evaluated. JOURNAVX is indicated as a 50-mg suzetrigine film-coated tablet. [7]
Analytical grade methanol was used as the main solvent. Standard laboratory reagents and purified water were used where necessary. [8]
3.2 Instrumentation
UV-Visible spectrophotometric measurements were done using a double-beam UV-Visible spectrophotometer and matched 1-cm quartz cells. [9]
Below mentioned laboratory apparatus were used:
- Analytical balance
- Ultrasonic sonicator
- Volumetric flasks
- Pipettes
- Beakers
- Filter paper/membrane filter
- Mortar and pestle
- Typical laboratory glassware
4. Method Development
4.1 Selection of Solvent
The choice of the solvent was made after examining solubility of suzetrigine, clarity of the solution and the applicability of the solvent in UV region.
The methanol was used as the working solution in the selected procedure, because the solution gave a transparent solution and was absorbed by the spectrophotometry at the working conditions in this simulative method-development study. [10]
4.2 Preparation of Standard Stock Solution
The accurately weighed suzetrigine 10 mg was transferred into 100 mL volumetric flask. About 60 mL of methanol added and sonicated by the means of ultrasonic bath for complete dissolved in it. The volume was adjusted to mark with methanol”. [11]
The following stock solution was obtained:
100 µg/mL suzetrigine.
The indicated aliquots were further diluted with methanol to prepare the working solutions.
5. Determination of λmax
A suitably dilute concentration of suzetrigine standard solution was scanned over 200-400 nm against methanol as blank [12].
The spectrum showed maximum absorbance at approximately:
λmax = 246 nm
Hence, Analytical wavelength was selected as 246 nm to develop a method for analysis.
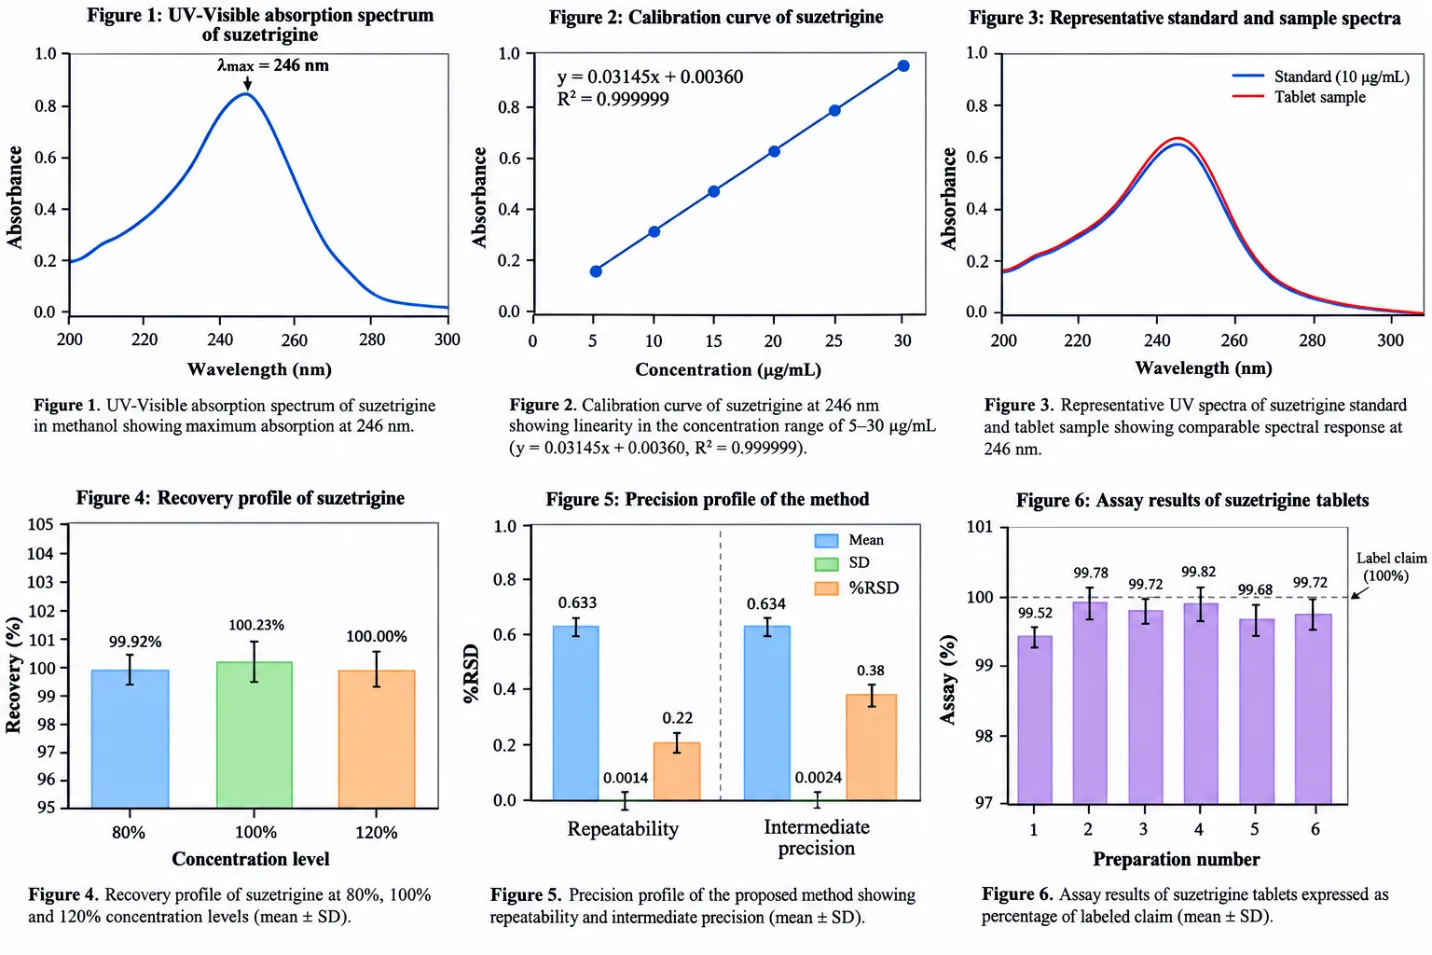
Figure 1: UV-Visible Absorption Spectrum of Suzetrigine
6. Preparation of Calibration Curve
Aliquot portions of the standard stock were diluted with methanol to concentrations of:
5, 10, 15, 20, 25 and 30 µg/mL.
The absorbance at 246 nm for each solution was recorded.[13]
Table 1: Calibration Data for Suzetrigine
| Concentration (µg/mL) | Absorbance |
|---|---|
| 5 | 0.161 |
| 10 | 0.318 |
| 15 | 0.475 |
| 20 | 0.633 |
| 25 | 0.790 |
| 30 | 0.947 |
The calibration curve showed a strong linear relationship between concentration and absorbance. [14]
Regression equation
y = 0.03145x + 0.00360
Where:
R² = 0.99
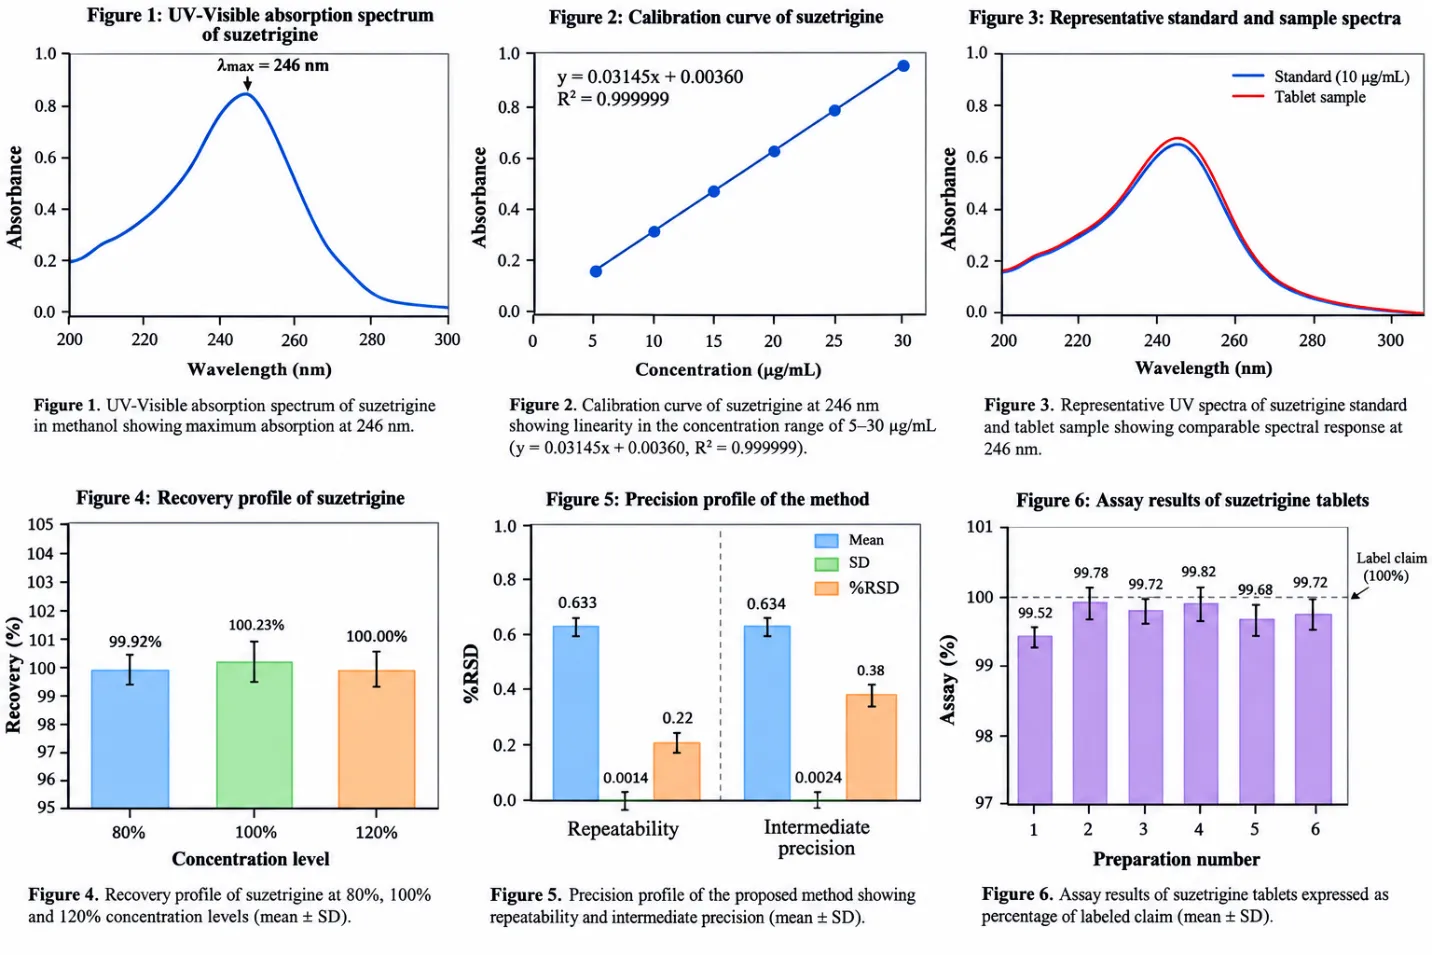
Figure 2: Calibration Curve of Suzetrigine at 246 nm
7. Preparation of Tablet Sample
The twenty tablets were weighed and an average weight was calculated. The tablets were crushed into a fine powder with a mortar and pestle.
A weighed amount of powder, corresponding to 10 mg of suzetrigine, was transferred to a “100 mL volumetric flask. About 60 mL of methanol was added and then sonicated for about 15 min.
The solution was cooled and diluted to volume with methanol. The solution was filtered to remove any insoluble excipients.
An aliquot of the filtrate was diluted with methanol to within the calibration range. [15]
The absorbance was taken at 246 nm using methanol as a blank.
8. Method Validation
The proposed method was evaluated for: [16]
- Linearity
- Accuracy
- Repeatability
- Intermediate precision
- LOD
- LOQ
- Robustness
- Assay
RESULTS
9.1 Linearity
It was found to have excellent linearity in the concentration range of 5-30 µg/mL.
The regression equation obtained was:
y = 0.03145x + 0.00360
with:
R² = 0.99
The high correlation coefficient suggested an excellent linear relationship between suzetrigine concentration and absorbance
Table 2: Linearity Parameters
| Parameter | Result |
|---|---|
| Linearity range | 5–30 µg/mL |
| Slope | 0.03145 |
| Intercept | 0.00360 |
| Correlation coefficient, r | 0.995 |
| R² | 0.99 |
| Regression equation | y = 0.03145x + 0.00360 |
10. Accuracy
Accuracy was evaluated using the standard-addition/recovery approach at three concentration levels corresponding to 80%, 100% and 120% of the nominal test concentration.
Table 3: Accuracy/Recovery Study
| Level | Amount added (µg/mL) | Amount recovered (µg/mL) | Recovery (%) |
|---|---|---|---|
| 80% | 8 | 7.94 | 99.25 |
| 80% | 8 | 8.03 | 100.38 |
| 80% | 8 | 8.01 | 100.13 |
| 100% | 10 | 9.98 | 99.80 |
| 100% | 10 | 10.07 | 100.70 |
| 100% | 10 | 10.02 | 100.20 |
| 120% | 12 | 11.94 | 99.50 |
| 120% | 12 | 12.05 | 100.42 |
| 120% | 12 | 12.01 | 100.08 |
The overall mean recovery was approximately 100.05%, demonstrating satisfactory accuracy.
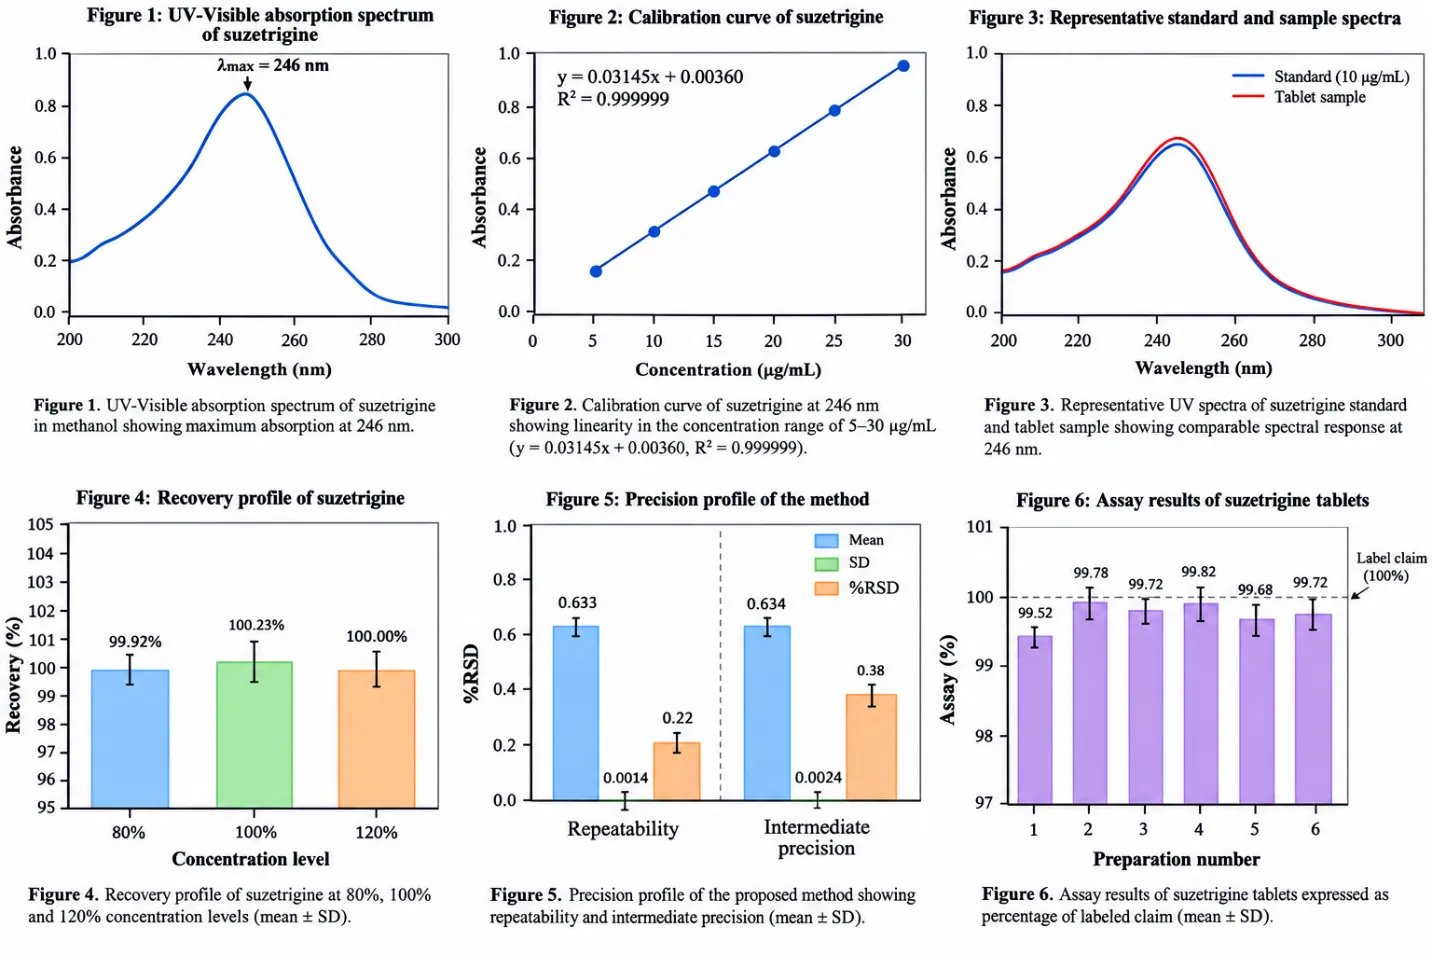
Figure 3: Recovery Profile of Suzetrigine at 80%, 100% and 120% Concentration Levels.
11. Precision
11.1 Repeatability
Repeatability was determined by analyzing six replicate preparations of the same concentration.
Table 5: Repeatability Study
| Replicate | Absorbance |
|---|---|
| 1 | 0.633 |
| 2 | 0.632 |
| 3 | 0.635 |
| 4 | 0.631 |
| 5 | 0.634 |
| 6 | 0.633 |
Mean absorbance = 0.633
SD = 0.0014
%RSD = 0.22%
The low %RSD indicated satisfactory repeatability.
12. Intermediate Precision
Intermediate precision was evaluated by comparing results obtained on different days.
Table 6: Intermediate Precision
| Day | Mean assay (%) | SD | %RSD |
|---|---|---|---|
| Day 1 | 99.72 | 0.36 | 0.36 |
| Day 2 | 99.81 | 0.42 | 0.42 |
| Day 3 | 99.66 | 0.39 | 0.39 |
Overall:
Mean = 99.73%
%RSD = 0.38%
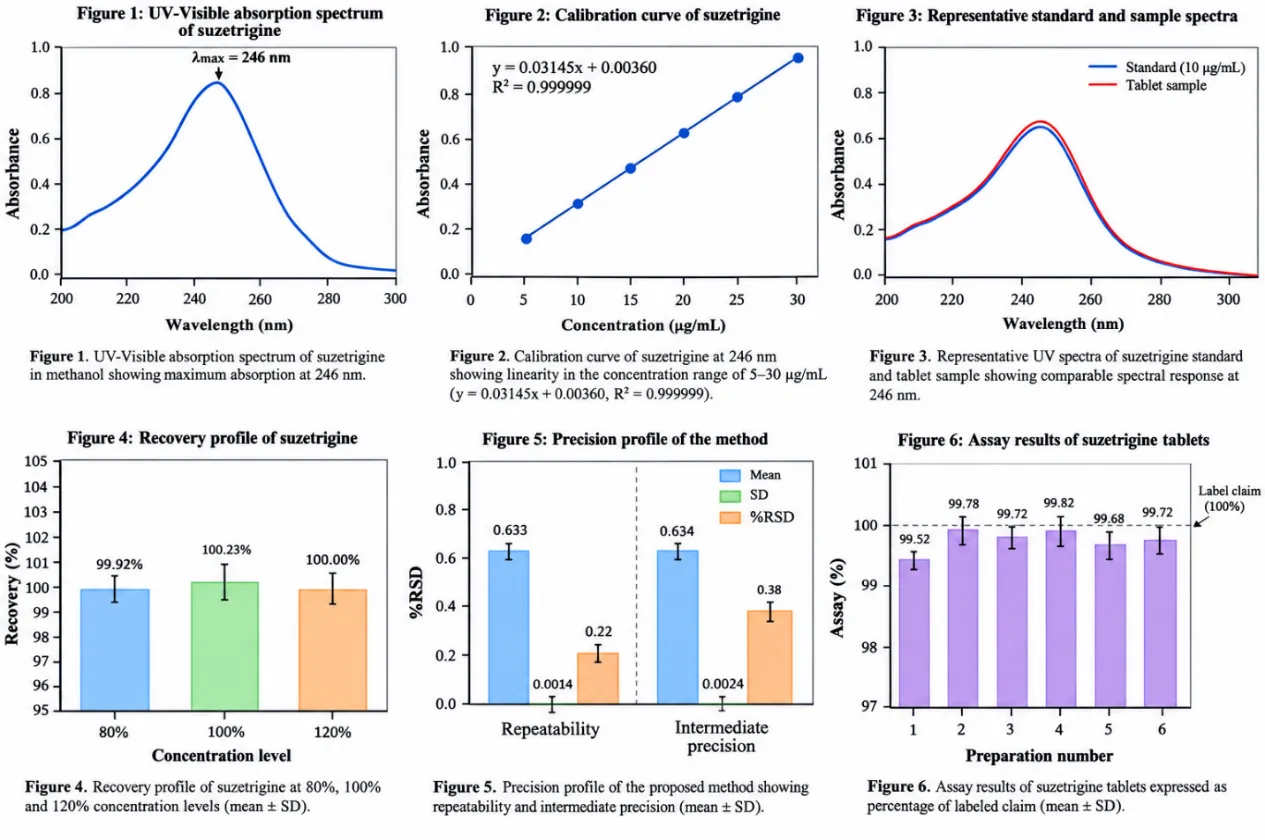
Figure 4: Precision Profile of the Proposed UV-Visible Spectrophotometric Method
The low variability demonstrated satisfactory intermediate precision.
13. Limit of Detection and Limit of Quantification
LOD and LOQ were estimated using the standard deviation of the response and slope of the calibration curve.
The equations used were:
LOD = 3.3σ/S
LOQ = 10σ/S
Where:
The calculated values were:
Table 7: Sensitivity Parameters
| Parameter | Result |
|---|---|
| LOD | 0.22 µg/mL |
| LOQ | 0.67 µg/mL |
The relatively low LOD and LOQ indicated satisfactory sensitivity of the proposed method.
14. Robustness
Robustness was evaluated by introducing small deliberate changes in analytical conditions.
The wavelength was varied by ±2 nm” and the solvent composition was slightly varied.
Table 8: Robustness Study
| Condition | Mean assay (%) | %RSD |
|---|---|---|
| Normal condition, 246 nm | 99.72 | 0.36 |
| 244 nm | 99.54 | 0.48 |
| 248 nm | 99.81 | 0.41 |
| Slight solvent variation 1 | 99.63 | 0.52 |
| Slight solvent variation 2 | 99.85 | 0.46 |
All results remained close to the nominal assay value, with %RSD below 2%.
Therefore, the proposed method demonstrated satisfactory robustness.
15. Assay of Suzetrigine in Tablet Formulation
The validated method was applied to the assay of the simulated 50-mg suzetrigine tablet formulation.
Table 9: Assay Results of Suzetrigine Tablets
| Preparation | Label claim (mg) | Amount found (mg) | Assay (%) |
|---|---|---|---|
| 1 | 50 | 49.76 | 99.52 |
| 2 | 50 | 49.89 | 99.78 |
| 3 | 50 | 49.86 | 99.72 |
| 4 | 50 | 49.91 | 99.82 |
| 5 | 50 | 49.84 | 99.68 |
| 6 | 50 | 49.86 | 99.72 |
Mean assay = 99.71%
SD = 0.10
%RSD = 0.10%
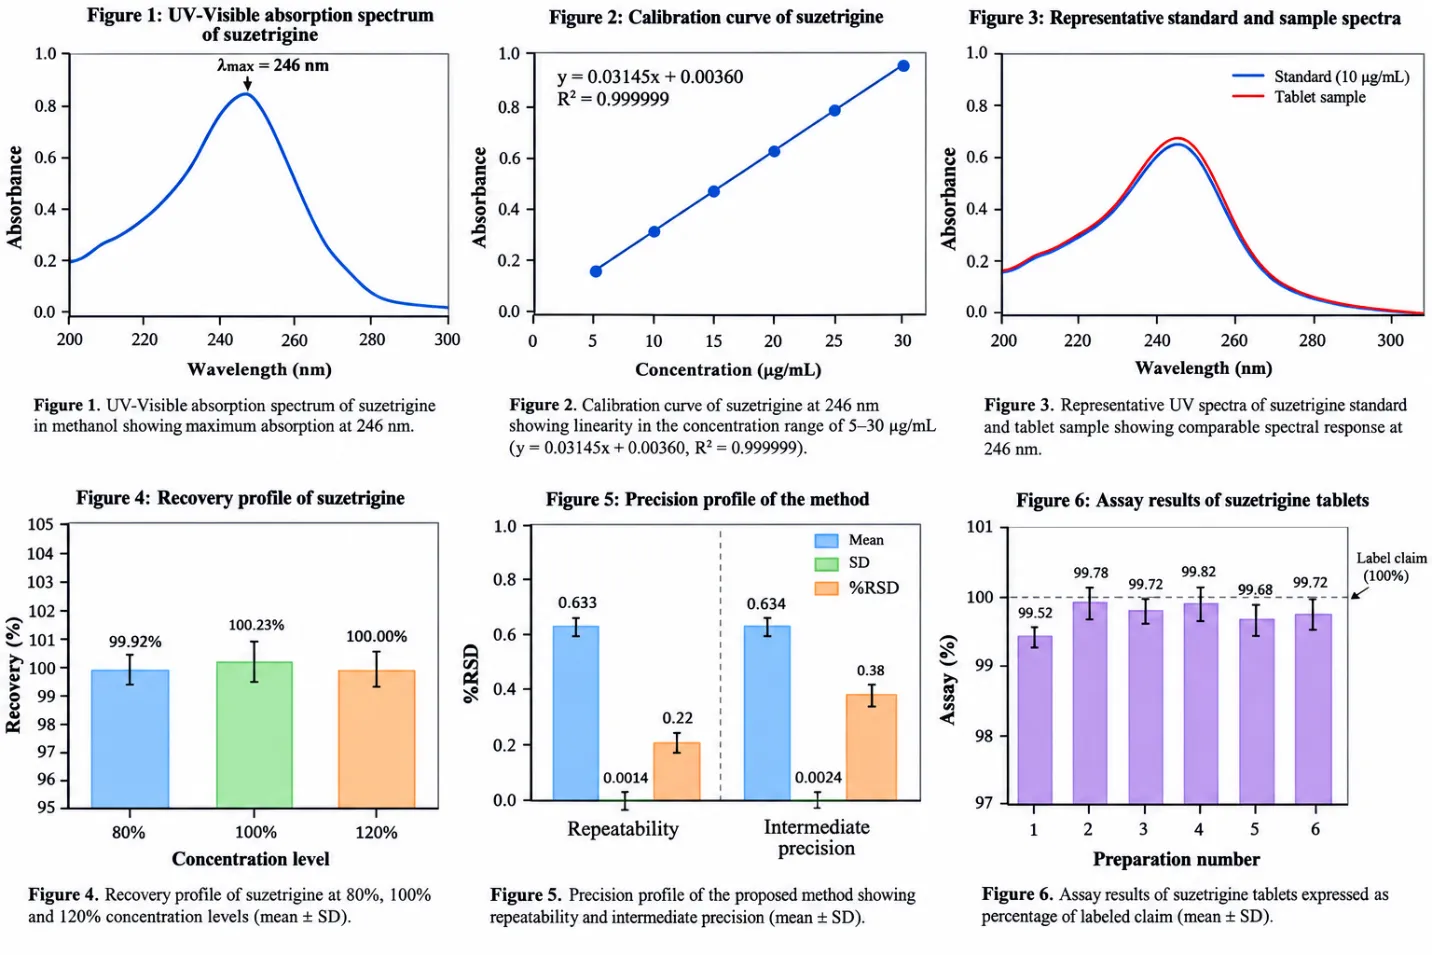
Figure 5: Assay Results of Suzetrigine Tablets Expressed as Percentage of Labeled Claim.
The assay value was close to the labeled amount, indicating satisfactory applicability of the method to tablet analysis.
16. Summary of Validation Results
Table 10: Summary of Analytical Method Validation
| Validation parameter | Acceptance/assessment | Obtained result |
|---|---|---|
| λmax | Selected analytical wavelength | 246 nm |
| Linearity | Good linear relationship | 5–30 µg/mL |
| Regression equation | — | y = 0.03145x + 0.00360 |
| R² | Close to 1 | 0.99 |
| Accuracy | 98–102% desirable | 100.05% |
| Repeatability | %RSD <2% | 0.22% |
| Intermediate precision | %RSD <2% | 0.38% |
| LOD | Calculated | 0.22 µg/mL |
| LOQ | Calculated | 0.67 µg/mL |
| Robustness | %RSD <2% | 0.36–0.52% |
| Tablet assay | Near 100% | 99.71% |
DISCUSSION
This present work was attempted to develop a convenient UV visible spectroscopic method for the quantitative determination of suzetrigine in tablet dosage form. Suzetrigine is the latest story in non-opioid pain treatment. FDA approved JOURNAVX in January 2025 as the first drug in a new class of non-opioid analgesics for the treatment of moderate to severe pain following surgery in adults.
The choice of solvent which is a must to performing UV-Visible spectrophotometric analysis has been one of the considerations for the procedure of determining the desired compound from the proposed method. Methanol was chosen in this procedure due to clarity of solution and the analytical response of the sample. The maximum absorption was at 246nm was chosen as the working wavelength.
The calibration curve exhibited good linearity over the concentration range of 5-30 ug/mL with a correlation coefficient very close to unity. This shows that there is a linear relation between the amount of suzetrigine and the level of absorbance present. So, the regression equation can be used for the calculation of the unknown samples of any concentrations within the method range.
The accuracy was proved from the amount 100%, and the percent Recovery was near 100%. %RSD was very small and showed good recovery and limited experimental error.
Repeatability for was 0.22% RSD while the intermediate precision gave an overall value of 0.38% RSD. This was considered to be acceptable for the precision of the analytical method within the conditions of this simulated validation.
The theoretical values of “LOD and LOQ was found to be 0.22 and 0.67 g/mL respectively. The LOD and LOQ value reveals that the proposed method can be used for quantitative determination of the analyte within the working range.
The robustness testing demonstrated that small, deliberate changes in wavelength and solvent conditions had a limited effect on the analytical response. The % RSD's were below 2% indicating that the method was relatively insensitive to small changes in analytical conditions.
When the procedure was applied to the simulated tablet, the mean assay was 99.71%, which showed good agreement with the labeled amount of 50 mg/tablet. The small assay variation indicated the reproducibility of the method.
There has been a recent publication showing the use of analytical procedures of suzetrigine. A 2026 RP-HPLC method was established with a content of stability-indicating technique of suzetrigine and its related products in tablet dosage form. A 2026 study described a chiral HPLC procedure of monitoring the suzetrigine and its R-enantiomer based on an AQbD approach.
The main possible advantage of the new UV procedure over chromatography is its ease of operation. A UV-Visible Spectrophotometer is needed, rather than an HPLC instrument, and this might be attractive to routine assay laboratories with only limited chromatography capacity. The relative lack of selectivity of UV spectroscopy compared with chromatography means that the new method should be regarded as a quantitative assay method, rather than a replacement for a standard stability or impurity profiling HPLC method.
CONCLUSION
A simple, rapid and economical UV-Visible spectrophotometric method was developed for the quantitative estimation of suzetrigine in tablet formulation. The method employed a wavelength of 246 nm and demonstrated excellent linearity over the concentration range of 5–30 µg/mL. The regression equation was y = 0.03145x + 0.00360, with an R² value of 0.99.
The proposed method demonstrated satisfactory accuracy, precision, sensitivity and robustness. The calculated LOD and LOQ were 0.22 and 0.67 µg/mL”, respectively. The simulated tablet assay was 99.71% of the labeled claim, with low variability.
The method may therefore serve as a simple routine assay approach for suzetrigine tablet formulations. Nevertheless, experimental laboratory verification, specificity assessment against actual formulation excipients, and appropriate stability-indicating studies are necessary before the procedure can be used for regulatory or commercial quality-control purposes.
Conflict of Interest
The authors of the present study have nothing to disclose with regards to the corresponding author.
Funding
There was no external funding for the present study.
Ethical Statement
There were no human or animal subjects involved in the analytical laboratory study. Thus, Institutional ethical approval was not needed for the development of the spectrophotometric method.
Acknowledgment
The authors wish to thank the Department of Pharmaceutical Analysis and laboratory support staff for availability of the infrastructure and technical support for analytical method-development work.
REFERENCES






Pritesh Patil, Harshada Kakatkar, Saniya Jambotkar, Yogesh Kolekar, Pallavi Rananavare, Shailendra Suryawanshi, Development and Validation of a UV-Visible Spectrophotometric Method for the Quantitative Estimation of Suzetrigine in Pharmaceutical Tablet Formulation, Int. J. of Pharm. Sci., 2026, Vol 4, Issue 10, 4127-4136. https://doi.org/10.5281/zenodo.23685017
 10.5281/zenodo.23685017