

We use cookies to ensure our website works properly and to personalise your experience. Cookies policy
Sahyadri College of Pharmacy Methwade, Sangola, Maharashtra 413317
Levosalbutamol sulphate is a selective ?2-adrenergic agonist widely used in the treatment of asthma and chronic obstructive pulmonary disease. The present study aimed to develop and validate simple, accurate, precise, and economical UV spectrophotometric and RP-HPLC methods for the quantitative estimation of Levosalbutamol sulphate in pharmaceutical dosage forms. The UV method was developed using methanol as solvent with a maximum absorption wavelength of 226 nm, while the RP-HPLC method employed a Phenomenex Kinetex XB-C18 column using 0.1% orthophosphoric acid and acetonitrile (30:70 v/v) as the mobile phase. The developed methods were validated according to ICH Q2(R2) guidelines for specificity, linearity, accuracy, precision, robustness, limit of detection, and limit of quantification. Both methods showed excellent linearity (R² >0.999), satisfactory recovery, and low relative standard deviation. The validated analytical methods are suitable for routine quality control analysis of Levosalbutamol sulphate in pharmaceutical formulations.
Levosalbutamol sulphate is the pharmacologically active R-enantiomer of salbutamol and is widely used as a selective β2-adrenergic receptor agonist for the treatment of bronchial asthma and chronic obstructive pulmonary disease (COPD). It produces bronchodilation by relaxing bronchial smooth muscles and provides rapid relief from airway obstruction. Compared with racemic salbutamol, levosalbutamol exhibits improved therapeutic efficacy and fewer cardiovascular adverse effects because it lacks the inactive S-enantiomer, which has been associated with undesirable pharmacological responses.¹-²
Analytical quality control plays an essential role in ensuring the safety, efficacy, and consistency of pharmaceutical products. Reliable analytical methods are required for routine assay, dissolution testing, stability studies, and quality assurance during manufacturing. The selected analytical method should provide high accuracy, precision, specificity, sensitivity, and reproducibility while remaining economical and simple to perform.³ Among the available analytical techniques, UV-visible spectrophotometry is one of the most commonly employed methods because of its simplicity, rapid analysis, and cost-effectiveness. It is extensively used for routine quantitative estimation of pharmaceutical compounds. However, UV spectroscopy has limitations in selectivity when formulation excipients or degradation products interfere with drug estimation. Therefore, chromatographic techniques such as Reverse Phase High Performance Liquid Chromatography (RP-HPLC) are preferred for pharmaceutical analysis requiring higher sensitivity and specificity.⁴
RP-HPLC has become the analytical technique of choice in pharmaceutical industries because of its excellent resolution, reproducibility, short analysis time, and capability to separate analytes from impurities and degradation products. Method optimization involves selecting an appropriate stationary phase, mobile phase composition, flow rate, detection wavelength, and sample preparation conditions to achieve efficient chromatographic separation.⁵ Before an analytical method can be routinely applied, it must undergo systematic validation to demonstrate its suitability for the intended purpose. According to the International Council for Harmonisation (ICH) guideline Q2(R2), analytical methods should be validated for specificity, linearity, accuracy, precision, robustness, limit of detection (LOD), limit of quantification (LOQ), and range. Proper validation ensures that the developed method consistently produces reliable and reproducible analytical results.⁶ Several analytical methods have been reported for the estimation of bronchodilator drugs; however, there remains a need for a simple, rapid, economical, and fully validated method suitable for routine quality control laboratories.
The present investigation aimed to develop and validate both UV spectrophotometric and RP-HPLC methods for the quantitative estimation of Levosalbutamol sulphate in pharmaceutical dosage forms according to current ICH guidelines. The developed methods are expected to provide reliable analytical performance for routine pharmaceutical quality control and regulatory applications.
MATERIALS AND METHODS
Materials
Levosalbutamol sulphate reference standard (purity ≥99.0%) was obtained from a certified pharmaceutical manufacturer. Commercial tablet formulations containing Levosalbutamol sulphate were procured from the local market. HPLC-grade acetonitrile, methanol, orthophosphoric acid, HPLC-grade water, and analytical-grade chemicals were used throughout the study. All reagents complied with the specifications of the Indian Pharmacopoeia (IP) and were used without further purification. Glassware and volumetric apparatus were calibrated before use.⁸
Instrumentation
UV spectrophotometric analysis was carried out using a double-beam UV–Visible spectrophotometer equipped with 1 cm quartz cells. RP-HPLC analysis was performed using a high-performance liquid chromatographic system equipped with a quaternary pump, autosampler, PDA detector, and chromatography software. Separation was achieved using a Phenomenex Kinetex XB-C18 column (150 × 4.6 mm, 5 μm).⁹
UV Spectrophotometric Method
A standard stock solution of Levosalbutamol sulphate was prepared in methanol. The solution was scanned between 190–400 nm, and the maximum absorbance (λmax) was found at 226 nm. Working standard solutions were prepared in the concentration range of 40–60 μg/mL. The absorbance of each solution was measured at 226 nm, and a calibration curve was constructed by plotting absorbance against concentration. The developed method was validated for linearity, accuracy, precision, repeatability, LOD, and LOQ according to ICH Q2(R2) recommendations.¹⁰
RP-HPLC Method Development
Chromatographic separation was achieved using a Phenomenex Kinetex XB-C18 column (150 × 4.6 mm, 5 μm). The optimized mobile phase consisted of 0.1% orthophosphoric acid and acetonitrile (30:70, v/v), delivered at a flow rate of 1.0 mL/min. The injection volume was 10 μL, the detection wavelength was 226 nm, and the total run time was 10 min. Before use, the mobile phase was filtered through a 0.45 μm membrane filter and degassed by ultrasonication. Standard and sample solutions were prepared using the optimized diluent and filtered before injection into the HPLC system.¹¹
Method Validation
The developed UV spectrophotometric and RP-HPLC methods were validated in accordance with ICH Q2(R2) guidelines. Validation parameters included specificity, linearity, accuracy, precision, repeatability, robustness, limit of detection (LOD), and limit of quantification (LOQ). Linearity was evaluated over the concentration range of 80–120% of the working concentration. Accuracy was determined by recovery studies at 80%, 100%, and 120% concentration levels. Precision was assessed by intraday and interday studies, while robustness was evaluated by small deliberate variations in wavelength and column temperature.¹²
Statistical Analysis
Experimental results were expressed as mean ± standard deviation. Calibration curves were generated by linear regression analysis, and the correlation coefficient (R²) was calculated to evaluate linearity. Statistical parameters including regression equation, standard deviation, relative standard deviation (%RSD), LOD, and LOQ were calculated using Microsoft Excel and chromatography software. Acceptance criteria were evaluated according to ICH validation requirements.¹³
RESULTS AND DISCUSSION
Organoleptic attributes:
Physical parameters:
Melting point of Levosalbutamol sulphate: 187–190°C
Solubility:
The solubility of levosalbutamol sulphatewas determined in various solvents as shownin Table 1.
Table No.1 Solubility Chart
|
Solvent |
Solubility Description |
|
Water |
Freely soluble |
|
Methanol |
Soluble |
|
Ethanol |
Slightly soluble |
|
Chloroform |
Practically insoluble |
|
Acetone |
Slightly soluble |
|
Ether |
Practically insoluble |
|
Dilute Hydrochloric Acid |
Soluble |
|
Phosphate Buffer (pH 6.8) |
Soluble |
UV
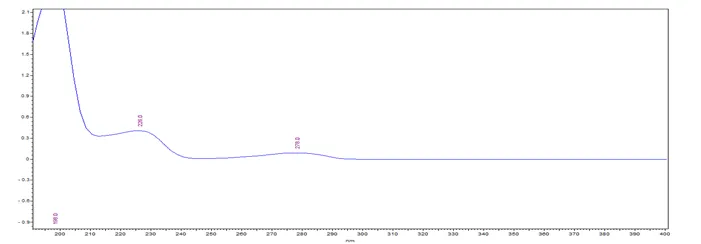
Figure 1 UV-Visible absorption spectrum of levosalbutamol sulphate in the selected solvent.
Table: 2 Absorbance Data and % Assay Results of Levosalbutamol Sulphate by UV Spectrophotometric Method
|
Sample |
LSB |
|
|
Absorbance |
% Assay |
|
|
1 |
0.489 |
98.99 |
|
2 |
0.491 |
99.39 |
|
3 |
0.490 |
99.19 |
|
4 |
0.492 |
99.60 |
|
5 |
0.491 |
99.39 |
|
6 |
0.492 |
99.60 |
|
AVG |
99.36 |
|
|
STDEV |
0.24 |
|
|
RSD |
0.24 |
|
UV Repeatability
UV repeatability refers to the ability of a UV spectrophotometric method to produce consistent and similar absorbance values when the same sample is measured multiple times under identical conditions. It is an important parameter in method validation that ensures the precision and reliability of the analytical method. In the given data, the sample at 100% concentration was analyzed six times (Replicates 1–6). The absorbance values are very close to each other, showing minimal variation. The mean absorbance was 0.494 with SD0.001 and relative standard deviation (RSD) of 0.28%.
Table: 3 UV Spectrophotometric Repeatability Data of Sample (100% Concentration)
|
Sample ID |
Absorbance |
|
100% Rep 1 |
0.493 |
|
100% Rep 2 |
0.494 |
|
100% Rep 3 |
0.495 |
|
100% Rep 4 |
0.494 |
|
100% Rep 5 |
0.491 |
|
100% Rep 6 |
0.494 |
|
AVG |
0.494 |
|
STDEV |
0.001 |
|
RSD |
0.28 |
UV Linearity
Table: 4 Linearity data of the UV spectrophotometric method at five concentration levels.
|
% Level |
Concentration (ug/ml) |
Absorbance |
|
80 |
40 |
0.394 |
|
90 |
45 |
0.441 |
|
100 |
50 |
0.493 |
|
110 |
55 |
0.544 |
|
120 |
60 |
0.593 |
The calibration curve exhibited an excellent linear relationship over the studied concentration range.
LOD and LOQ of levosalbutamol
Table:5 Regression Statistics of UV Spectrophotometric Method for Linearity Study
|
Regression Statistics |
|
|
Multiple R |
0.999882491 |
|
R Square |
0.999765 |
|
Adjusted R Square |
0.999686662 |
|
Standard Error |
0.001402379 |
|
Observations |
5 |
ANOVA
Table: 6 ANOVA, Regression Analysis, and LOD & LOQ Determination of UV Spectrophotometric Method for Levosalbutamol
|
|
df |
SS |
MS |
F |
Significance F |
|
Regression |
1 |
0 |
0 |
12763 |
1.52908 |
|
Residual |
3 |
0 |
0 |
|
|
|
Total |
4 |
0 |
|
|
|
|
|
Coefficients |
Standard Error |
t Stat |
P-value |
|
|
Intercept |
0 |
0 |
-2 |
0 |
|
|
X Variable 1 |
0 |
0 |
113 |
0 |
|
|
LOD & LOQ of Levosalbutamol |
LOD |
1.48 |
ug/ml |
||
|
LOQ |
4.47 |
ug/ml |
|||
|
% Level |
Reps |
Spiked Conc (ug/ml) |
Abs |
Amount Recovered (ug/ml) |
% Recovery |
AVG |
STD EV |
RSD |
|
80 |
Rep 1 |
40.00 |
0.393 |
39.78 |
99.44 |
99.44 |
0.25 |
0.25 |
|
Rep 2 |
40.00 |
0.394 |
39.88 |
99.70 |
||||
|
Rep 3 |
40.00 |
0.392 |
39.68 |
99.19 |
||||
|
100 |
Rep 1 |
50.00 |
0.493 |
49.90 |
99.80 |
100.00 |
0.20 |
0.20 |
|
Rep 2 |
50.00 |
0.494 |
50.00 |
100.00 |
||||
|
Rep 3 |
50.00 |
0.495 |
50.10 |
100.20 |
||||
|
120 |
Rep 1 |
60.00 |
0.593 |
60.02 |
100.03 |
100.03 |
0.17 |
0.17 |
|
Rep 2 |
60.00 |
0.594 |
60.12 |
100.20 |
||||
|
Rep 3 |
60.00 |
0.592 |
59.92 |
99.87 |
Intra & Interday
Table: 7 Intraday and Interday Precision Data of UV Spectrophotometric Method
|
Condition |
Interval |
Absorbance |
% Assay |
|
Intraday |
Mrng WS |
0.494 |
- |
|
Mrng DP |
0.489 |
98.99 |
|
|
Evng WS |
0.491 |
- |
|
|
Evng DP |
0.486 |
98.98 |
|
|
Interday |
Day 2 WS |
0.475 |
- |
|
|
Day 2 DP |
0.468 |
98.53 |
|
|
|
|
0.27 |
The intraday and interday studies show consistent absorbance and % assay values, indicating good precision of the method within the same day and across different days.
The low variation (RSD ≈ 0.27%) confirms that the UV method is reliable and reproducible for routine analysis.
UV investigation
UV absorbance scanning should beperformed before HPLC method developmentto identify an appropriate detectionwavelength.
A. Choice of normal solvents
Solubility studies were done so as to locate an appropriate dissolvable in which tablet of Levosalbutamol are totally dissolvable and stable. Solvents like Water, Methanol, Ethanol, Chloroform, Acetone, Ether were pursued for checking solubility. Subsequent to surveying the dissolvability of medication in various dissolvable has been chosen and settled as regular dissolvable to watch other worldly qualities.
B. Study of spectra and selection of wavelength:
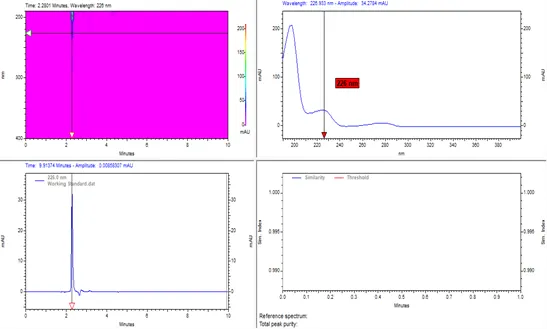
Figure No. 2 UV Spectrum of Levosalbutamol Sulphate showing λmax of 226 nm
HPLC Method Development:
Preparation of 0.1% O-phosphoric acid: In 1000 ml HPLC water, 1 ml of orthophosphoric acid was added and mixed well.
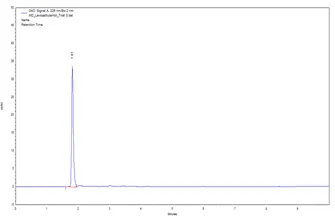
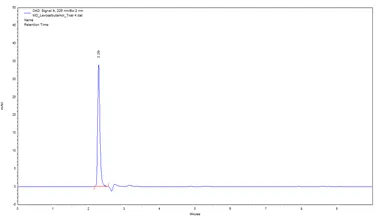
Table: 8 Chromatographic Condition for optimization Method
|
Trial No. |
Mobile Phase |
Ratio |
Diluent |
Column |
Wavelength |
Flow rate (ml/min) |
Runtime (minutes) |
|
1 |
0.1% O-phosphoric Acid : Acetonitrile |
50-50 |
50-50 |
Kinetex XB C18 (4.6 x 150mm 5-Micron |
250 nm |
1.00 |
10.00 |
|
2 |
0.1% O-phosphoric Acid : Acetonitrile |
40-60 |
50-50 |
Kinetex XB C18 (4.6 x 150mm 5-Micron |
226 nm |
1.00 |
10.00 |
|
3 |
0.1% O-phosphoric Acid : Acetonitrile |
35-65 |
50-50 |
Kinetex XB C18 (4.6 x 150mm 5-Micron |
226 nm |
1.00 |
10.00 |
|
4 |
0.1% O-phosphoric Acid : Acetonitrile |
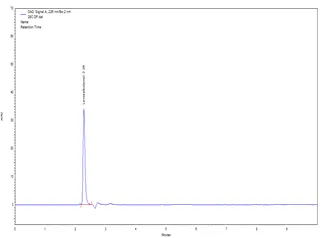
30-70 |
50-50 |
Kinetex XB C18 (4.6 x 150mm 5-Micron |
226 nm |
1.00 |
10.00 |
|
Levosalbutamol |
Observation |
||||||
|
RT |
TP |
Aysmmetry |
Peak Purity |
||||
|
1.11 |
2734 |
1.13 |
1.00 |
The peak eluted too early and The theoretical plate count was low. |
|||
|
1.36 |
4018 |
1.31 |
1.00 |
Retention time increased slightly and theoretical plates improved. |
|||
|
1.81 |
5453 |
1.31 |
1.00 |
Retention time increased by 0.5 minutes and theoretical plates also increased by 1400. |
|||
|
2.29 |
6364 |
1.27 |
1.00 |
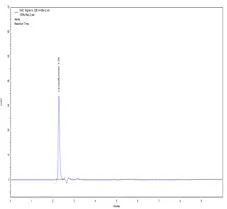
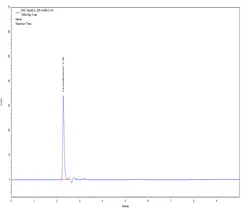
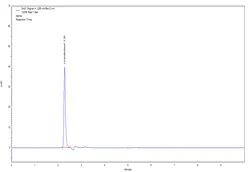
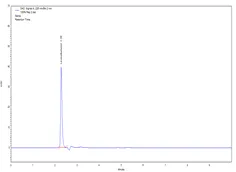
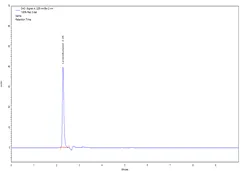
Retention time was 2.29 minutes which is acceptable and theoretical plates were around 6300. Final Method |
|||
Standard Preparation:
Levosalbutamol Standard Stock Solution-I (LSSS-I):
Initially Prepare a Standard Stock Solution (LSSS-I) of by adding5 mg of Levosalbutamolin 100 ml volumetric flask & add 50 ml diluent, mix for 2 minutes and make the volume to 10 ml with diluent.
Further 1 ml of this solution was diluted to 10 ml using diluent. (Conc. Of Levosalbutamol= 5 µg/ml).
Drug Product Preparation:
Powder equivalent to 5 mg of drug was weighed in 100 ml volumetric flask and diluent was added upto the mark and sonicated for 5 minutes and further 1 ml of this solution was diluted to 10 ml using diluent.
Selection of Wavelength:
The sample was scanned from 190-400 nm with PDA detector. The Wavelength selected for analysis chosen was 226 nm basis of appropriate intensity of Levosalbutamol.
Method Validation:
a. Specificity and Assay:
Individual solution of Levosalbutamol working standard and Drug product was prepared of 5 µg/ml, respectively and peak was for identified from Retention Time. Blank was injected to ensure there is no blank peak interfering with the main analyte peaks.
Table: 9 Results for Assay
|
Sample ID |
Levosalbutamol |
||
|
RT |
Area |
Assay (%) |
|
|
Blank |
- |
- |
- |
|
Working STD |
2.28 |
315951 |
- |
|
Drug Product |
2.28 |
314754 |
99.62 |
b. Instrument Precision and System Suitability:
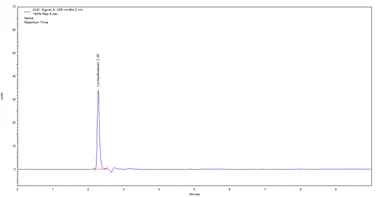
A single sample was prepared as described and 6 injections were made from same sample and checked for system suitability.
System suitability parameters are as below:
1. Retention Time,
2. Theoretical plates,
3. Asymmetry (Tailing factor),
4. Peak Purity.
1 |
2 |
3 |
4 |
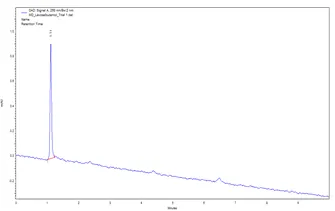
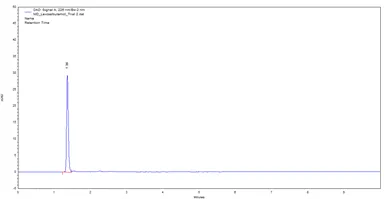
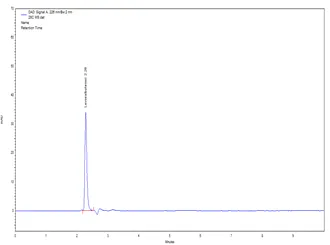
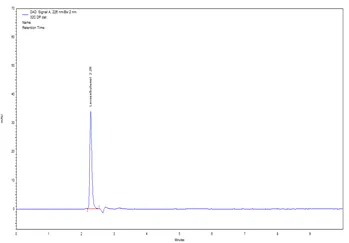
Fig No 3 Chromatogram of Chromatographic Condition 1,2,3 and 4
Linearity and Range:
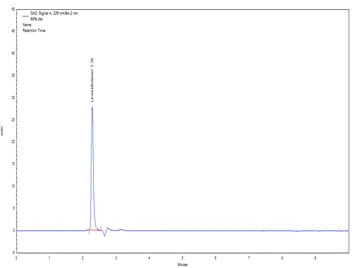
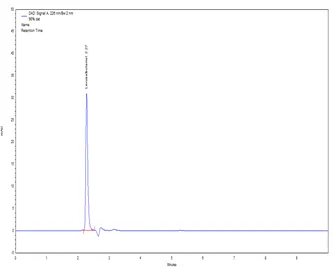
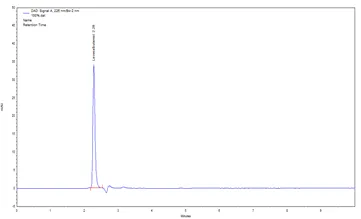
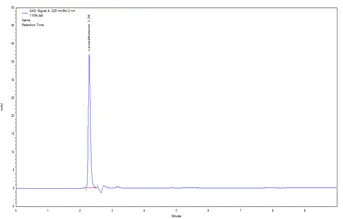
Samples of varying concentrations ranging from 80%-120% were made.
The sample preparations and concentrations are given as below;
X ml of Levosalbutamol was added to 10 ml diluent to make up the concentrations given above:
|
% Level |
X ml of LSSS-I |
Levosalbutamol Conc. (µg/ml) |
|
80 |
0.8 |
4.0 |
|
90 |
0.9 |
4.5 |
|
100 |
1.0 |
5.0 |
|
110 |
1.1 |
5.5 |
|
120 |
1.2 |
6.0 |
80% |
90% |
100% |
110% |
Figure No. 4 Chromatograms for Linearity at 80%, 90%, 100%, 110%

120% |
|
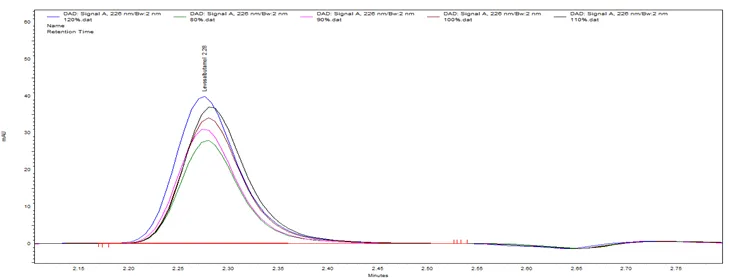
Figure No. 5 Chromatograms of Overlay Linearity at 80%, 90%,100%,110%,120%
Table No. 10 Calculation for Linearity of Levosalbutamol
|
Levosalbutamol |
||
|
% Level |
Conc (ug/ml) |
Area |
|
80 |
4 |
252765 |
|
90 |
4.5 |
285443 |
|
100 |
5 |
315951 |
|
110 |
5.5 |
348110 |
|
120 |
6 |
379894 |
Data Integration:
The Correlation coefficient for Levosalbutamol was found to be 0.999 respectively, which indicates that the peak responses are linear. This concluded that the method was linear throughout the range selected.
Precision:
Intra-day and inter-day precision exactness is done in the same day on various days as communicated as % R.S.D. The estimations of % R.S.D. for inter-day variation, which proposed a phenomenal exactness of technique.
|
Levosalbutamol |
||||
|
Condition |
Sample ID |
RT |
Peak Area |
% Assay |
|
Morning |
WS |
2.28 |
315951 |
- |
|
DP |
2.28 |
314754 |
99.62 |
|
|
Evening |
WS |
2.28 |
312014 |
- |
|
DP |
2.28 |
310312 |
99.45 |
|
|
% RSD |
0.82 |
0.12 |
||
|
Day 2 |
WS |
2.28 |
305685 |
- |
|
DP |
2.28 |
303114 |
99.16 |
|
|
% RSD |
1.63 |
0.24 |
||
Repeatability:
A minimum 6 determinations at 100% of the test concentration.
1 |
2 |
3 |
4 |
5 |
6 |
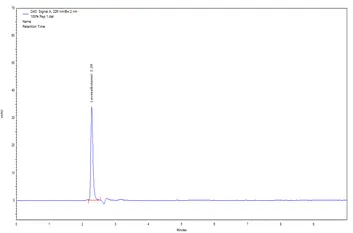
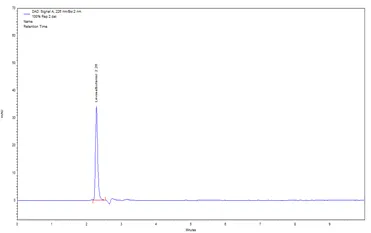
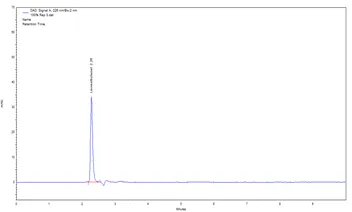
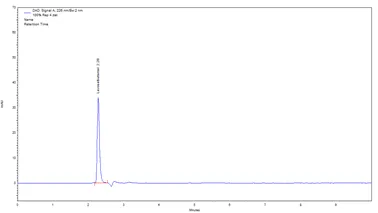
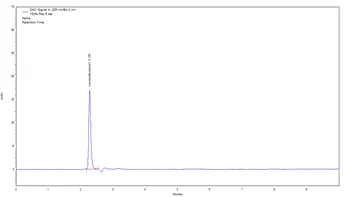
Figure No. 6 Chromatograms for system suitability of Levosalbutamol
System suitability results for Levosalbutamol
Table No.11 Replicate of 100% Test Concentrations for Levosalbutamol
|
Levosalbutamol |
|||||
|
Sample ID |
Area |
RT |
TP |
Asymmetry |
Peak Purity |
|
100% Rep 1 |
315951 |
2.28 |
6439 |
1.32 |
1.00 |
|
100% Rep 2 |
315125 |
2.28 |
6571 |
1.28 |
1.00 |
|
100% Rep 3 |
315334 |
2.28 |
6234 |
1.27 |
1.00 |
|
100% Rep 4 |
315585 |
2.28 |
6374 |
1.31 |
1.00 |
|
100% Rep 5 |
315858 |
2.28 |
6621 |
1.29 |
1.00 |
|
100% Rep 6 |
315642 |
2.28 |
6175 |
1.33 |
1.00 |
|
AVG |
315583 |
2.28 |
|
||
|
STDEV |
311.8646 |
0 |
|||
|
% RSD |
0.10 |
0.00 |
|||
Data Interpretation:
The results of Repeatability were found within acceptance criteria. From the above results, it was concluded that the method is precise.
Accuracy:
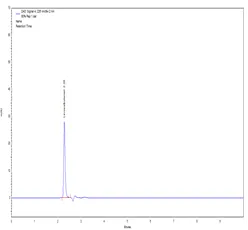
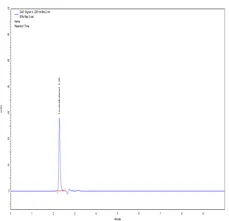
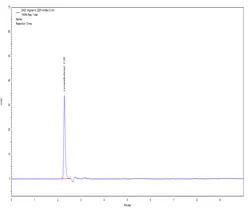
Accuracy of a scientific strategy is the vicinity of the sample outcomes acquired by the technique to the genuine worth. To check the accuracy of proposed technique, exactness was completed 80, 100, and 120 % of test fixation according to ICH rules. Known measure of standard medications were added to dissected example and exposed to the created UV strategy. At that point the absorbance was taken and further count was completed. The Accuracy study was performed multiple times at each level.
80% Rep 1 |

80% Rep 2 |
80% Rep 3 |
100% Rep 1 |
100% Rep 2 |
100% Rep 3 |
120% Rep 1 |
120% Rep 2 |
120% Rep 3 |
Figure No. 7 Chromatograms for Accuracy at 80%, 100% and 120% level
Table No. 12 Peak Results for Accuracy of Levosalbutamol
|
Levosalbutamol |
|||
|
Std wt. (mg) |
% Purity |
Std Stock Conc. (ug/ml) |
Working Std Area |
|
5 |
99.9 |
49.95 |
315583 |
|
Sample ID |
Reps |
Spiked Conc. (ug/ml) |
Area |
Amount Recovered (ug/ml) |
% Recovery |
AVG |
STD EV |
% RSD |
|
80% |
Rep 1 |
4.00 |
252765 |
4.00 |
100.12 |
100.02 |
0.09705 |
0.10 |
|
Rep 2 |
4.00 |
252275 |
3.99 |
99.92 |
||||
|
Rep 3 |
4.00 |
252515 |
4.00 |
100.02 |
||||
|
100% |
Rep 1 |
5.00 |
315951 |
5.00 |
100.12 |
99.96 |
0.136087 |
0.14 |
|
Rep 2 |
5.00 |
315125 |
4.99 |
99.86 |
||||
|
Rep 3 |
5.00 |
315334 |
4.99 |
99.92 |
||||
|
120% |
Rep 1 |
5.99 |
379894 |
6.01 |
100.32 |
100.21 |
0.111154 |
0.11 |
|
Rep 2 |
5.99 |
379562 |
6.01 |
100.23 |
||||
|
Rep 3 |
5.99 |
379058 |
6.00 |
100.09 |
Data Interpretation:
The results met the acceptance criteria;however, this conclusion relates to filter compatibility and should not be discussedunder LOD/LOQ.”
Robustness:
The Robustness was performed by changing the column temperature by ± 2 ̊C.
Each Sample was injected % Assay was calculated at each condition was calculated.
Table No. 13 Robustness Column Temperature 28°C, 30°C, 32°C
|
Variation in Column temperature |
||||
|
Condition |
Sample ID |
RT |
Area |
% Assay |
|
28C |
WS |
2.28 |
312467 |
- |
|
DP |
2.28 |
311559 |
99.71 |
|
|
30C |
WS |
2.28 |
315951 |
- |
|
DP |
2.28 |
314754 |
99.62 |
|
|
32C |
WS |
2.28 |
313254 |
- |
|
DP |
2.28 |
312415 |
99.73 |
|
|
AVG |
2.28 |
313400 |
99.69 |
|
|
SD |
0.00 |
1648.77 |
0.06 |
|
|
% RSD |
0.00 |
0.53 |
0.06 |
|
280C DP |
280C WS |
Figure No. 8 Chromatograms for Column temp at 28°C
320C DP |
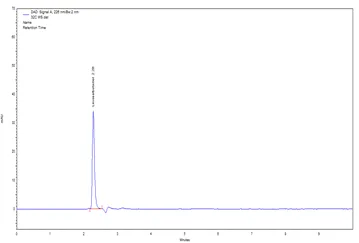
320C WS |
Figure No. 9 Chromatograms for Column temp at 32°C
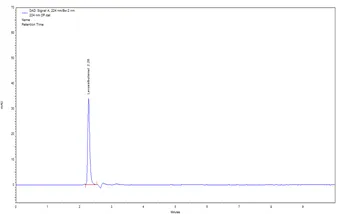
224nm DP |
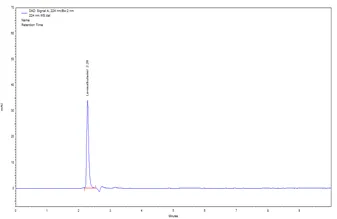
224nm WS |
Figure No. 10 Chromatograms for Column Variation in wavelength 224nm
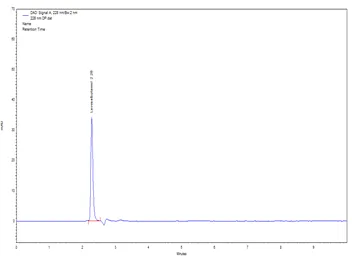
228nm DP |
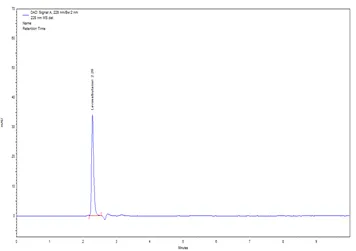
228nm WS |
Figure No. 11 Chromatograms for Column Variation in wavelength 228nm
Table No. 14 Robustness Column Variation in wavelength 224nm, 226nm and 228nm
|
Variation in wavelength |
||||
|
Condition |
Sample ID |
RT |
Area |
% Assay |
|
224 nm |
WS |
2.28 |
310254 |
- |
|
DP |
2.28 |
309112 |
99.63 |
|
|
226 nm |
WS |
2.28 |
315951 |
- |
|
DP |
2.28 |
314754 |
99.62 |
|
|
228 nm |
WS |
2.28 |
312121 |
- |
|
DP |
2.28 |
311034 |
99.65 |
|
|
AVG |
2.28 |
312204 |
99.63 |
|
|
SD |
0.00 |
2656.36 |
0.02 |
|
|
% RSD |
0.00 |
0.85 |
0.02 |
|
Data Interpretation:
The results were found within acceptance criteria. Hence the method is robust throughout the selected specification criteria.
Specificity:
Blank & Placebo Interference: Placebo was injected in triplicate by weighing the equivalent amount present in the finished drug product and analyzed for interference due to placebo. The blank and placebo chromatograms showed no interfering peaks at the retention time of Levosalbutamol sulphate (RT ≈ 2.28 min). The drug product chromatogram exhibited a sharp and well-resolved peak corresponding to the analyte. Therefore, the developed RP-HPLC method was found to be specific and free from interference by diluent or formulation excipients.
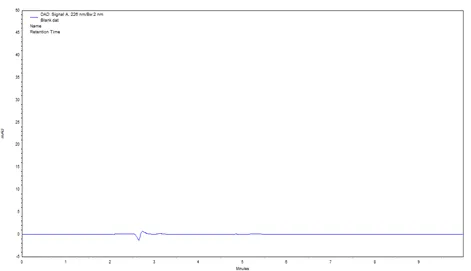
Figure No. 12 Chromatogram of Blank
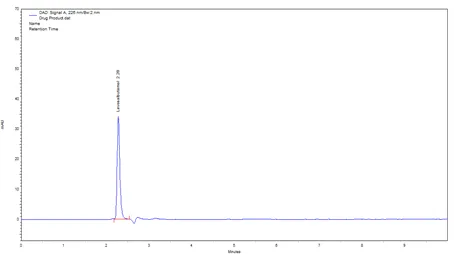
Figure No. 13 Chromatogram of Levosalbutamol
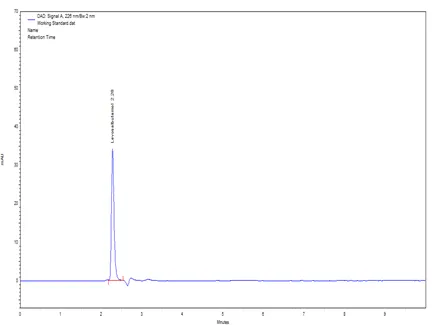
Figure No.14 Chromatogram of Standard
Data Interpretation
On the basis of these chromatograms, we can say that there is no interference of blank and placebo at the retention time of Levosalbutamol., No interference of Levosalbutamol in Levosalbutamol placebo at the retention time of Levosalbutamol. Hence the method is specific.
LOD and LOQ
Was calculated for both drugs by using ANOVA technique.
Formula:
Table No. 15 LOD and LOQ of Levosalbutamol
|
SUMMARY OUTPUT |
|
|
Regression Statistics |
|
|
Multiple R |
0.999959584 |
|
R Square |
0.99991917 |
|
Adjusted R Square |
0.999892227 |
|
Standard Error |
520.2354275 |
|
Observations |
5 |
|
ANOVA |
|
|
|
|
|
|
|
df |
SS |
MS |
F |
Significance F |
|
Regression |
1 |
10044145563 |
10044145563 |
37111.89667 |
3.08432E-07 |
|
Residual |
3 |
811934.7 |
270644.9 |
|
|
|
Total |
4 |
10044957497 |
|
|
|
|
|
Coefficients |
Standard Error |
t Stat |
P-value |
|
|
Intercept |
-492.4 |
1661.498715 |
-0.296358941 |
0.786287985 |
|
|
X Variable 1 |
63385 |
329.0257741 |
192.6444826 |
3.08432E-07 |
|
|
|
|
|
|
|
|
|
LOD & LOQ of Levosalbutamol |
LOD |
0.09 |
ug/ml |
||
|
LOQ |
0.26 |
ug/ml |
|||
The developed RP-HPLC method exhibited excellent sensitivity, with LOD and LOQ values of 0.09 µg/mL and 0.26 µg/mL, respectively, confirming its suitability for the detection and quantification of Levosalbutamol sulphate at low concentration levels. LOD and LOQ are indicators of method sensitivity and should not be interpreted as proof of method accuracy, precision, or overall reliability.
CONCLUSION
The present investigation successfully developed and validated UV spectrophotometric and RP-HPLC methods for the quantitative estimation of Levosalbutamol sulphate in pharmaceutical dosage forms. Both analytical methods exhibited excellent linearity, accuracy, precision, specificity, robustness, and sensitivity in accordance with ICH Q2(R2) guidelines. The RP-HPLC method provided efficient chromatographic separation with acceptable retention time and high theoretical plate count, while the UV spectrophotometric method proved to be simple, rapid, and economical for routine laboratory analysis. The low values of LOD and LOQ demonstrated the high sensitivity of the developed methods for detecting and quantifying small amounts of the drug. Overall, the validated analytical methods are reliable, reproducible, and suitable for routine quality control testing, assay determination, and regulatory analysis of Levosalbutamol sulphate in pharmaceutical formulations, thereby ensuring product quality, safety, and therapeutic efficacy.
REFERENCES

Rutuja Gangthade, Sagar Kale, Formulation, Development and Validation of UV Spectrophotometric and RP-HPLC Methods for Quantitative Estimation of Levosalbutamol Sulphate in Pharmaceutical Dosage Forms, Int. J. of Pharm. Sci., 2026, Vol 4, Issue 7, 2889-2905. https://doi.org/10.5281/zenodo.21363263
 10.5281/zenodo.21363263