

We use cookies to ensure our website works properly and to personalise your experience. Cookies policy
Sardar Patel College of Pharmacy, Bakrol, Anand, Gujarat, 388315 India.
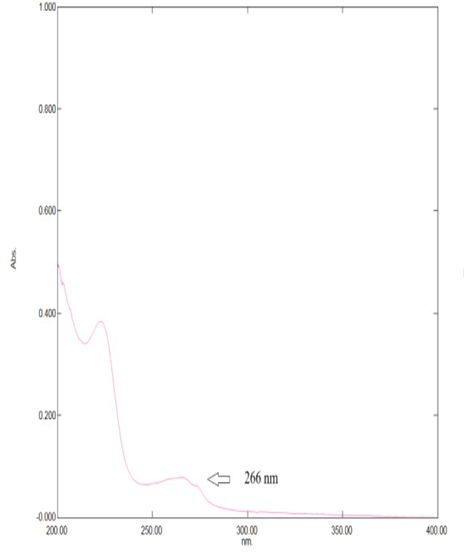
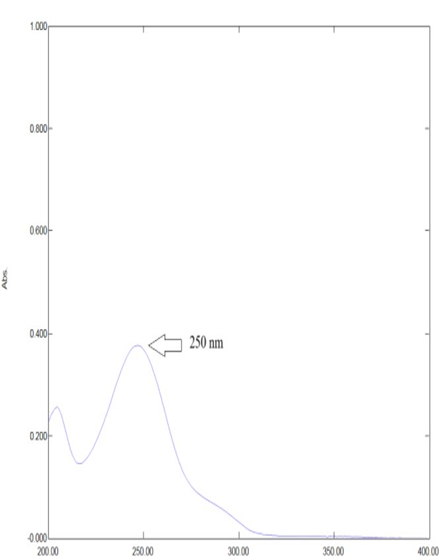
This research work aims to develop simple, accurate, and precise analytical methods for the simultaneous estimation of Nefopam Hydrochloride & Paracetamol, used for the treatment of pain killer. The calibration curve showed linearity as per line equation y=0.0171x+0.0616 with an R2 value of 0.9992 for Nefopam Hydrochloride and y=0.0132x+0.0839 with an R2 value of 0.9984 for Paracetamol. Absorption maximum was found to lie at about 266 nm and 250 nm for Nefopam Hydrochloride & Paracetamol respectively. Validation was performed as per ICH guidelines for Linearity and Precision, LOD & LOQ. The assay result was in a good arrangement with the label claim. The UV-Visible Spectroscopic method is rapid, cost effective, more precise, and accurate. This method can be useful since no analytical method was developed for Nefopam Hydrochloride & Paracetamol in combination.
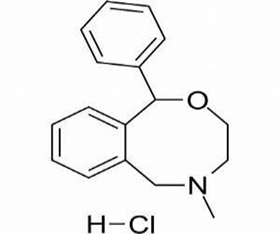
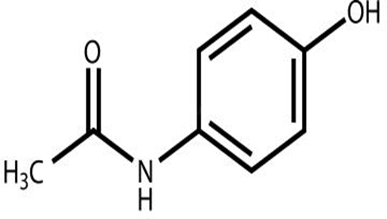
Analgesics are the painkiller substances, which act by the absence of pain without losing consciousness. Analgesic drug acts in various ways on peripheral and central nervous system; they include the non-steroidal anti-inflammatory and opioid analgesic. Nefopam Hydrochloride, (RS)-5 methyl-1-Phenyle-1,34,6-tetra hydro - 2,5-benzoxazocine (Fig:1), is in a Group of drugs Benzoxazocaine derivatives Nefopam is a non-opioid analgesic used for moderate to severe pain, especially post- surgical pain [1-3]. Paracetamol, N-(4-hydroxyphenyl) acetamide (Fig:2) is in a Group of drugs Para-aminophenol derivatives Paracetamol is a common painkiller used to treat aches and pain [4-5]. From the Exhaustive literature survey, have been developed for the estimation of Nefopam Hydrochloride alone Analysis of Nefopam Hydrochloride and Paracetamol by various methods like Nefopam Hydrochloride alone [6-13], Paracetamol alone [14-29], and in combination with other drug Spectroscopic methods viz. UV and Chromatographic methods viz. HPTLC, Liquid Chromatography, UPLC [30-44] .There are many methods available for individual and combination with other drugs but not any simultaneous estimation of analytical method has been reported for nefopam hydrochloride and paracetamol pharmaceutical dosage form.
|
|
|
|
Nefopam Hydrochloride [45] |
Paracetamol [46] |
Figure (1) & (2): Structural formula of Nefopam Hydrochloride and Paracetamol respectively
MATERIALS AND METHODS
Materials
Nefopam Hydrochloride, Paracetamol are gifted by Sardar Patel college of Pharmacy, Bakrol, respectively. All other chemicals used were of analytical reagent grade.
Instrumentation
UV Spectrophotometric method was performed on Shimadzu UV Visible double beam spectroscopy. UV Probe software was used for all absorbance measurements.
Preparation of Standard Stock Solution
Weighted Accurately 10 mg Nefopam Hydrochloride and transferred it into a 100 ml volumetric flask and dissolved with methanol and diluted up to the mark to obtain a standard stock solution (100 µg/ml).
Weighted Accurately 10 mg Paracetamol and transferred it into a 100 ml volumetric flask and dissolved with methanol and diluted up to the mark to obtain a standard stock solution (100 µg/ml).
An Aliquots of stock solution of Nefopam Hydrochloride (100 µg/ml) 1,2,3,4 and 5 ml was pipette in 5 different 10 ml volumetric flask and dilute up to the mark with methanol which will give 10, 20, 30, 40 and 50 ug/ml respectively. Absorbance of each solution was measured at 266 nm using methanol as blank. Graph of Absorbance vs. Concentration was plotted.
An Aliquots of stock solution of Paracetamol (100 µg/ml) 1,2,3,4 and 5 ml was pipette in 5 different 10 ml volumetric flask and dilute up to the mark with methanol which will give 10, 20, 30, 40 and 50 µg/ml respectively. Absorbance of each solution was measured at 250 nm using methanol as blank. Graph of Absorbance vs. Concentration was plotted.
Selection of wavelength detection
Nefopam Hydrochloride (10 µg/ml) and Paracetamol (10 µg/ml) were used for the detection of wavelength.
|
|
|
|
Fig:1 UV Spectrum of NFH (10 µg/ml) at 266 nm |
Fig:2 UV Spectrum of PCM (10µg/ml) at 250 nm |
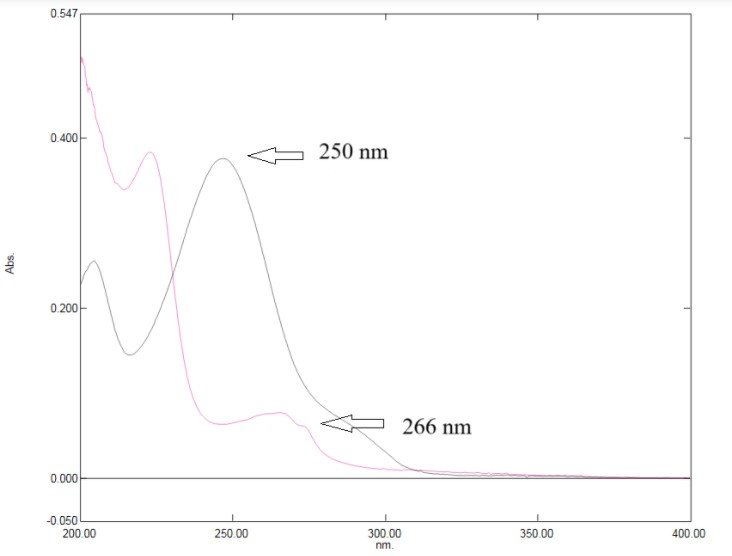
Fig:3 Overlain UV Spectra of Nefopam Hydrochloride and Paracetamol
Method Validation
The Methods were validated as per ICH guideline Q2(R2) [47]. The proposed method has been extensively validated in terms of Linearity and Range, Accuracy, Precision, Detection limit, Quantification limit.
Linearity and Range
The linearity of NFH and PCM was taken in the range of 10-50 µg/ml and respectively. Calibration curve of absorbance vs concentration was plotted and from that slop, intercept, correlation coefficient and regression line equation for NFH and PCM was constructed. Linearity data for NFH 266 nm and for PCM 250 nm are recorded. The drug’s linear regression equations were calculated after the calibration curve was organized showed in table:1&2.
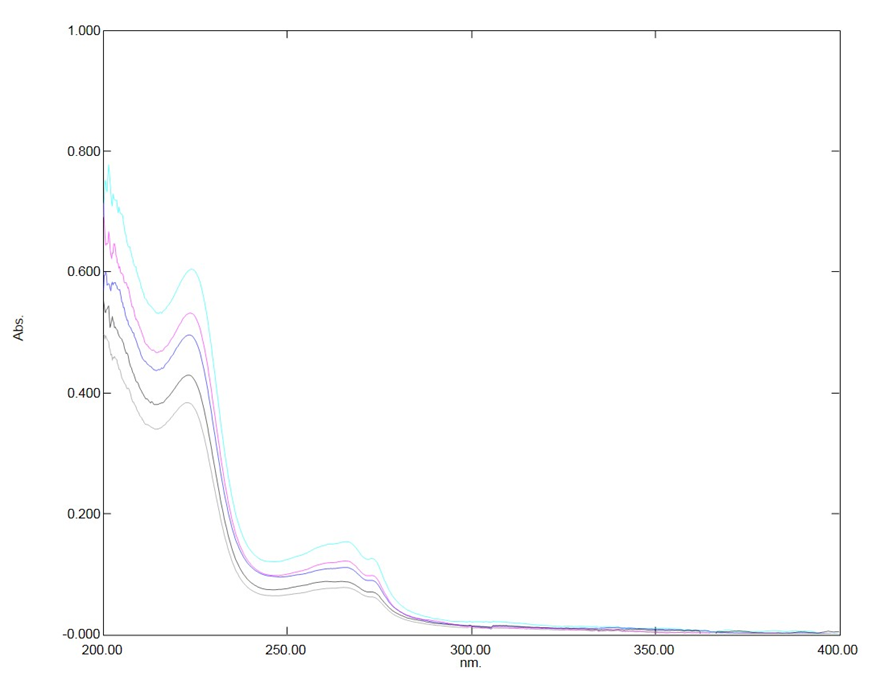
Fig:4 Overlain UV Spectra of Nefopam Hydrochloride (10-50 µg/ml) at 266 nm
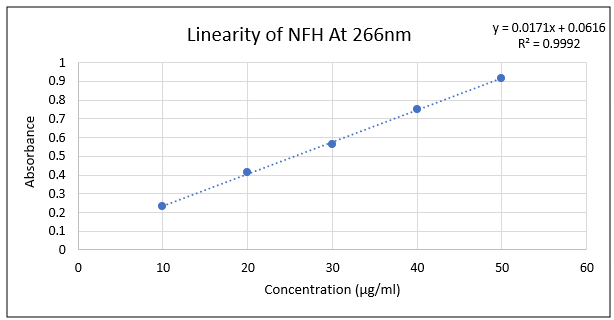
Fig:5 Calibration Curve of Nefopam Hydrochloride
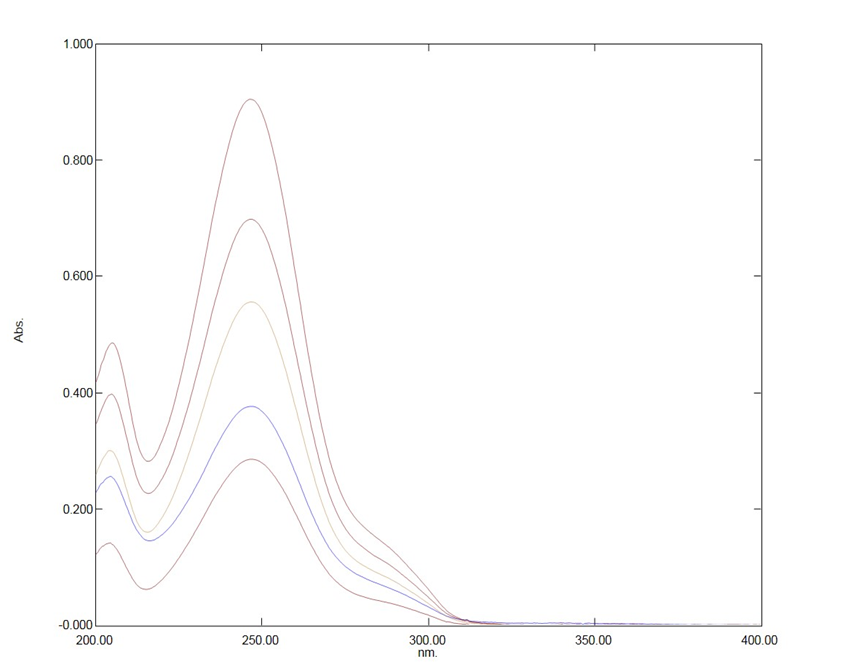
Fig:6 Overlain UV Spectra of Paracetamol (10-50 µg/ml) at 250 nm
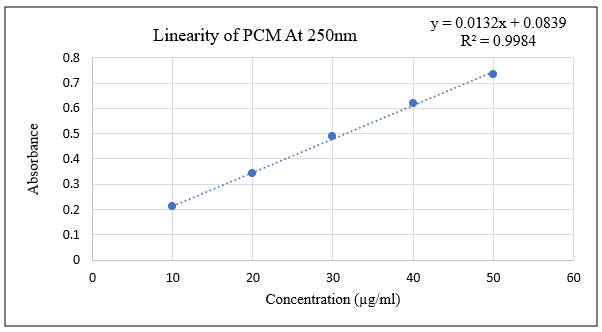
Fig:5 Calibration curve of Paracetamol
Accuracy
Recovery study of UV method was conducted as per ICH guideline to determine accuracy at three different concentration levels i.e., 80 %, 100 % and 120 %. This performance was done in triplicate. Accuracy was calculated in percentage of recovery by standard addition method.
Precision
The precision study of UV method were conducted at three levels like Intermediate (Intraday) Precision, Reproducibility (Interday Precision) and Repeatability. In Intraday Precision, solutions containing 5, 10, 15 μg/ml of Nefopam Hydrochloride and 5, 10, 15 μg/ml of Paracetamol were analyzed three times on the same day. In Interday Precision, solutions containing 5, 10, 15 μg/ml of Nefopam Hydrochloride and 5, 10, 15 μg/ml of Paracetamol were analyzed on three different successive days and in Repeatability, solutions containing 20 μg/ml of Nefopam Hydrochloride and 20 μg/ml of Paracetamol were analyzed for six times. All the results were expressed in % R.S.D.
Detection Limit (DL) and Quantification Limit (QL)
Detection limit and Quantification limit of UV method were calculated using following equation as per ICH guidelines.
LOD = 3.3 σ/s
LOQ= 10× σ/s
Assay of Marketed Formulation
For analysis of NFH and PCM in tablet dosage form, twenty tablets were accurately weighed and powdered. A quantity of accurately weighed tablet power equivalent to 30mg of nefopam hydrochloride and 325 mg of paracetamol was precisely weighed and powdered was transferred to 100 ml volumetric flask and shaken with addition of methanol sonicate for 15 min. Finally, volume made up by and filters the solution through Whatman paper & from this solution 0.5 ml transferred in to 10 ml volumetric flask and dilute up to the mark with the Methanol, to get concentration of 16.50 µg/ml of nefopam hydrochloride and 16.25 µg/ml of Paracetamol solution. The Sample was Scanned in ultra- violet range. The absorbance measured and amount was determined by equation of absorption correction Method.
A=abc
CX=A1/ax1×b
A2 = A NFH + A PCM
A2= (a2* CX*b) + (a3* Cy*b)
A2= (a2*CX) + (a3 * Cy)
Cy = [A2 – (a2 * CX)] / a3
Where,
A1 = Absorbance of sample solution at 266 nm
A2 = Absorbance of sample solution at 250 nm
a1 = Absorptivity of NFH at 266nm
a2 = Absorptivity of PCM at 250 nm
RESULTS AND DISCUSSION
(Table:1 Repeatability of NFH & PCM)
|
Sr. No. |
ABS of NFH & PCM (20 ppm) |
|
|
NFH |
PCM |
|
|
266 nm |
250 nm |
|
|
1 |
0.411 |
0.342 |
|
2 |
0.409 |
0.338 |
|
3 |
0.415 |
0.344 |
|
4 |
0.411 |
0.341 |
|
5 |
0.414 |
0.345 |
|
6 |
0.405 |
0.343 |
|
S.D |
0.41083 |
0.342167 |
|
Mean |
0.00363 |
0.002483 |
|
% RSD |
0.8839855 |
0.725751 |
(Table 2: Intraday & Interday of NFH)
|
|
Intraday |
Interday |
|||||
|
NFH |
Con (µg/ml) |
Mean Abs |
SD |
%RSD |
Mean Abs |
SD |
%RSD |
|
5 |
0.234 |
0.001 |
0.65 |
0.236 |
0.002 |
0.84 |
|
|
10 |
0.423 |
0.001 |
0.89 |
0.324 |
0.003 |
0.92 |
|
|
15 |
0.780 |
0.01 |
1.35 |
0.76 |
0.01 |
1.31 |
|
(Table 3: Intraday & Interday of PCM)
From the above results, good sensitivity has been achieved which reflects the high efficiency of the separation methods. The Intraday, Interday and Repeatability Precision of Nefopam Hydrochloride and Paracetamol were expressed in % RSD and indicated in acceptable limits. This result indicates that the method is precise and accurate. The precision data of Nefopam Hydrochloride and Paracetamol showed in table 1,2 and table 3, respectively.
(Table:4 %Recovery of NFH & PCM)
|
%Recovery of Nefopam and PCM |
||||||||
|
Assay %level |
Amount taken (ppm) |
Amount Added (ppm) |
Amt Recovered (ppm) |
%Mean Recovery S. D± (n=3) |
||||
|
|
NFH |
PCM |
NFH |
PCM |
NFH |
PCM |
NFH |
PCM |
|
80% |
16.5 |
16.25 |
13.20 |
13.00 |
29.30 |
29.20 |
99.35±1.37 |
99.82±1.38 |
|
100% |
16.5 |
16.25 |
16.5 |
16.25 |
32.63 |
32.3 |
100.4±1.36 |
99.38±1.36 |
|
120% |
16.5 |
16.25 |
19.80 |
19.50 |
35.7 |
35.3 |
99.34±1.45 |
98.74±1.34 |
The % recovery of Nefopam Hydrochloride and Paracetamol was found to be 99.35-99.34% and 99.82-99.74%, respectively (Table 4). The Detection and Quantitation limit of Nefopam Hydrochloride were found to be 0.473µg/ml and 0.124 µg/ml, respectively and for Paracetamol, Detection and Quantitation limit were found to be 0.115µg/ml and 0.379 µg/ml, respectively at 266 nm and 257nm which were within the acceptable limits. The % assay of Nefopam Hydrochloride and Paracetamol were found to be 99.52% and 99.97%, respectively.
CONCLUSION
The proposed method is simple, accurate, and precise. The developed method has been validated according to ICH guidelines, with satisfactory results. Using the proposed method showed good linearity for both NFH and PCM drugs in the 10–50 µg/ml concentration range, with Regression coefficients (R2) 0.9992 and (R2) 0.9984 for NFH and PCM at 266 nm and 250 nm, respectively. The results of the analysis are within a reasonable range of the drug's label claim and are highly reproducible. The results for both drugs indicated that the proposed method is specific for simultaneous estimation of NFH and PCM. The accuracy of the developed method is demonstrated by the results of a recovery study with a low SD value. The results on intraday and interday precision with low RSD values demonstrate the precision of the developed method. The assay results meet the acceptance criteria. Hence the developed method can be applied for routine analysis.
REFERENCES


Vishwa Patel*, Parekh Het, Parekh Rishi, Patel Saurav, Thakor Pragnesh, Suthar Sanjay, Development and Validation of UV-Spectrophotometric Method for Simultaneous Estimation of Nefopam Hydrochloride & Paracetamol in Pharmaceutical Dosage, Int. J. of Pharm. Sci., 2025, Vol 3, Issue 7, 2110-2120. https://doi.org/10.5281/zenodo.15957115
 10.5281/zenodo.15957115