

We use cookies to ensure our website works properly and to personalise your experience. Cookies policy
Department of Pharmaceutical Chemistry, Dr. Bapuji Salunkhe Institute of Pharmacy, Miraj, Maharashtra, Dr. Babasaheb Ambedkar Technological University, Lonere, Maharashtra, India. 416305.
Ibuprofen, a Biopharmaceutical Classification System Class II non-steroidal anti-inflammatory drug, has poor aqueous solubility that may restrict its dissolution and oral availability. The present study aimed to develop a green UV spectrophotometric method for Ibuprofen estimation and to investigate solubility enhancement using solid dispersion. Ethanol-water (50:50 v/v) was selected as a comparatively safer solvent system. Ibuprofen exhibited maximum absorption at 222 nm, and the calibration curve showed good linearity, with a regression coefficient of 0.9988. The method demonstrated satisfactory system precision, intra-day precision, inter-day precision, robustness against minor wavelength variation, and ruggedness between analysts. The limit of detection and limit of quantification were found to be 0.003019 ?g/ml and 0.009147 ?g/ml, respectively. Recovery results from the accuracy study were below the generally accepted range, suggesting that this parameter requires further optimization. Solid dispersion was prepared by the solvent evaporation method using sodium starch glycolate as carrier in a 1:2 drug-to-carrier ratio. The prepared solid dispersion showed higher absorbance during solubility testing than the marketed Ibuprofen tablet after 24 and 48 hours, indicating improved solubility behaviour. A green assessment score of 0.75 supported the environmentally favourable profile of the procedure. Overall, the study indicates that sodium starch glycolate-based solid dispersion and an ethanol-water solvent system may be useful for Ibuprofen solubility enhancement and analytical evaluation.
Ibuprofen is a non-steroidal anti-inflammatory drug widely used for the treatment of pain, inflammation, and fever. It belongs to the propionic acid derivatives class of NSAIDs. Ibuprofen is classified as a Biopharmaceutics Classification System Class II drug because it has low aqueous solubility and high permeability. Its poor aqueous solubility can reduce dissolution rate and may affect oral drug availability.
Table No. 1. Physicochemical properties of Ibuprofen
|
Sr. No. |
Parameter |
Description |
|
1 |
Chemical name |
2-(4-isobutylphenyl) propionic acid |
|
2 |
Molecular formula |
C13H18O2 |
|
3 |
Molecular weight |
206.28 g/mol |
|
4 |
Category |
NSAID |
|
5 |
BCS Class |
Class II |
|
6 |
Melting point |
75-78°C |
|
7 |
Solubility |
Poorly soluble in water |
|
8 |
Appearance |
White crystalline powder |
|
9 |
Taste |
Slightly bitter |
|
10 |
pKa |
4.4 |
|
11 |
Partition coefficient |
High lipophilicity |
Solid dispersion is an effective technique used to improve the solubility and dissolution rate of poorly water-soluble drugs. In this technique, the drug is dispersed in a hydrophilic carrier, which can improve wettability, reduce particle aggregation, increase surface area, and improve contact between the drug and dissolution medium. [1-6, 12, 15] Sodium starch glycolate was selected as the carrier in the present study because of its swelling property and ability to improve the wettability of poorly soluble drugs.
UV spectrophotometry is a simple, rapid, economical, and commonly used technique for estimation of drugs in pharmaceutical formulations. [7-9, 13, 14] Green analytical chemistry focuses on reducing the use of toxic solvents and minimizing environmental impact during analysis. Ethanol and water are comparatively safer, economical, and environmentally acceptable solvents. [10, 11] Therefore, ethanol: water in the ratio of 50:50 v/v was selected as a green solvent system for the estimation of Ibuprofen.
The present study was carried out to develop a UV spectrophotometric method for Ibuprofen using ethanol: water (50:50 v/v), validate selected analytical parameters, prepare ibuprofen solid dispersion using sodium starch glycolate by solvent evaporation method, and evaluate the solubility enhancement of the prepared formulation.
2. MATERIALS AND METHODS
Ibuprofen active pharmaceutical ingredient was used as the model drug. Sodium starch glycolate was used as the hydrophilic carrier for preparation of solid dispersion. Ethanol and distilled water were used for preparation of ethanol: water solvent system in the ratio of 50:50 v/v. Marketed ibuprofen tablets were used for comparative solubility study.
A UV-Visible spectrophotometer was used for absorbance measurement. Other instruments used were a sonicator, hot air oven, digital weighing balance, centrifuge, volumetric flasks, pipettes, glass rod, and other standard laboratory glassware.
The solubility of ibuprofen API was studied in distilled water, ethanol, and ethanol: water (50/50 v/v). An accurately weighed quantity of ibuprofen API was added to each solvent system and mixed properly. The solubility behaviour was observed, and ethanol: water (50/50 v/v) was selected for further analytical and formulation studies because it showed suitable solubility and supported green chemistry principles.
A standard solution of Ibuprofen was prepared using ethanol: water (50/50 v/v). The solution was scanned over the wavelength range of 200-400 nm using ethanol: water (50/50 v/v) as blank. The wavelength at which maximum absorbance was obtained was selected as the λmax for further analysis.
A standard stock solution of Ibuprofen was prepared in ethanol: water (50:50, v/v). Suitable dilutions were prepared to obtain concentrations of 3, 6, 9, 12, and 15 μg/ml. The absorbance of each solution was measured at 222nm. A calibration curve was plotted between concentration and absorbance, and the regression equation and coefficient of determination were calculated.
The developed UV spectrophotometric method was evaluated for linearity, accuracy, precision, robustness, ruggedness, limit of detection, and limit of quantification.
Linearity was evaluated using Ibuprofen concentrations of 3-15 μg/ml. Accuracy was evaluated by recovery study at 80%, 100%, 120% levels. System precision was determined by repeated measurement of Ibuprofen standard solution. Intra-day and inter-day precision were determined by analysing Ibuprofen solution at different concentrations within the same day and on different days, respectively.
Robustness was evaluated by making small changes in wavelength from 222 nm to 220 nm and 224 nm. Ruggedness was evaluated by performing the analysis using two different analysts. LOD and LOQ were calculated from the standard error and slope of the calibration curve. [8, 9]
Ibuprofen solid dispersion was prepared by solvent evaporation method using sodium starch glycolate as hydrophilic carrier in a drug-to-carrier ratio of 1:2. Accurately weighed Ibuprofen API and sodium starch glycolate were transferred into a clean beaker. Ethanol: water (50:50 v/v) solvent system was added to dissolve the drug and uniformly disperse the carrier.
The mixture was sonicated to obtain a homogeneous dispersion. The solvent was evaporated, and the obtained mass was dried in a hot air oven until complete removal of solvent. The dried mass was triturated gently, passed through sieve no. 44, and stored in an airtight container for further evaluation. [1-6]
An accurately weighed quantity of prepared solid dispersion equivalent to the required amount of Ibuprofen was transferred into a volumetric flask containing ethanol: water (50:50 v/v). The solution was sonicated to ensure dissolution. Suitable dilution was prepared, and absorbance was measured at 222 nm. Drug content was calculated using the calibration curve equation.
The solubility enhancement study was performed to compare Ibuprofen tablet powder and prepared Ibuprofen solid dispersion. Accurately weighed quantities of Ibuprofen tablet powder and solid dispersion were separately dispersed in the selected solvent system. The samples were kept for 24 and 48 hours. After equilibration, the samples were centrifuged, and the supernatant was collected. Suitable dilutions were prepared from the supernatant, and absorbance was measured at 222 nm using a UV-Visible spectrophotometer.
2.10 STATISTICAL ANALYSIS
The results were expressed as mean, standard deviation, and percentage relative standard deviation. The calibration curve was evaluated by linear regression analysis, and the coefficient of determination was calculated.
Table No.2. Solubility study of Ibuprofen API
|
Sr. No. |
Solvent System |
Observation |
Solubility |
|
1. |
Distilled Water |
Slightly soluble |
Low |
|
2. |
Ethanol |
Soluble |
High |
|
3. |
Ethanol: Water (50:50) |
Moderately soluble |
Suitable |
3. RESULTS AND DISCUSSION
Ibuprofen showed low solubility in distilled water and high solubility in ethanol. Ethanol: water (50:50 v/v) showed suitable solubility and was therefore selected for further analytical and formulation studies. The selected solvent system was also considered comparatively safer and suitable for a green analytical approach.
3.2 Green Chemistry
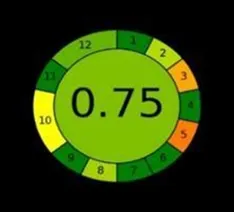
Fig No. 1. Green Chemistry Assessment of the Developed UV Spectrophotometric Method
The developed UV spectrophotometric method achieved a green chemistry score of 0.75 indicating good compliance with the principles of Green Analytical Chemistry. The use of an Ethanol: water (50:50 v/v) solvent system reduced the use of hazardous organic solvents and minimized environmental impact. The method required comparatively low solvent consumption, generated less hazardous waste, and involved simple analytical instrumentation with low energy requirements. These findings demonstrate that the developed method is environmentally friendly and suitable for routine pharmaceutical analysis while supporting sustainable analytical practices.
Table No. 3. Determination of λmax of Ibuprofen
|
Sr. No. |
Wavelength (nm) |
Absorbance |
|
1. |
222 nm |
0.573 |
The UV spectrum of Ibuprofen showed maximum absorbance at 222 nm in ethanol: water (50:50 v/v). Therefore, 222 nm was selected as the λmax for further analysis.
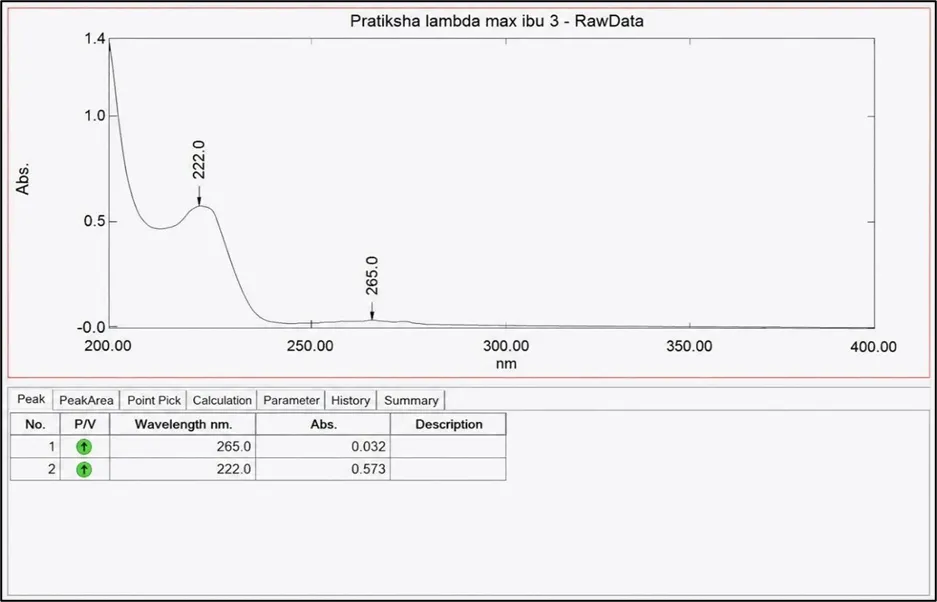
Fig. No. 2. Lambda max (λmax) of Ibuprofen
3.4 Calibration Curve and Linearity
The calibration curve of Ibuprofen showed a linear relationship between concentration and absorbance over the concentration range of 3-15 μg/ml.
Table No. 4. Calibration Curve of Ibuprofen
|
Sr. No. |
Concentration (μg/ml) |
Absorbance |
Mean |
Standard Deviation |
% Relative Standard Deviation |
|
1. |
1.1 μg/ml |
0.148 |
6.98 |
4.746788 |
0.680056 |
|
2. |
4.0 μg/ml |
0.351 |
|||
|
3. |
6.8 μg/ml |
0.548 |
|||
|
4. |
9.8 μg/ml |
0.757 |
|||
|
5. |
13.2 μg/ml |
0.992 |
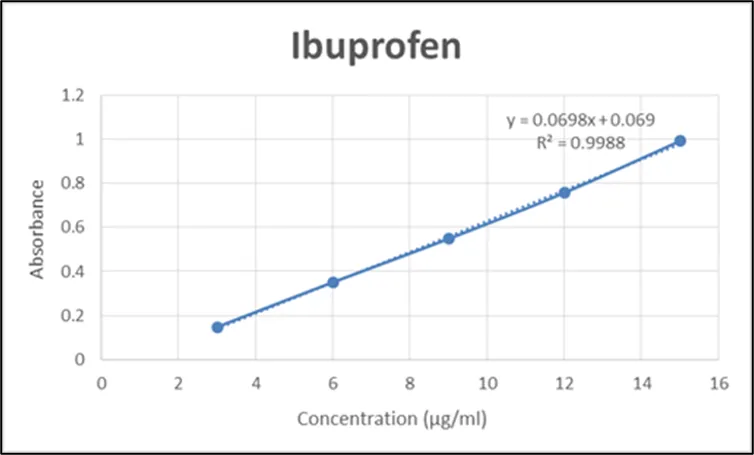
Fig. No. 3. Calibration Curve of Ibuprofen
The regression analysis showed coefficient of determination of 0.9988. The regression equation obtained was:
y = 0.0698x + 0.069
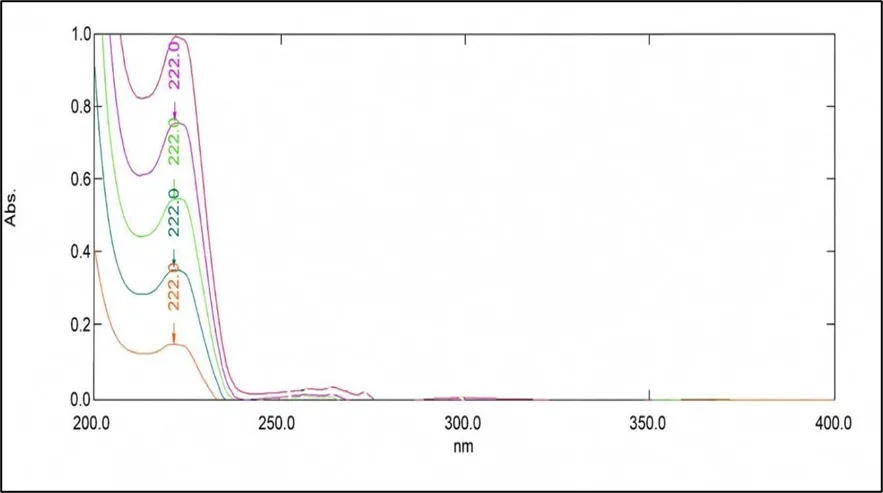
Fig No. 4. Overlay Graph of Calibration Curve
Table No. 5. Accuracy of Ibuprofen
|
Sr. No |
Level |
Sample μg/ml |
API μg/ml |
TTH μg/ml |
Abs. |
Conc. (μg/ml) |
Mean |
SD |
RSD |
% Recovery |
|
1 |
80% |
4.8 |
5 |
9.8 |
0.341 |
3.89 |
4.09 |
0.173205 |
0.042348 |
48.97% |
|
0.362 |
4.19 |
|||||||||
|
0.362 |
4.19 |
|||||||||
|
2 |
100% |
6 |
5 |
11 |
0.496 |
6.11 |
6.13 |
0.017321 |
0.002826 |
54.54% |
|
0.498 |
6.14 |
|||||||||
|
0.498 |
6.14 |
|||||||||
|
3 |
120% |
7.2 |
5 |
12.2 |
1.642 |
22.5 |
22.46 |
0.057735 |
0.00257 |
59.01% |
|
1.642 |
22.5 |
|||||||||
|
1.637 |
22.4 |
TTH- Total Theoretical Concentration, SD-Standard Deviation, RSD- Relative Standard Deviation.
The recovery study was performed at 80%, 100%, and 120% levels. The percentage recovery values obtained were 48.97%, 54.54%, and 59.01%, respectively. These values were below the commonly expected recovery range for an assay method. This finding suggests that the accuracy experiment requires further optimization, including verification of standard preparation, sample preparation, dilution factors, and calculation procedure.
3.6 Precision
3.6.1 System precision
Table No. 6. System Precision of Ibuprofen
|
Sr. No. |
Concentration (μg/ml) |
Absorbance |
Mean |
Standard Deviation (SD) |
% Relative Standard Deviation |
|
1. |
7.0 μg/ml |
0.564 |
7.1833 |
0.116905 |
0.016274 |
|
2. |
7.1 μg/ml |
0.565 |
|||
|
3. |
7.3 μg/ml |
0.580 |
|||
|
4. |
7.3 μg/ml |
0.580 |
|||
|
5. |
7.2 μg/ml |
0.575 |
|||
|
6. |
7.2 μg/ml |
0.574 |
Table No. 7. Method Precision of Ibuprofen (Intra Day)
|
Sr. No. |
Concentration (μg/ml) |
Absorbance |
Mean |
Standard Deviation |
% Relative Standard Deviation |
|
1. |
0.9 μg/ml |
0.137 |
0.966667 |
0.057735027 |
0.05972589 |
|
1.0 μg/ml |
0.140 |
||||
|
1.0 μg/ml |
0.140 |
||||
|
2. |
7.1μg/ml |
0.566 |
7.066667 |
0.057735027 |
0.008170051 |
|
7.1 μg/ml |
0.566 |
||||
|
7.0 μg/ml |
0.564 |
||||
|
3. |
13.27 μg/ml |
0.995 |
13.28 |
0.01 |
0.000753012 |
|
13.28 μg/ml |
0.996 |
||||
|
13.29 μg/ml |
0.997 |
Table No. 8. Method Precision of Ibuprofen (Inter Day)
|
Sr. No. |
Concentration (μg/ml) |
Absorbance |
Mean |
Standard Deviation |
% Relative Standard Deviation |
|
1. |
0.1μg/ml |
0.077 |
0.103333 |
0.005773503 |
0.055872607 |
|
0.1 μg/ml |
0.076 |
||||
|
0.1μg/ml |
0.076 |
||||
|
2. |
6.1 μg/ml |
0.495 |
6.12 |
0.034641016 |
0.005660297 |
|
6.1 μg/ml |
0.495 |
||||
|
6.1 μg/ml |
0.499 |
||||
|
3. |
12.13 μg/ml |
0.916 |
12.14667 |
0.037859389 |
0.003116854 |
|
12.12 μg/ml |
0.915 |
||||
|
12.19 μg/ml |
0.920 |
System precision, intra-day, and inter-day precision showed low variation in absorbance values. The low percentage relative standard deviation values indicated good repeatability and reproducibility of the developed UV spectrophotometric method.
Table No. 9. Robustness of Ibuprofen
|
Sr. No. |
Wavelength (nm) |
Conc. |
Absorbance |
Mean |
Standard Deviation |
% Relative Standard Deviation |
|
1. |
220 nm |
5.71 μg/ml |
0.468 |
5.743333 |
0.030550505 |
0.005319299 |
|
5.77 μg/ml |
0.472 |
|||||
|
5.75 μg/ml |
0.471 |
|||||
|
2. |
222 nm |
6.07 μg/ml |
0.493 |
6.093333 |
0.02081666 |
0.003416301 |
|
6.11 μg/ml |
0.496 |
|||||
|
6.10 μg/ml |
0.495 |
|||||
|
3. |
224 nm |
6.01 μg/ml |
0.489 |
6.036667 |
0.025166115 |
0.004168876 |
|
6.06 μg/ml |
0.492 |
|||||
|
6.04 μg/ml |
0.491 |
The method was evaluated at wavelengths of 220 nm, 222 nm, and 224 nm. The absorbance values showed low variation at all wavelengths, indicating that minor wavelength changes did not significantly affect the method.
Table No. 10. Ruggedness of Ibuprofen
|
Sr. No. |
Analyst |
Conc. |
Absorbance |
Mean |
Standard Deviation |
% Relative Standard Deviation |
|
1. |
Analyst 1 |
5.77 μg/ml |
0.472 |
5.773333 |
0.005773503 |
0.001000029 |
|
5.78 μg/ml |
0.473 |
|||||
|
5.77 μg/ml |
0.472 |
|||||
|
2. |
Analyst 2 |
5.88 μg/ml |
0.480 |
5.906667 |
0.030550505 |
0.005172207 |
|
5.90 μg/ml |
0.481 |
|||||
|
5.94 μg/ml |
0.484 |
The method was performed by two analysts. The results showed low variation between analysts, indicating that the method was not significantly affected by analyst-to-analyst variation.
Table No.11. LOD and LOQ
|
Sr. No |
Parameter |
Value |
|
|
LOD |
0.003019 |
|
|
LOQ |
0.009147 |
The LOD and LOQ values were found to be 0.003019 and 0.009147, respectively. The low values indicate that the developed UV spectrophotometric method is sufficiently sensitive for the detection and quantification of Ibuprofen at low concentrations.
Table No. 12. Preparation of Solid Dispersion of Ibuprofen
|
Sr. No. |
Formulation |
Drug: Carrier ratio |
|
1. |
F1 (Ibuprofen API: Sodium Starch Glycolate) |
1:2 |
Ibuprofen solid dispersion was prepared successfully by solvent evaporation method using sodium starch glycolate as hydrophilic carrier in a 1:2 drug-to-carrier ratio. The prepared formulation appeared uniform and free flowing.
Table No. 13. Drug Content Analysis of Ibuprofen
|
Sr. No. |
Parameter |
Result |
|
|
Drug Content |
72.33% |
The prepared solid dispersion showed a drug content of 72.33%. The result indicates that further optimization of the preparation method may be required to improve drug incorporation and minimize drug loss during solvent evaporation and drying.
Table No. 14. Solubility Enhancement of Ibuprofen
|
Sr. No. |
Time (Hours) |
Sample |
Absorbance |
Solubility |
|
1. |
24 hours |
Ibuprofen Tablet |
0.267 |
Low |
|
Ibuprofen Solid Dispersion |
0.792 |
High |
||
|
2. |
48 hours |
Ibuprofen Tablet |
0.298 |
Low |
|
Ibuprofen Solid Dispersion |
0.839 |
High |
The solubility study showed that the Ibuprofen solid dispersion had higher absorbance than Ibuprofen tablet powder after 24 hours and 48 hours. At 24 hours, the solid dispersion show an absorbance of 0.792 compared with 0.267 for tablet powder. At 48 hours, the solid dispersion showed an absorbance of 0.839 compared with 0.298 for tablet powder. These findings indicate improved solubility of Ibuprofen in the prepared solid dispersion.
The enhanced solubility may be due to improved wettability, reduced aggregation of drug particles, and increased surface area of Ibuprofen in the presence of sodium starch glycolate. The hydrophilic carrier may have helped the drug particles to disperse more effectively in the solvent system.
4. CONCLUSION
A green UV spectrophotometric method was developed for estimation of Ibuprofen using ethanol: water (50:50, v/v) as solvent system. Ibuprofen showed maximum absorbance at 222 nm, and the method was linear in the concentration range of 3-15 μg/ml with an R2 value of 0.9988. The method showed acceptable precision, robustness, ruggedness, LOD, and LOQ under the studied conditions. Ibuprofen solid dispersion prepared using sodium starch glycolate in a 1:2 drug-to-carrier ratio showed improved solubility compared with ibuprofen tablet powder.
The accuracy and drug-content findings indicate that further optimization of sample preparation, dilution, and calculation procedures is required before the method can be claimed as fully validated for routine quality-control analysis. However, the study demonstrated the potential of solid dispersion technology and ethanol: water (50:50, v/v) solvent system for improving the solubility and analytical estimation of ibuprofen
REFERENCES



Pratiksha Jadhav, Aditi Awati, Sakib Ilai Shaikh, Development, Validation & Applications of Green UV Method for the Estimation of Ibuprofen in Solid Dispersion, Int. J. of Pharm. Sci., 2026, Vol 4, Issue 8, 4393-4402. https://doi.org/10.5281/zenodo.22119981
 10.5281/zenodo.22119981