

We use cookies to ensure our website works properly and to personalise your experience. Cookies policy
Department of Pharmacy Practice, Progressive Education Society’s Modern College of Pharmacy, Nigdi, Pune-411044, Maharashtra, India.
Brugada syndrome is a cardiac channelopathy in which certain medications can unmask the characteristic electrocardiographic phenotype and precipitate malignant ventricular arrhythmias. BrugadaDrugs.org provides expert classifications separating implicated medications into RED (contraindicated or best avoided) and ORANGE (preferably avoided) categories. Whether these expert-defined categories correspond to real-world spontaneous reporting patterns in large postmarketing databases has not been systematically evaluated. This study performed a retrospective case/non-case disproportionality analysis of reports from the US FDA Adverse Event Reporting System (FAERS) submitted from Q1 2021 through Q4 2025. Reports were deduplicated by case identifier, and Brugada syndrome was identified using the MedDRA Preferred Term “Brugada syndrome”. Exposure to RED or ORANGE drugs included medications recorded as primary or secondary suspects; the categories were not mutually exclusive. Reporting odds ratios (RORs) with 95% confidence intervals (CIs) were calculated, with Benjamini–Hochberg false discovery rate correction applied to individual-drug analyses, and only drugs with at least three exposed Brugada syndrome cases were retained. Sensitivity analyses examined primary-suspect exposure and stratification by sex and age. Multivariable logistic regression adjusted for age, sex, and number of suspect drugs using complete-case analysis (n = 4,399,497). The deduplicated dataset contained 7,660,722 FAERS cases, including 406 reports of Brugada syndrome. RED exposure was recorded in 106 Brugada cases (ROR 73.54, 95% CI 58.91–91.79); ORANGE exposure was recorded in 153 cases (ROR 28.24, 95% CI 23.10–34.52). Adjusted ORs were 104.12 (95% CI 79.23–136.83) for RED and 23.11 (95% CI 18.23–29.30) for ORANGE.
Brugada syndrome is an inherited cardiac channelopathy characterized by ST-segment elevation in the right precordial leads and an increased susceptibility to ventricular arrhythmias and sudden cardiac death.[1,2] It is usually recognized in adulthood, occurs more often in men, and has a relatively high prevalence in Southeast Asian populations.[1] Genetic predisposition plays an important role, particularly through loss-of-function variants in SCN5A, but medication exposure can also bring out the characteristic electrocardiographic phenotype in susceptible individuals.[3,4]
Sodium channel blockade is one of the best-recognized mechanisms by which drugs can unmask Brugada-pattern electrocardiographic changes and, in vulnerable patients, contribute to malignant ventricular arrhythmias.[5] Reports of drug-related or drug-unmasked Brugada phenotypes involve antiarrhythmic drugs as well as psychotropic and other non-cardiac medications.[6,7] From a clinical perspective, this is important because medication exposure is potentially modifiable, and recognizing drugs that may aggravate the phenotype can help reduce avoidable risk in patients with known or suspected Brugada syndrome.[8]
BrugadaDrugs.org provides regularly updated expert guidance on medications that may be hazardous in Brugada syndrome.[7] Its classification separates medications into RED drugs (contraindicated or best avoided) and ORANGE drugs (preferably avoided). These categories are used as a practical reference when prescribing for patients with Brugada syndrome.[8] However, much of the evidence underpinning such recommendations comes from case reports, small case series, and mechanistic studies rather than systematic analyses of large postmarketing databases.[5] Because the BrugadaDrugs.org classification draws in part on published case reports, some of which may themselves have generated FAERS reports, any concordance observed in spontaneous reporting cannot be considered fully independent validation of clinical risk.
It therefore remains useful to ask whether the expert classification is reflected in routine postmarketing reporting. If the classification corresponds to the strength of the observed drug-related signal, RED medications would be expected to show greater disproportionate reporting than ORANGE medications. Disproportionality methods[9–11] applied to FAERS, a large spontaneous-reporting database,[12] allow this question to be examined at both category and individual-drug levels. Importantly, disproportionality analysis identifies unusual reporting patterns; it does not establish causality or provide an estimate of absolute risk.[11]
The purpose of this study was not to re-establish the already recognized association between Brugada syndrome and classic sodium channel-blocking antiarrhythmic agents. Rather, we sought to determine whether the expert-defined drug hierarchy corresponded to reporting patterns in a large postmarketing dataset, quantify the difference between RED and ORANGE exposure, and identify less expected signals among non-cardiac medications. The primary objective was to compare disproportionate reporting of Brugada syndrome between RED and ORANGE medication categories in FAERS reports from 2021 through 2025; secondary objectives were to identify individual-drug signals and to examine the consistency of the findings by suspect role, age, and sex. To assess robustness, we performed primary-suspect sensitivity analyses, age- and sex-stratified analyses, multivariable adjustment, comparator analyses, and a direct comparison of mutually exclusive RED and ORANGE exposure.
MATERIALS AND METHODS:
Study design and reporting guidelines: This was a retrospective case/non-case disproportionality study using publicly available FAERS data. The study population consisted of all unique FAERS cases reported during the study period. Cases were reports containing the outcome of interest, Brugada syndrome; all other reports were non-cases. The study is reported in accordance with the STROBE statement and the RECORD extension for routinely collected health data.[13,14]
Data source: We used publicly available FAERS quarterly ASCII data files covering Q1 2021 through Q4 2025 (20 quarters), downloaded on September 10, 2026. FAERS is maintained by the US Food and Drug Administration (FDA) and contains spontaneous adverse-event reports submitted from the United States and other countries.[15] The demographic (DEMO), drug (DRUG), and reaction (REAC) tables were used. The outcome (OUTC), therapy (THER), and indication (INDI) tables were not analyzed because the analysis focused on disproportionality at the case level and did not include time-to-onset or outcome analyses.
Case definition: A report was classified as a Brugada syndrome case when the reaction field contained the MedDRA Preferred Term (PT) “Brugada syndrome”. The reaction field was searched for all terms containing “Brugada”; only the PT “Brugada syndrome” was identified. The specific MedDRA version used in each quarterly file could not be confirmed from the ASCII files; however, the PT “Brugada syndrome” is a long-standing MedDRA term and the string is stable across recent versions. A single PT was used because it provides clinical specificity and can be directly identified in the spontaneous-reporting data.
Deduplication: The quarterly FAERS files were pooled before deduplication. Within each case identifier (caseid), records were ordered by descending primary identifier (primaryid), and the most recent submission was retained, so that follow-up submissions were represented by a single case. Because the FAERS primaryid is formed from the case identifier and the case version number, retaining the highest primaryid within each caseid is equivalent to retaining the latest case version. Drug and reaction records were linked to retained reports through the case identifier. Because FAERS does not provide a unique patient identifier, duplicate reports of the same event submitted under different case identifiers cannot be separately identified and may therefore remain in the analysis. The flow of reports from deduplication to the exposure groups is shown in Figure 1.
Drug exposure and expert classification: Drug risk categories were obtained from BrugadaDrugs.org, accessed on October 11, 2026.[7] RED drugs were defined as medications considered contraindicated or best avoided in Brugada syndrome, and ORANGE drugs as medications preferably avoided. The analysis covered the complete RED (n = 18) and ORANGE (n = 27) drug substance lists as published on BrugadaDrugs.org on that date (Supplementary Table S1). A dated copy of the lists used for analysis is preserved in the Supplementary Material.
Two binary case-level exposure variables were generated: any RED exposure and any ORANGE exposure. A drug counted as an exposure when its FAERS role code was primary suspect (PS) or secondary suspect (SS); drugs recorded as concomitant (C) or interacting (I) were treated as unexposed. Because the two categories were not mutually exclusive, a report could contain drugs from both groups. In the analysis of each category, the reference group comprised all other deduplicated reports, including reports exposed to the other category. A separate sensitivity analysis restricted exposure to drugs with the primary-suspect role.
Drug name normalization and mapping dictionary: Drug names were standardized before assignment to the BrugadaDrugs.org categories. Names were converted to uppercase, punctuation was removed, and common salt forms (hydrochloride, sulfate, maleate) were removed to isolate the active ingredient. Recognizable brand names were mapped to their generic ingredients when identifiable. Only the drugname field was used. The normalized names were matched against the RED and ORANGE lists using exact string matching after standardization. To make the mapping reproducible, a mapping dictionary listing, for each normalized FAERS drug string matched to a BrugadaDrugs.org substance, the original FAERS drug name, the normalized ingredient, the assigned category, and the mapping rationale is available from the corresponding author. Combination products and ambiguous entries were reviewed manually; a FAERS drug was classified as belonging to a category only when the normalized ingredient could be unambiguously assigned.
Descriptive analysis: Report characteristics were summarized using counts and percentages for categorical variables. Sex was classified as male, female, or unknown. Age was converted to years where the age unit was recorded.
Disproportionality analysis: The reporting odds ratio (ROR) was the primary disproportionality measure. For each exposure category, a 2×2 contingency table was constructed according to exposure status and Brugada syndrome reporting status. The ROR was calculated as (a × d) / (b × c), where a = reports containing both the exposure and Brugada syndrome; b = reports containing the exposure without Brugada syndrome; c = reports containing Brugada syndrome without the exposure; and d = reports containing neither. The 95% CI was calculated from the standard error of the natural logarithm of the ROR: SE = √(1/a + 1/b + 1/c + 1/d), and 95% CI = exp [ln (ROR) ± 1.96 × SE]. A lower 95% CI bound above 1.0 was considered indicative of a statistically significant signal. For individual drugs, at least three exposed Brugada syndrome cases were additionally required. This threshold was applied before individual-drug RORs were calculated and before FDR correction. An ROR represents disproportionate reporting and should not be interpreted as an incidence measure or an estimate of absolute clinical risk.[11] The principles and limitations of the case/non-case approach have been described previously.[16]
Multiple-testing adjustment: For individual-drug analyses, the Benjamini–Hochberg procedure was used to control the false discovery rate (FDR).[17] A q-value below 0.05 was considered statistically significant after correction. The correction was applied to the 21 drugs meeting the prespecified minimum case threshold, and q-values for each drug are provided in Supplementary Table S2.
Adjusted analysis: Separate multivariable logistic regression models were fitted for RED and ORANGE exposure, with Brugada syndrome reporting as the dependent variable. The primary models included sex, age (continuous, years), and the number of distinct suspect drugs per case as a proxy for polypharmacy. Models were fitted using complete-case analysis; observations with missing age were excluded. The models were run on 4,399,497 observations after deletion of 3,261,225 observations (42.6%) with missing age. The resulting adjusted odds ratios describe relative odds of Brugada syndrome reporting in FAERS; they are not clinical risk estimates. The adjusted ORs exceeded the crude RORs for RED exposure and were lower than the crude RORs for ORANGE exposure; this pattern is most plausibly explained by negative confounding by age and number of suspect drugs for RED, and by the different reference compositions between categories. Adjusted estimates should therefore be interpreted alongside the crude values.
Direct comparison of RED and ORANGE exposure: To compare the two categories directly, we restricted the analysis to reports exposed to either RED or ORANGE drugs but not both; reports with exposure to both categories were excluded (13,431 reports, including 34 Brugada syndrome cases). After applying these exclusions, the eligible analytic sample for this direct comparison comprised 170,617 reports (23,304 RED-only and 147,313 ORANGE-only), which included 72 RED-only and 119 ORANGE-only Brugada syndrome cases. A logistic regression model was fitted with RED-only exposure as the primary predictor and ORANGE-only exposure as reference, adjusting for sex, age, and number of suspect drugs. The model equation was: logit (P (Brugada)) = β₀ + β₁(RED-only) + β₂(sex) + β₃(age) + β₄(number of suspect drugs).
Sensitivity and stratified analyses: In the primary-suspect-only analysis, exposure was restricted to drugs with the primary-suspect role. In the sex-stratified analysis, RORs were calculated separately for male and female reports with known sex. Interaction terms between sex and RED or ORANGE exposure were added to the logistic regression models adjusting for age and number of suspect drugs, and the p-value for the interaction coefficient is reported. Sex-specific RORs are descriptive and are not the same quantity as the interaction test. In the age-stratified analysis, RORs were estimated within three age groups (<40, 40–60, and >60 years) among reports with known age.
Comparator drugs: Comparator medications were selected from outside the RED and ORANGE lists and were not considered established sodium channel blockers: metformin, omeprazole, and amlodipine, which are commonly prescribed in the general population. Exposure for comparators was defined using the same primary- or secondary-suspect criteria as the main analysis. Levothyroxine was considered initially but was excluded because no primary-suspect Brugada syndrome cases were identified, which precluded the primary-suspect sensitivity comparison; this exclusion was made after the data were examined and is not a prespecified choice. The comparators are treated as exploratory benchmarks for background reporting intensity; they are not exchangeable with RED or ORANGE medications in indication, patient characteristics, or reporting patterns, and they do not establish specificity of the category estimates.
Individual-drug analysis: Drug-level RORs were calculated separately for RED and ORANGE medications. To avoid unstable estimates based on very small cell counts, only drugs associated with at least three exposed Brugada syndrome cases were included. The four cells (a, b, c, d), the exact exposed case count, the exposed non-case count, the unexposed case count, the ROR, the 95% CI, and the FDR-adjusted q-value are provided for every tested drug in Supplementary Table S2. Median RORs of the tested drugs were compared descriptively between the two categories; no formal test was performed.
Software: All analyses were performed in R version 4.4.2 (R Foundation for Statistical Computing, Vienna, Austria) using the data.table package (version 1.18.2.1) and the glm function in base R.
Ethical considerations:
The study used publicly available, de-identified FAERS data. No identifiable patient-level information was accessed. Under the applicable institutional policy, institutional review board review was not required; no formal exemption determination was obtained, and no committee name or reference number applies.
RESULTS:
FAERS dataset and case identification: The deduplicated FAERS dataset for Q1 2021 through Q4 2025 contained 7,660,722 unique cases (Figure 1). Of these, 406 reports included the MedDRA Preferred Term for Brugada syndrome, representing approximately 0.005% of the total dataset. Among the 406 Brugada syndrome reports, 219 (53.9%) involved males, 127 (31.3%) involved females, and 60 (14.8%) had unknown sex. Age was missing in 3,261,225 deduplicated reports (42.6%). The RED and ORANGE categories were not mutually exclusive: 13,431 reports were exposed to both categories, including 34 Brugada syndrome cases.
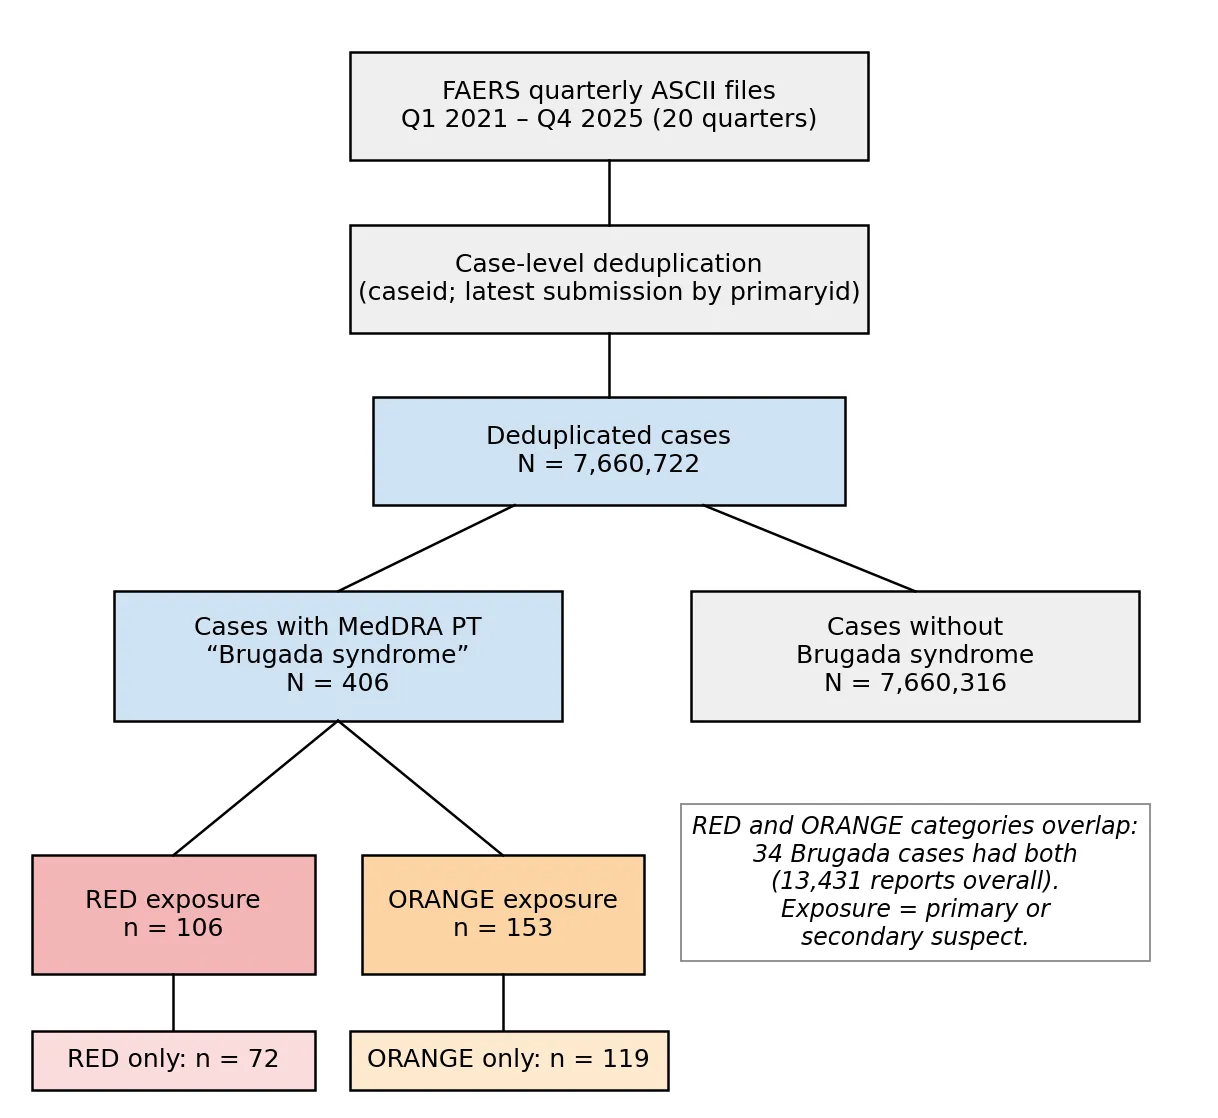
Figure 1: Study Flow Diagram Showing FAERS Files (Q1 2021–Q4 2025), Deduplicated Cases (N = 7,660,722), Brugada Syndrome Cases (N = 406), and Red (N = 106) and ORANGE (N = 153) Exposure. the Categories Overlap (34 Cases Had Both).
Overall disproportionality: RED exposure was identified in 106 of 406 Brugada syndrome cases (26.1%). The corresponding ROR was 73.54 (95% CI 58.91–91.79) (Table 1; Figure 2). ORANGE exposure was identified in 153 cases (37.7%), with an ROR of 28.24 (95% CI 23.10–34.52) (Table 1). Both categories therefore showed substantial disproportionate reporting of Brugada syndrome, although the crude signal was greater for RED medications.
Table 1: Overall Disproportionality and Adjusted Results for Red and ORANGE Medication Categories.
| Category | Exposed cases (a) | Exposed non-cases (b) | Unexposed cases (c) | Unexposed non-cases (d) | ROR (95% CI) | Adjusted OR (95% CI)ᵃ |
|---|---|---|---|---|---|---|
| RED | 106 | 36,629 | 300 | 7,623,687 | 73.54 (58.91–91.79) | 104.12 (79.23–136.83) |
| ORANGE | 153 | 160,591 | 253 | 7,499,725 | 28.24 (23.10–34.52) | 23.11 (18.23–29.30) |
CI, confidence interval; OR, odds ratio; ROR, reporting odds ratio. Deduplicated reports, n = 7,660,722; Brugada syndrome reports, n = 406. Exposure = primary or secondary suspect drug. The categories are not mutually exclusive. ᵃAdjusted for sex, age, and number of suspect drugs. Complete-case analysis (n = 4,399,497).
Primary-suspect sensitivity analysis: When exposure was restricted to primary-suspect drugs, the RED ROR increased to 130.33 (95% CI 98.43–172.57). The ORANGE ROR also increased, reaching 39.14 (95% CI 31.83–48.14) (Table 2). The persistence, and particularly the increase, in disproportionality under the primary-suspect definition suggests that the overall findings were not driven solely by secondary-suspect assignments.
Age-stratified findings: The magnitude of the RED signal increased with age. The ROR was 23.80 (95% CI 16.60–34.11) among reports involving patients younger than 40 years, 71.81 (95% CI 48.54–106.25) in the 40–60-year group, and 173.48 (95% CI 97.70–308.05) among those older than 60 years. The ORANGE category showed no consistent age trend, with RORs of 14.80 (95% CI 11.08–19.75), 12.67 (95% CI 8.30–19.34), and 34.29 (95% CI 19.11–61.52) across the three age groups, respectively (Table 2).
Sex-stratified findings: The RED category did not differ materially by sex. Among reports with known sex, the male-specific ROR was 80.10 (95% CI 59.67–107.53) compared with 71.91 (95% CI 48.36–106.94) among females; the sex-by-RED interaction was not statistically significant (p = 0.842). The ORANGE category showed a different pattern: the male-specific ROR was 17.73 (95% CI 13.19–23.83), whereas the female-specific ROR was 47.33 (95% CI 33.42–67.03). A sex-by-ORANGE interaction was observed in the adjusted reporting model (interaction p = 1.66 × 10⁻⁵) (Table 2; Figure 3). This finding is hypothesis-generating and should not be interpreted as evidence of a sex-specific pharmacologic effect; differences in indication, prescribing, co-medication, and reporting behavior across the drug category may explain the pattern.
Table 2: Sensitivity and Stratified Analyses (Reporting Odds Ratios).
| Analysis | RED, ROR (95% CI) | ORANGE, ROR (95% CI) |
|---|---|---|
| All suspects | 73.54 (58.91–91.79) | 28.24 (23.10–34.52) |
| Primary suspect only | 130.33 (98.43–172.57) | 39.14 (31.83–48.14) |
| Male reports | 80.10 (59.67–107.53) | 17.73 (13.19–23.83) |
| Female reports | 71.91 (48.36–106.94) | 47.33 (33.42–67.03) |
| Age <40 years | 23.80 (16.60–34.11) | 14.80 (11.08–19.75) |
| Age 40–60 years | 71.81 (48.54–106.25) | 12.67 (8.30–19.34) |
| Age >60 years | 173.48 (97.70–308.05) | 34.29 (19.11–61.52) |
| Sex-by-category interaction, p | 0.842 | 1.66 × 10⁻⁵ |
CI, confidence interval; ROR, reporting odds ratio. Sex-stratified estimates are restricted to reports with known sex, and age-stratified estimates to reports with known age.
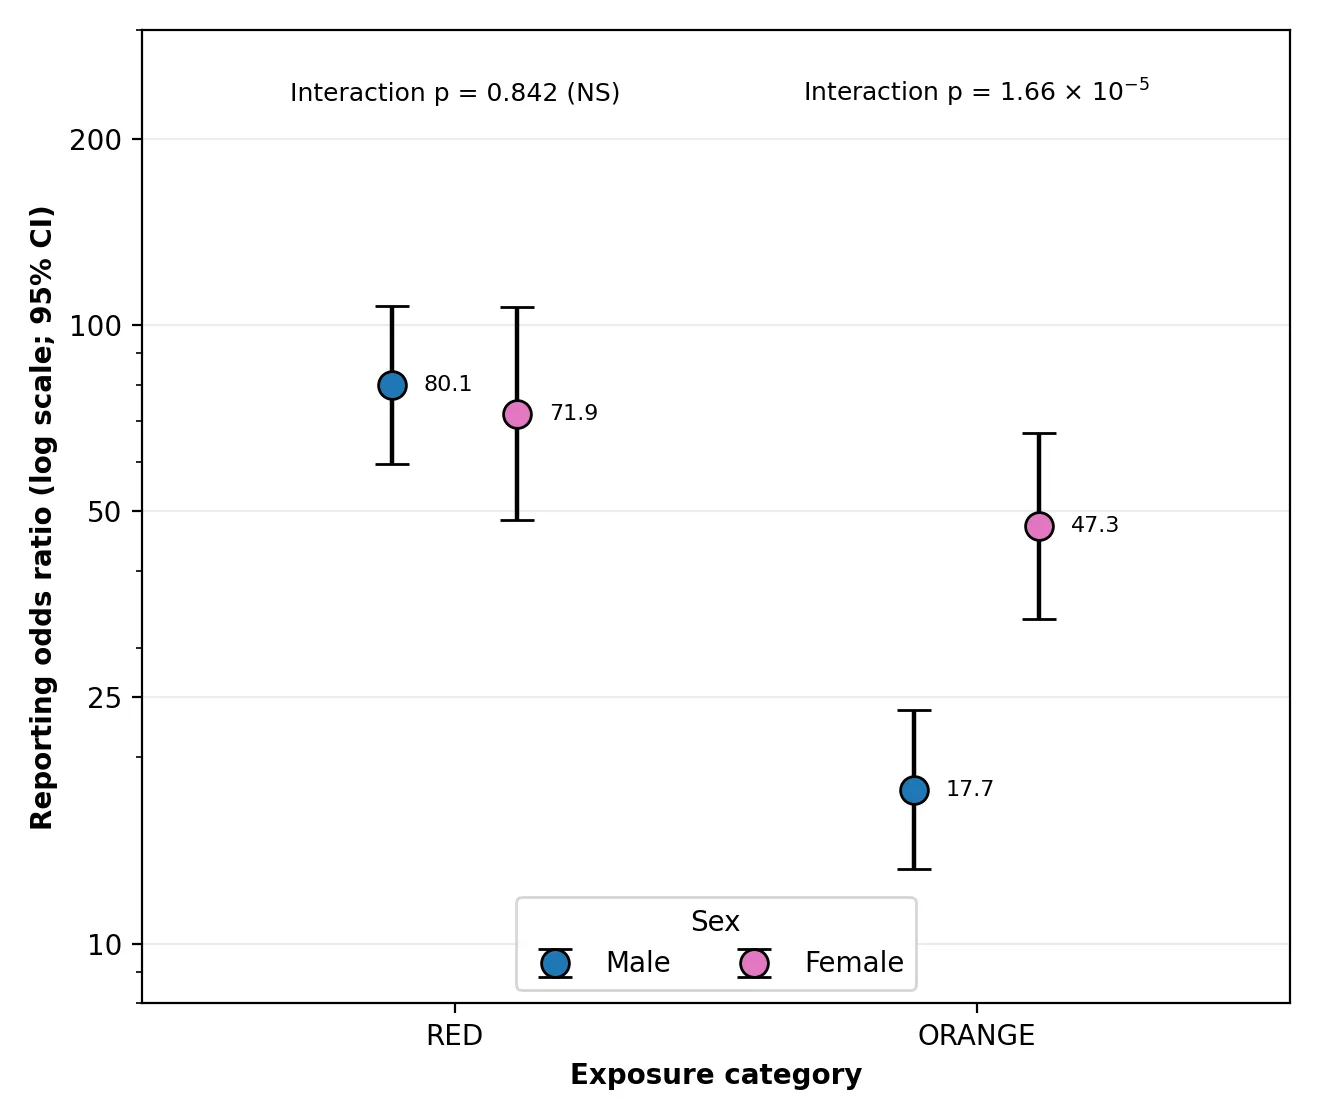
Figure 3: Sex-stratified Reporting Odds Ratios (ROR) with 95% Confidence Intervals for the Red and ORANGE Medication Categories. P Values Are for the Sex-By-Exposure Interaction.
Adjusted analysis: Adjustment for sex, age, and the number of suspect medications did not change the direction or statistical significance of either association, although the adjusted estimate was higher than the crude ROR for RED and lower for ORANGE. The adjusted OR was 104.12 (95% CI 79.23–136.83) for RED exposure and 23.11 (95% CI 18.23–29.30) for ORANGE exposure (Table 1).
Direct comparison of RED and ORANGE exposure: After excluding 13,431 reports exposed to both categories, RED exposure was associated with higher odds of Brugada syndrome reporting than ORANGE exposure. The adjusted OR was 5.54 (95% CI 4.06–7.54; p < 0.001) (Table 3). This estimate is larger than the ratio of the two category-level adjusted ORs (104.12/23.11, approximately 4.5) because the two analyses use different reference groups: all other reports in the category analyses, and ORANGE-only exposed reports in the direct comparison, which also excludes dual-exposed reports. The eligible sample and model covariates are reported in the Methods.
Comparator analysis: The selected comparator medications produced substantially smaller adjusted estimates than the RED and ORANGE categories. Metformin had an adjusted OR of 2.33 (95% CI 0.75–7.28), which was not statistically significant. Omeprazole and amlodipine yielded adjusted ORs of 6.25 (95% CI 2.00–19.49) and 6.31 (95% CI 2.81–14.17), respectively (Table 3). Because two of three comparators also showed statistically significant signals, the comparator analysis does not establish specificity of the category estimates; background reporting bias and residual confounding may contribute to the observed associations. The comparator analysis is therefore exploratory.
Table 3: Comparator Analyses and Direct Comparison of RED-only Versus ORANGE-only Exposure.
| Analysis | Exposed Brugada cases, n | Adjusted OR (95% CI)ᵃ |
|---|---|---|
| Comparator: metformin | 12 | 2.33 (0.75–7.28) |
| Comparator: omeprazole | 5 | 6.25 (2.00–19.49) |
| Comparator: amlodipine | 9 | 6.31 (2.81–14.17) |
| RED-only vs ORANGE-only (reference: ORANGE-only) | 72 vs 119 | 5.54 (4.06–7.54) |
CI, confidence interval; OR, odds ratio. ᵃAdjusted for sex, age, and number of suspect drugs. The direct comparison excludes 13,431 reports exposed to both categories. ORANGE was the reference category for the formal RED-versus-ORANGE comparison. Adjusted models used complete-case data (age available).
Individual medication signals: FDR-corrected drug-level analysis identified several marked signals (Table 4; Figure 2). Within the RED category, flecainide showed the highest ROR at 320.03 (95% CI 223.61–458.02), followed by nortriptyline at 166.37 (95% CI 111.65–247.91) and propafenone at 145.72 (95% CI 54.22–391.62). Among ORANGE medications, the largest RORs were observed for fluvoxamine (190.48; 95% CI 109.34–331.85), bupropion (70.89; 95% CI 52.28–96.12), and lamotrigine (51.84; 95% CI 37.53–71.62). All 21 drugs included in Table 4 remained statistically significant after Benjamini–Hochberg FDR correction (all q < 0.05; individual q-values in Supplementary Table S2).
Drug-level contribution to the category gradient: Only 6 of the 18 RED substances and 15 of the 27 ORANGE substances reached the three-case threshold, so the category estimates rest on a minority of the listed drugs, particularly for RED. Among the tested drugs, the median ROR was 93.9 for the six RED drugs (range 20.18–320.03) and 15.1 for the fifteen ORANGE drugs (range 9.01–190.48); this is a descriptive summary of the values in Table 4. Flecainide and propafenone, both class IC antiarrhythmics, accounted for up to 37 of the 106 RED-exposed Brugada syndrome cases.
Table 4: Individual Medication Disproportionality Signals (≥3 Exposed Brugada Syndrome Cases; FDR Q < 0.05).
| Medication | Category | Brugada cases, n | ROR | 95% CI |
|---|---|---|---|---|
| Flecainide | RED | 33 | 320.03 | 223.61–458.02 |
| Fluvoxamine | ORANGE | 13 | 190.48 | 109.34–331.85 |
| Nortriptyline | RED | 26 | 166.37 | 111.65–247.91 |
| Propafenone | RED | 4 | 145.72 | 54.22–391.62 |
| Bupropion | ORANGE | 47 | 70.89 | 52.28–96.12 |
| Lamotrigine | ORANGE | 41 | 51.84 | 37.53–71.62 |
| Lithium | ORANGE | 11 | 46.42 | 25.48–84.56 |
| Loperamide | ORANGE | 12 | 45.81 | 25.78–81.42 |
| Amitriptyline | RED | 20 | 42.12 | 26.86–66.05 |
| Propofol | RED | 15 | 35.33 | 21.08–59.19 |
| Cyamemazine | ORANGE | 5 | 33.29 | 13.77–80.48 |
| Fluoxetine | ORANGE | 15 | 22.90 | 13.67–38.37 |
| Oxcarbazepine | RED | 4 | 20.18 | 7.53–54.05 |
| Risperidone | ORANGE | 12 | 15.11 | 8.51–26.84 |
| Paroxetine | ORANGE | 6 | 14.92 | 6.66–33.42 |
| Lidocaine | ORANGE | 7 | 13.96 | 6.61–29.49 |
| Sertraline | ORANGE | 16 | 12.85 | 7.79–21.19 |
| Phenytoin | ORANGE | 3 | 12.51 | 4.01–38.95 |
| Propranolol | ORANGE | 6 | 11.16 | 4.98–25.00 |
| Venlafaxine | ORANGE | 9 | 9.13 | 4.72–17.68 |
| Quetiapine | ORANGE | 11 | 9.01 | 4.95–16.41 |
CI, confidence interval; FDR, false discovery rate; ROR, reporting odds ratio. Only medications with at least three exposed Brugada syndrome cases were included. The Benjamini–Hochberg correction was applied across 21 tested drugs. Cases may be exposed to more than one listed drug. All listed signals remained significant after correction (q < 0.05).
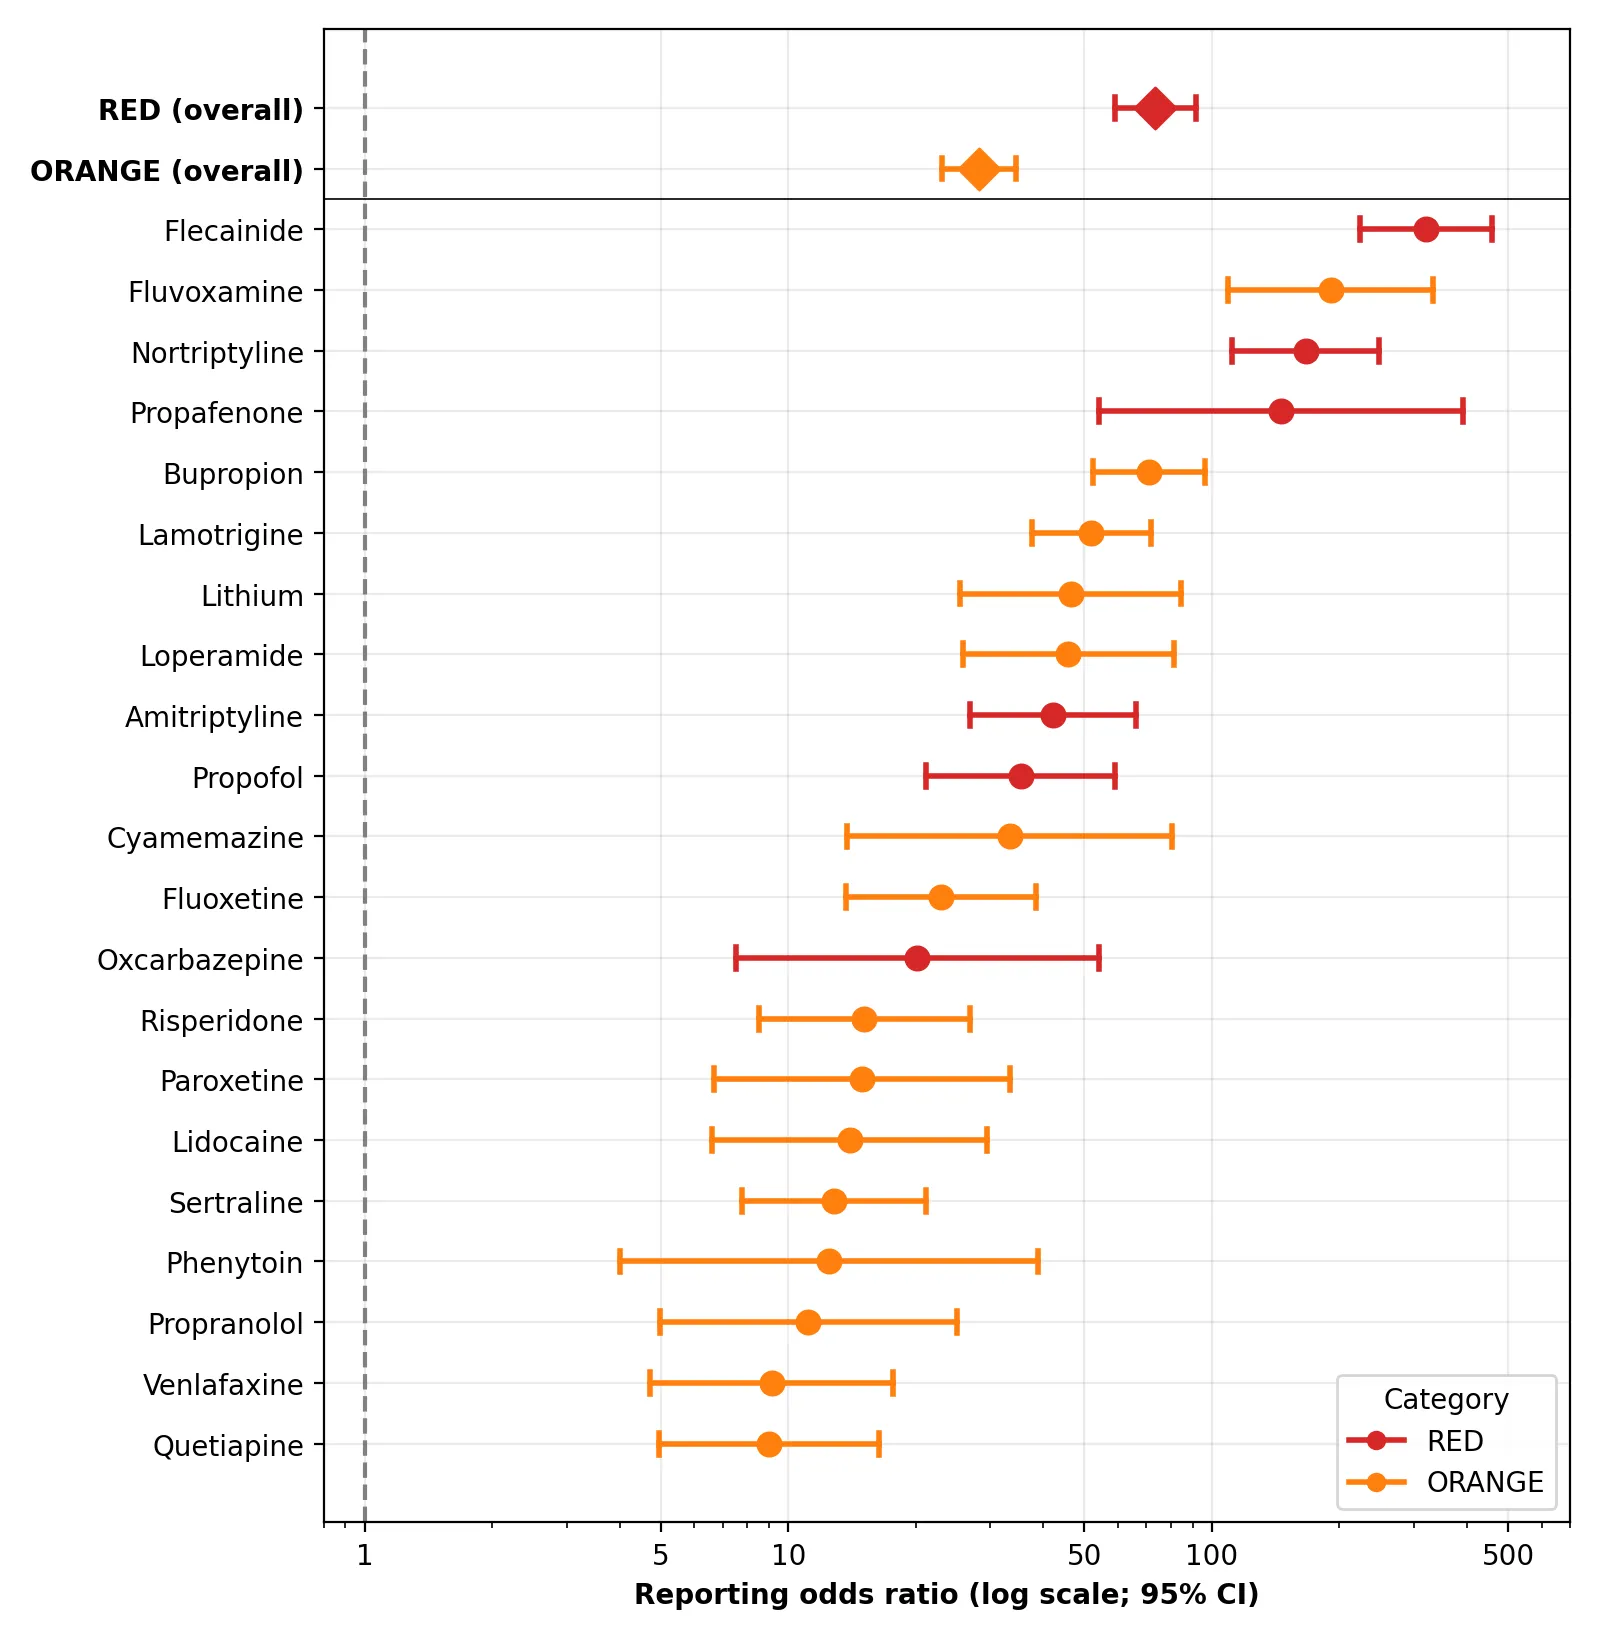
Figure 2: Forest Plot Showing Reporting Odds Ratios (ROR) with 95% Confidence Intervals for the Red and ORANGE Categories (Diamonds) and the 21 Individual Medications with at Least Three Exposed Cases (Circles). Colour Indicates the BrugadaDrugs.Org Category.
DISCUSSION:
Principal findings: This analysis of more than 7.6 million deduplicated FAERS cases identified substantial disproportionate reporting of Brugada syndrome for both expert-defined medication categories. The crude ROR was 73.54 for RED exposure and 28.24 for ORANGE exposure. In a direct analysis limited to mutually exclusive exposed reports, RED exposure remained associated with higher odds of Brugada syndrome reporting than ORANGE exposure, with an adjusted OR of 5.54 (95% CI 4.06–7.54). The central finding is the separation between the two categories. Rather than simply demonstrating a signal for individual sodium channel-blocking drugs, the analysis found a measurable reporting gradient corresponding to the expert classification used by BrugadaDrugs.org. This pattern is directionally consistent with the intended distinction between medications considered more versus less concerning in Brugada syndrome. It does not, however, constitute independent validation of clinical risk, because the expert classification partly draws on published case reports, some of which may overlap with FAERS reports.
Interpretation of the reporting gradient: The RED category showed approximately 2.6-fold higher crude disproportionality than ORANGE exposure, while the adjusted comparison between the two groups remained substantial. Differences in indication, patient characteristics, prescribing patterns, reporting behavior, and clinical recognition may all contribute to the size of a spontaneous-reporting signal. The observed gradient should not be interpreted as proof that the categories produce a corresponding difference in biological risk, nor as an estimate of absolute clinical risk.
Drug-level concentration of the RED signal: The RED estimate was driven largely by a few substances. Flecainide and propafenone, classic sodium channel-blocking antiarrhythmics, accounted for up to 37 of the 106 RED-exposed cases, and 12 of the 18 RED substances had fewer than three exposed cases. The category gradient therefore partly reflects the well-recognized signal of class IC antiarrhythmics rather than a uniform property of the RED list. However, RED-listed agents that are not antiarrhythmics (nortriptyline, amitriptyline, and propofol) also had RORs between 35 and 166, so the gradient is not confined to antiarrhythmic drugs. Repeating the category analysis after excluding flecainide and propafenone would test this directly and was not performed in the present study.
Psychotropic drug signals: Several non-cardiac psychotropic medications produced prominent signals. Fluvoxamine and nortriptyline had particularly high RORs, while amitriptyline showed a substantial signal within the RED category. These observations are notable because a number of antidepressant and antipsychotic agents have previously been discussed in the context of Brugada syndrome and may exhibit sodium channel-blocking effects.[5,6] These findings do not establish that any particular psychotropic medication causes Brugada syndrome. They do, however, support continued surveillance of such agents, particularly in patients with known or suspected channelopathy.
Sex-divergence pattern: The sex-stratified analysis revealed a category-specific pattern. RED exposure did not differ significantly by sex (male 80.10 vs female 71.91; interaction p = 0.842), whereas ORANGE exposure showed significantly higher reporting among females (male 17.73 vs female 47.33; interaction p = 1.66 × 10⁻⁵). This finding should be interpreted cautiously. Several antidepressants included in the ORANGE category, such as bupropion, fluoxetine, sertraline, and paroxetine, are commonly prescribed in populations that may differ in sex distribution. Such differences can affect the composition of exposed reports and may alter the observed ROR independently of biological susceptibility. Confounding by indication, prescribing patterns, and differences in reporting behavior may therefore contribute to the observed interaction. The sex divergence is consequently better viewed as a hypothesis-generating pharmacovigilance signal than as evidence of a sex-specific pharmacologic effect, and requires confirmation in data with more detailed clinical and prescribing information.
Strengths: The study used a large international spontaneous-reporting database covering five consecutive years. The drug categories were defined a priori from an external expert classification rather than from the FAERS results, although that classification itself draws on published case reports. Case-level deduplication reduced distortion from multiple versions of the same report. The analysis included complementary approaches: primary-suspect sensitivity analysis, sex- and age-stratified analyses, multivariable adjustment, comparator drugs, a direct RED-versus-ORANGE comparison, and FDR correction for individual-drug testing.
Clinical implications: The findings provide additional postmarketing evidence directionally consistent with the distinction between RED and ORANGE medications used by BrugadaDrugs.org, and should be interpreted within the limitations of spontaneous-reporting systems and not treated as estimates of absolute clinical risk. The prominent signals observed with several psychotropic medications reinforce the need for awareness of potential Brugada-related concerns beyond traditional antiarrhythmic agents. The marked differences across age and sex strata also indicate that patient characteristics and prescribing patterns may influence pharmacovigilance signals. More broadly, this study illustrates how spontaneous-reporting databases can complement clinical knowledge by identifying patterns that may not be obvious from individual case reports or mechanistic studies.[18,19]
Future research: Replication in independent pharmacovigilance systems, including EudraVigilance and WHO VigiBase, would help determine whether the observed patterns are reproducible across reporting systems. Population-based pharmacoepidemiologic studies using measured drug exposure and validated outcome definitions are needed to estimate incidence and absolute risk. In particular, the higher female-specific signal observed for ORANGE medications and the prominent signals associated with psychotropic drugs warrant targeted evaluation in datasets containing detailed prescribing, clinical, and electrocardiographic information.
LIMITATIONS:
The principal limitations arise from the nature of spontaneous-reporting data. FAERS is subject to underreporting, stimulated reporting, notoriety bias, differences in reporting practices, and variation in reporting intensity between drugs and clinical settings.[20] Because the database does not provide a reliable denominator for drug exposure, RORs cannot be translated into incidence rates or absolute clinical risk. The observed associations also cannot be interpreted as causal effects. Individual reports in the aggregate FAERS files cannot be reliably validated using formal causality algorithms such as the French method or the Naranjo algorithm.[21,22] Details that would support causality assessment, including indication, dose, treatment duration, concomitant medicines, comorbidities, chronology of exposure and onset, dechallenge, rechallenge, and clinical outcome, were incomplete or not analyzed, and the analysis could not distinguish true adverse drug reactions from other event types such as medication errors or drug interactions.
Although case-level deduplication was performed, repeated or follow-up submissions cannot be ruled out completely, particularly duplicates submitted under different case identifiers. Because FAERS does not provide a unique patient identifier, residual duplication may remain. Exposure misclassification is another possibility, particularly for combination products, ambiguous brand names, and other imperfectly standardized drug entries; the mapping dictionary is available from the corresponding author to make this process reproducible. The analysis was restricted to the drug substances listed on BrugadaDrugs.org, and the classification is periodically updated; the version available in October 2026 was used, and subsequent revisions could alter individual drug assignments.
Confounding by indication is also important. Patients receiving sodium channel-blocking antiarrhythmic drugs or psychotropic medications may differ systematically from the broader FAERS population, which could affect both medication exposure and the probability that Brugada syndrome is recognized or reported. No adjustment was made for reporting year, country, or reporter type. The number of suspect drugs used as a polypharmacy proxy is partly determined by the exposure itself, which could create overadjustment; the crude RORs, which do not include this covariate, are therefore reported alongside the adjusted estimates.
The category-level estimates also depend on a small number of drugs. Twelve of the 18 RED and 12 of the 27 ORANGE substances did not reach the three-case threshold and contributed only through the category totals, and flecainide and propafenone alone accounted for up to 37 of the 106 RED-exposed cases. No category analysis excluding class IC antiarrhythmics was performed, so the RED–ORANGE gradient may overstate differences among the remaining substances.
The comparator results provide additional context. Metformin showed a relatively small, non-significant estimate, whereas omeprazole and amlodipine showed smaller but still elevated estimates, suggesting that some background reporting bias or residual confounding may remain. Levothyroxine was dropped as a comparator after the data were examined; this exclusion was not prespecified. RED and ORANGE exposure were also not mutually exclusive in the primary analyses, so some reports contributed to both category-level estimates; the direct comparison addressed this by excluding reports with exposure to both categories.
Age was missing for 3,261,225 deduplicated reports (42.6%). Complete-case analysis was used for adjusted models, which cannot eliminate the possibility of selection bias related to missing data. Adjusted odds ratios exceeded the corresponding crude RORs for RED exposure but were lower than the crude RORs for ORANGE exposure; this pattern most plausibly reflects negative confounding by age and number of suspect drugs for RED, and the different reference compositions between categories. This pattern does not alter the direction or statistical significance of the associations but indicates that the adjusted estimates should be interpreted alongside the crude values.
Finally, the BrugadaDrugs.org classification draws in part on published case reports, some of which may overlap with FAERS reports. The observed concordance therefore reflects a correspondence between the expert hierarchy and reporting patterns, and should not be described as independent validation of clinical risk.
CONCLUSION:
In FAERS reports collected from 2021 through 2025, both RED and ORANGE medications showed substantial disproportionate reporting of Brugada syndrome. The associations remained evident after restricting exposure to primary suspects and after adjustment for age, sex, and the number of suspect medications. In the mutually exclusive analysis, RED exposure was associated with higher odds of Brugada syndrome reporting than ORANGE exposure (adjusted OR 5.54, 95% CI 4.06–7.54). This reporting gradient is directionally consistent with the expert risk hierarchy used by BrugadaDrugs.org, though it does not constitute independent validation of clinical risk. The additional signals observed for several psychotropic medications and the contrasting sex-specific pattern for ORANGE medications merit further investigation. As with all spontaneous-reporting analyses, these findings represent pharmacovigilance signals and should not be interpreted as evidence of causality, incidence, or absolute clinical risk.
DECLARATIONS:
Ethics approval and consent to participate: This study used publicly available, de-identified FAERS data. No identifiable patient-level information was accessed, and no ethics committee approval or consent was required or obtained; no committee name or reference number applies.
Funding:
No specific funding was received for this work.
Conflicts of interest:
The authors declare no conflicts of interest.
Data availability: The FAERS quarterly data files analyzed in this study are publicly available from the US Food and Drug Administration at https://www.fda.gov/drugs/fdas-adverse-event-reporting-system-faers/fda-adverse-event-reporting-system-faers-latest-quarterly-data-files/. No DOI is assigned to the FAERS data files. The analysis code, the drug-mapping dictionary, and a dated copy of the BrugadaDrugs.org lists used for analysis are available from the corresponding author upon reasonable request.
Use of generative AI and AI-assisted technologies: During preparation of this manuscript, the authors used AI-assisted technology to improve readability, language, and manuscript formatting, and to assist in writing and debugging the R analysis code. The AI tool was not used to generate or interpret study findings. The authors reviewed, validated, and edited all AI-assisted output and take full responsibility for the final content.
REFERENCES




Yuvraj Jadhav, Sakshi Jadhav, Sanika Gurav, Sanket Harimakar, Disproportionality of Brugada Syndrome with Expert-Defined High-Risk Medications in the FDA Adverse Event Reporting System (FAERS), 2021–2025, Int. J. of Pharm. Sci., 2026, Vol 4, Issue 11, 191-204. https://doi.org/10.5281/zenodo.23877142
 10.5281/zenodo.23877142