

We use cookies to ensure our website works properly and to personalise your experience. Cookies policy
Anurag College of Pharmacy, Warthi, Bhandara, Maharashtra.
Atorvastatin is an effective lipid-lowering agent. However, its poor aqueous solubility may limit dissolution and consequently affect its oral bioavailability. Berberine is a naturally occurring alkaloid with several pharmacological activities; however, its pharmaceutical development is also challenged by limited aqueous solubility and low oral bioavailability. The present study was undertaken to formulate an atorvastatin-berberine solid dispersion using polyvinylpyrrolidone K30 (PVP K30) as a hydrophilic carrier and to develop the resulting solid dispersion into a tablet dosage form. The solid dispersion was prepared using an atorvastatin:berberine:PVP K30 ratio of 1:1:5. The prepared tablets were evaluated for their physical characteristics and dissolution performance. In addition, a UV-visible spectrophotometric analytical procedure was developed using an Analytical Quality by Design oriented approach, with wavelength, solvent and scanning speed investigated as analytical variables. The analytical procedure was further evaluated for linearity, precision, accuracy, specificity and sensitivity. The prepared tablets showed a disintegration time of 15 mins, hardness of 5.1 kg/cm2 and friability of 0.60%. At 45 min, the solid dispersion formulation showed.
An essential risk factor for atherosclerosis and cardiovascular illness, hyperlipidemia is a severe metabolic disorder marked by high blood lipid content. Because statins can prevent the manufacture of cholesterol, they are frequently used to treat hyperlipidemia [1]. A powerful inhibitor of 3-hydroxy-3-metylglutaryl-coenzyme A reductase, atorvastatin calcium is widely used to treat hypercholesterolemia and prevent cardiovascular events. Atorvastatin is having limited water solubility which may restrict its dissolution and hence affect its oral availability, even with its therapeutic efficacy [2,3].
A number of formulation strategies, such as particle size reduction, complexation, lip-based systems, nanoparticles and solid dispersion technologies, have been studied to get around the dissolution restrictions related to poorly water-soluble medications [6,7,8]. While adding a poorly water- soluble medication to a hydrophilic carrier might improve wetting, increase the effective surface area, boost molecular dispersion or even decrease drug crystallinity, solid dispersion is one of these strategies that is being investigated the most. A hydrophilic polymer called polyvinylpyrrolidone (PVP) has been studied as a carrier for solid dispersion system carrying medications that are poorly soluble in water, such as atorvastatin [2,3,4,5].
Berberine, naturally occurring isoquinoline alkaloid has a variety of pharmacological actions, including those related to lipid and glucose metabolism. However, its low oral bioavailability, which has been linked to poor solubility and permeability, poses a difficulty to its pharmacological development [9,10]. As a result, many formulation techniques have been studied to enhance berberine’s solubility, intestinal absorption and bioavailability. Berberine’s physicochemical characteristics can be changed and its dissolution or oral bioavailability can be enhanced, using amorphous and polymeric dispersion systems [11,12].
To evaluate pharmaceutical formulations, a suitable analytical process must be developed. Because of its ease of use, speed and accessibility, UV-visible spectrophotometry is still a valuable analytical method [13]. Various analytical techniques, such as UV spectrophotometric methods and high-performance liquid chromatography, have been used to analyze atorvastatin. For a technique to have acceptable linearity, precision, accuracy, specificity and sensitivity, demanding selection of analytical conditions is essential [13,15].
Based on predetermined analytical goals, the identification of crucial method variables, risk assessment and a methodical assessment of analytical circumstances, Analytical Quality by Design (AQbD) offers a methodical framework for developing analytical methos. Therefore, a more structured alternatives to empirical trial and error development can be offered by an AQbD-oriented approach. Wavelength, solvent and scanning speed were examined in this work as analytical variables while the UV-visible spectrophotometric method was being developed [14].
Therefore, the goal of the current work was to create an atorvastatin-berberine solid dispersion utilizing PVP K30 as a hydrophilic carrier, incorporate the solid dispersion into a tablet dosage form and assess the physical and dissolution properties of the final tablets. Concurrently an AQbD oriented method was used to create and assess a UV-visible spectrophotometric analytical process. The atorvastatin:berberine:PVP K30 ratio selected for the formulation was 1:1:5.
MATERIALS AND METHODS
MATERIALS
the active medicinal components were chosen to be atorvastatin and berberine. The suppliers of berberine and atorvastatin were TCI Chemicals and hetero Labs, respectively. PVP K30 or polyvinylpyrrolidone K30, served as the hydrophilic polymeric carrier. Both ethanol and methanol were purchased from Merck. Merck supplied potassium dihydrogen phosphate (KH2PO4), whereas Sigma-Aldrich supplied disodium hydrogen phosphate. Magnesium stearate, lactose, starch, and talc were utilized as tablet exciepients.
The active medicinal components were chosen to be atorvastatin and berberine. The suppliers of berberine and atorvastatin were TCI Chemicals and Hetero Labs, respectively. PVP K30 or polyvinypyrrolidone K30, served as the hydrophilic polymeric carrier. Both ethanol and methanol were purchased from Merck. Merck supplied potassium dihydrogen phosphate, whereas Sigma-Aldrich supplied disodium hydrogen phosphate. Magnesium stearate, lactose, starch and talc were utilized as tablet excipients.
Instruments
Spectrophotometric analysis was performed using a double-beam UV-visble spectrophotometer (Lab India). A USP dissolving equipment (Elecrolab Pvt. Ltd., Goregaon East, Mumbai, India) was used for the dissolve tests. During the formulation and analytical processes, a digital balance (CAS-164, Contech, India; sensitivity 10 mg), magnetic stirrer (1MLH, REMI, India), ultrasonicator (PCI, Mumbai,India; Model 3.5 L 100H) and hot-air oven (Meta-Labs,India) were utilized.
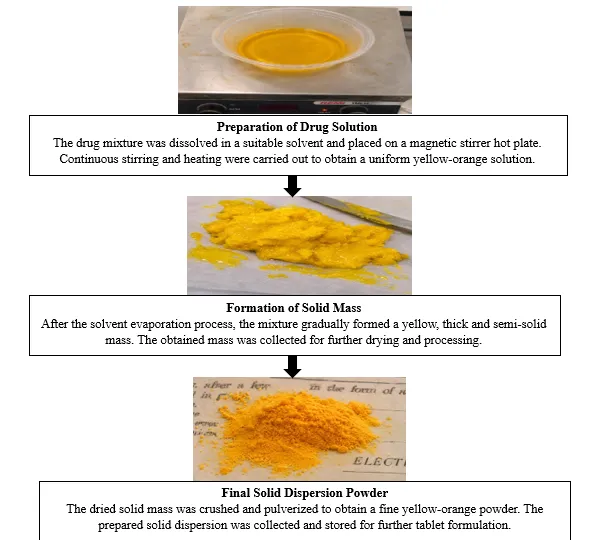
Preparation of Atorvastatin-Berberine Solid Dispersion
Lactose. Starch, Talc and Magnesium stearate were used as excipients to integrate the produced solid dispersion into tablets. The experimental work reported 5.6 g of solid dispersion, 15 g of lactose, 6 g of starch, 0.5 g of talc and 0.25 g of magnesium stearate.
DRUG PROFILE:
Atorvastatin:
Appearance: Atorvastatin is described as a white to off-white crystalline powder.
Odour and Taste: It is odourless and has a bitter taste.
Storage: Store in a cool and dry place, below 10ºC.
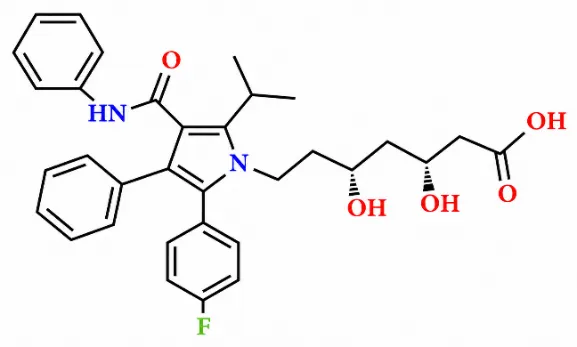
Chemical Name: 7-[2-(4-fluorophenyl)-3-phenyl-4-(phenylcarbamoyl)-5-(propan-2-yl)-1H-pyrrol-1-yl]-3,5-dihydroxy heptanoate.
Category: Atorvastatin belongs to the antihyperlipidemic class of drugs.
Molecular Formula: (C33H34FN2O5)2·Ca2+.
Molecular Weight: 1209.42 g/mol.
Melting Point: 158-160ºC.
Chemical Structure:
BCS Classification: Class II drug.
Functional Category: HMG-CoA reductase inhibitor.
Solubility: Atorvastatin is insoluble in aqueous solutions at pH 4 and below. Atorvastatin calcium is very slightly soluble in distilled water, pH 7.4 phosphate buffer and acetonitrile. It is slightly soluble in ethanol and freely soluble in methanol [1].
Berberine
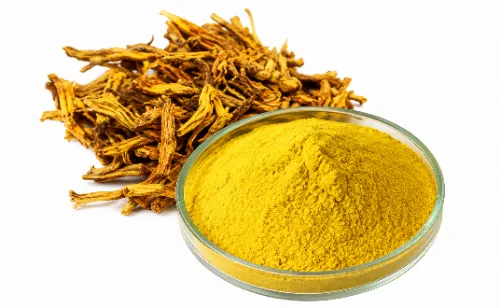
Source: Berberine is present in roots, rhizomes and stem bark of several plants, including Hydrastis canadensis (goldenseal), Coptis chinensis (golden thread), Berberis aquifolium (Orgon grape), Berberis vulgaris (barberry) and Berberis aristata (tree turmeric).
Appearance: Berberine is described as yellow to orange powder extract.
Odour and Taste: It has a characteristic odour and a bitter taste.
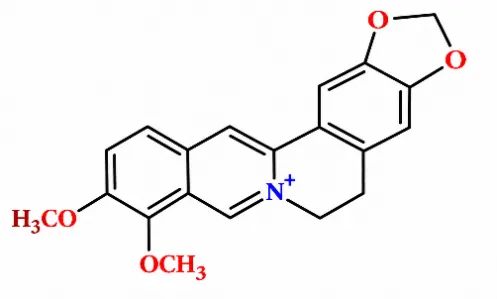
IUPAC Name: 5,6-dihydro-9,10-dimethoxybenzo [g]-1,3-benzodioxolo-[5,6a]-quinolizinium.
Chemical Structure:
Molecular Formula: C20H18ClNO4.
Molecular Weight: 371.8 g/mol.
Melting Point: 145ºC.
Solubility: Berberine is soluble in boiling water and slightly soluble in cold water. It is soluble in ethanol (>2 mg/mL), soluble in DMSO (74 mg/mL), slightly soluble in chloroform and soluble in methanol (>20 mg/mL). Maximum Absorption Wavelength (λmax): 265 nm and 343 nm [17].
Evaluation of Tablets
In compliance with the relevant pharmacopeial processes, the produced tablets were evaluated for physical attributes such as appearance, hardness, friability, disintegration time and weight variation. The in-vitro dissolving performance of the formulation investigated further.
In-vitro Dissolution Study
Using a USP dissolution apparatus, the dissolution behaviour of the prepared solid dispersion tablet was assessed. Samples were taken out at predefined intervals of 0,5,10,15,25,35 and 45 minutes and spectrophotometric analysis was performed. The dissolution performance of the prepared solid dispersion formulation was evaluated in comparison with that of the corresponding physical mixture and a commercial formulation [16].
UV-Visible Spectrophotometric Method Development
A UV-visible spectrophotometric method was created for the formulation’s analytical assessment. In terms of wavelength, solvent and scanning speed, the analytical conditions were methodically examined.
Standard solutions wit concentrations ranging from 2 to 12 μg/mL were made and their absorbance responses were noted in order to evaluate linearity. Plotting absorbance against concentration allowed for the construction of the calibration curve, which was then subjected to linear regression analysis.
Multiple measurements of the working standard were used to assess precision. Mean, standard deviation (SD) and percentage relative standard deviation (%RSD) were used to express the outcomes of the assessments of intraday precision, intraday precision and repeatability.
In order to determine whether interference existed at the analytical wavelength, specificity was evaluated by comparing the responses of the standard solution with the diluent and frequently used tablet excipients.
Sensitivity was evaluated in terms of the limit of detection (LOD) and limit of qualification (LOQ), calculated using the following equations:
LOD = 3.3 σ/S
LOQ = 10 σ/S
Where S is the calibration curve’s slope and σ is the standard deviation used for the sensitivity calculation.
The percentage recovery was computed from the measured and added amounts of the analyte and accuracy was assessed using the standard addition method at 80%, 100% and 120% levels.
AQbD-Oriented Analytical Method Development
The UV-Visible spectrophotometric technique was developed using an Analytical Quality by Design-oriented approach. To determine appropriate operating conditions, analytical factors such as wavelength, solvent and scanning speed were examined. The linearity, precision, accuracy, specificity and sensitivity of the devised technique were then evaluated [15].
Based on a methodical assessment of particular analytical variables, the study exemplifies an analytical method development strategy focused on AQbD. Response-surface optimization or a formal design-of-experiments matrix were not used.
RESULTS AND DISCUSSION
Physical Evaluation of Solid-Dispersion Tablets
The prepared atorvastatin-berberine solid-dispersion tablets were evaluated for disintegration time, hardness and friability. The tablets exhibited a disintegration time of 15 mins, hardness of 5.1 kg/cm2 and friability of 0.60% (Table 2). The observed values indicates that the formulation possessed adequate mechanical strength while maintaining satisfactory disintegration characteristics for an immediate-release tablet dosage form.
Table 1: Physical Evaluation of Atorvastatin-Berberine Solid-Dispersion Tablets
| Sr. No. | Evaluation parameters | Observed results |
|---|---|---|
| 1. | Disintegration time | 15 minutes |
| 2. | Hardness | 5.1 kg/cm2 |
| 3. | Friability | 0.60% |
| 4. | Weight Variation | 0.651 ± 5 |
In-vitro Dissolution Study
Over the duration of 45 min, the dissolution profiles of atorvastatin, berberine. The matching physical mixture, the marketed formulation and the atorvastatin-berberine solid dispersion formulation were assessed. Drug release increased progressively with dissolution time for all investigated samples. The complete dissolution profiles are presented in Table 3.
Table 2: In-Vitro Dissolution Profile of Atorvastatin-Berberine Formulations
| Sr. No. | Time (min) | Atorvastatin (%) | Berberine (%) | Physical mixture 1:1:5 (%) | Marketed formulation (%) | Solid dispersion 1:1:5 (%) |
|---|---|---|---|---|---|---|
| 1. | 0 | 0.00 | 0.00 | 0.00 | 0.00 | 0.00 |
| 2. | 5 | 3.29 | 4.95 | 5.92 | 15.32 | 13.53 |
| 3. | 10 | 10.31 | 11.06 | 12.44 | 25.69 | 23.19 |
| 4. | 15 | 24.08 | 24.76 | 26.20 | 40.25 | 39.85 |
| 5. | 25 | 42.92 | 40.38 | 45.05 | 69.58 | 62.08 |
| 6. | 35 | 61.67 | 66.08 | 68.24 | 92.65 | 86.23 |
| 7. | 45 | 70.72 | 70.25 | 75.49 | 98.63 | 93.45 |
At 45 min, the individual atorvastatin and berberine samples showed 70.72% and 70.25% drug release, respectively. The physical mixture showed 75.49% release, whereas the solid-dispersion formulation showed 93.45% release. The marketed formulation exhibited the highest release at 98.63%.
As a result, at 45 minutes, the drug release from the solid-dispersion formulation was 17.96%, which is higher than that of the physical combination or roughly 23.79% better.
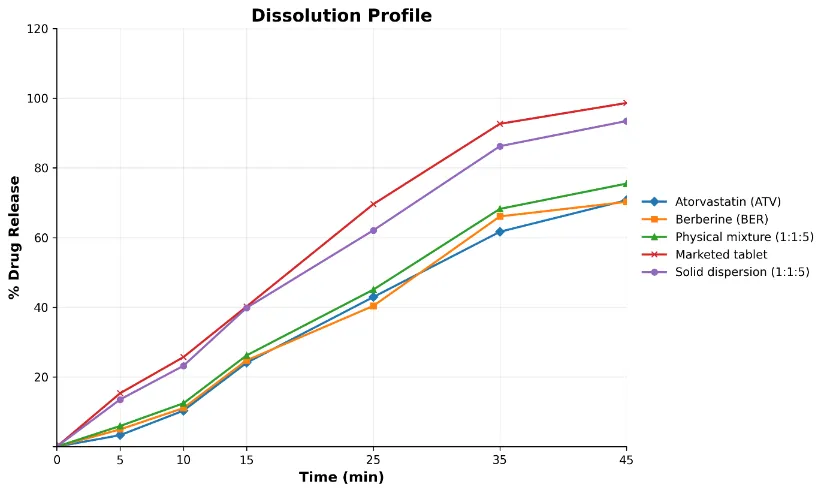
Figure 1: Dissolution Graph
PVP K30, a hydrophilic polymeric carrier that can enhance wetting and encourage dispersion of poorly water-soluble medications inside the formulation, may be responsible for the solid-dispersion formulation’s improved dissolving. The results are in line with the general usefulness of polymeric solid-dispersion systems for enhancing the way poorly water-soluble chemicals dissolve.
Although the prepared solid dispersion demonstrated improved dissolution compared with the individual drug samples and physical mixtures, it did not exceed the marketed formulation. At 45 min, the marketed formulation showed 98.63% release compared with 93.45% for the prepared solid dispersion. Thus, the present formulation can approximately be described as demonstrating enhanced dissolution relative to the physical mixture, without claiming superiority over the marketed product.
Analytical Method Development and Validation
Wavelengh and Solvent Selection
The analytical response was initially investigated at wavelengths of 264 and 267 nm using methanol, ethanol and water as solvents. Both wavelength and solvent had an impact on the absorbance response. The reaction at 267 nm was typically greater than that at 264 nm at the quantities under investigation; for instance, at 10 μg/mL, absorbance values at 267 and 264 nm were 1.2120 and 0.9984, respectively. While the answer obtained with ethanol and water showed more fluctuation, methanol produced a progressive increase in absorbance over the tested concentration range.
Table 3: Effect of Wavelength and Solvent on Absorbance Response
| Sr. No. | Concentration (μg/mL) | Wavelength | Solvent System | |||
|---|---|---|---|---|---|---|
| 264 nm | 267 nm | Methanol | Ethanol | Water | ||
| 1. | 2 | 0.2106 | 0.3106 | 0.3131 | 1.2480 | 1.3489 |
| 2. | 4 | 0.4569 | 0.5012 | 0.5333 | 0.3346 | 1.3684 |
| 3. | 6 | 0.5961 | 0.7590 | 0.7394 | 0.5978 | 0.9654 |
| 4. | 8 | 0.8521 | 0.9562 | 0.9765 | 0.6679 | 0.9936 |
| 5. | 10 | 0.9984 | 1.2120 | 1.2482 | 0.7648 | 1.5698 |
In initial evaluation of the analytical conditions was done using the wavelength and solvent screening. According to the experimental protocol, aqueous standard solutions measured at 247 nm were used to create the subsequent validation dataset
Effect of Scanning Speed
At two examined wavelength intervals, the impact of scanning speed was assessed under fast, medium and slow scanning settings. While there was only slight variation in absorbance between the scanning conditions, slower scanning resulted in longer analysis times. At interval 1, the analysis time rose from 0.25 to 2.00 minutes and the absorbance the absorbance at 247 nm increased from 0.969 under fast scanning to 0.977 under slow scanning. Absorbance at 247 nm varied from 0.970 to 0.977 at interval 2, while analysis time increased from 0.10 to 0.45 minutes.
Table 4: Effect of Scanning Speed on Analytical Response and Analysis Time
| Sr. No. | Scanning interval | Scanning speed | Wavelength (nm) | Absorbance | Analysis time (min) |
|---|---|---|---|---|---|
| 1. | Interval 1 | Fast | 247, 249 | 0.969, 0.970 | 0.25 |
| 2. | Interval 1 | Medium | 0.973, 0.974 | 0.45 | |
| 3. | Interval 1 | Slow | 0.977, 0.978 | 2.00 | |
| 4. | Interval 2 | Fast | 0.970, 0.970 | 0.10 | |
| 5. | Interval 2 | Medium | 0.973, 0.975 | 0.22 | |
| 6. | Interval 2 | Slow | 0.977, 0.978 | 0.45 |
The results show that, under the analysed conditions, scanning speed had a bigger impact on analysis time than on absorbance response. As a result, scanning speed evaluation served as an overview for taking both analysis performance and analytical response into consideration.
Linearity
The linearity of the UV-visible spectrophotometric method was assessed within the concentration range of 2-12 μg/mL. Plotting absorbance against concentration allowed for the construction of the calibration curve. With a slope of 0.11174, intercept of 0.07467 and coefficient of the determination (R2) of 0.9988, the working dataset demonstrated a linear connection over the examined range.
Table 5: Linearity Data of the Analytical Method
| Sr. No. | Concentration (μg/mL) | Absorbance |
|---|---|---|
| 1. | 2 | 0.3106 |
| 2. | 4 | 0.5000 |
| 3. | 6 | 0.7590 |
| 4. | 8 | 0.9560 |
| 5. | 10 | 1.2000 |
| 6. | 12 | 1.4156 |
[Figure - see the formatted PDF]
Figure 2: Calibration Curve and the Best-Fit Line
Regression equation: y = 0.11174x + 0.07467
R2: 0.9988
The calibration data demonstrated a strong linear relationship between concentration and absorbance within the investigated concentration range.
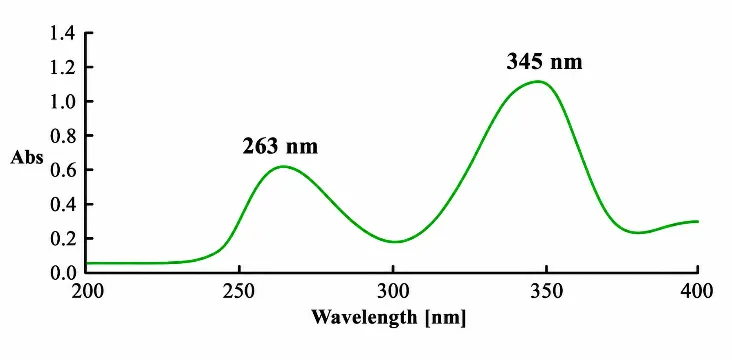
Specificity:
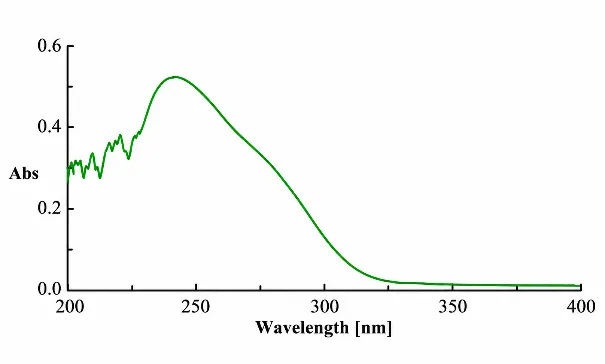
Figure 3: UV–Vis Spectrum of Atorvastatin
Figure 4: UV–Vis Spectrum of Berberine
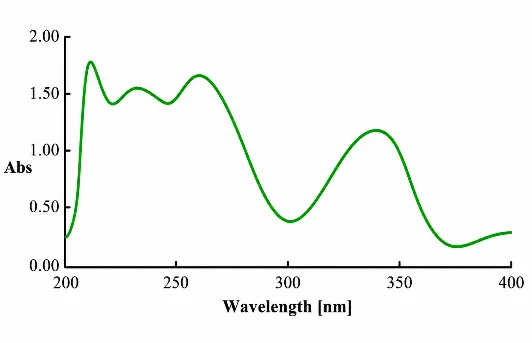
Figure 5: UV–Vis Spectrum of Atorvastatin–Berberine Tablet.
Precision
Precision was evaluated in terms of inter-day precision, intra-day precision and repeatability. The reported precision experiments were performed at 6 μg/mL.
Table 6: Inter-Day Precision of the Analytical Method
| Sr. No. | Parameter | Day 1 | Day 2 | Day 3 |
|---|---|---|---|---|
| 1. | Mean | 0.8903 | 0.9318 | 0.9129 |
| 2. | SD | 0.0119 | 0.0075 | 0.0127 |
| 3. | %RSD | 1.34 | 0.81 | 1.39 |
[*Mean represents the average of three replicate readings (n = 3)]
The %RSD values for Days 1,2 and 3 were 1.34%, 0.81% and 1.39%, respectively, indicating low variability across different days.
Table 7: Intra-Day Precision of the Analytical Method
| Sr. No. | Parameter | Set 1 | Set 2 | Set 3 |
|---|---|---|---|---|
| 1. | Mean | 0.8863 | 0.9338 | 0.9169 |
| 2. | SD | 0.0100 | 0.0181 | 0.0095 |
| 3. | SM | 1.13 | 1.94 | 1.03 |
[*Mean represents the average of three replicate readings (n = 3)]
The intra-day %RSD values were 1.13%, 1.94% and 1.03% for Sets 1,2 and 3, respectively. All values were below 2%, demonstrating satisfactory consistency under the investigated same-day conditions. For repeatability, three measurements at 6 μg/mL produced a mean absorbance of 0.91655, SD of 0.01324 and %RSD of 1.44%.
Overall, the precision studies demonstrated %RSD values below 2%, indicating satisfactory consistency of the analytical response under the reported experimental conditions.
Effect of Change of Analyst
Analyst-to-Analyst variation was evaluated by comparing two analysts responses at 6 and 10 μg/mL.
Analysts 1 and 2 produced responses of 0.80917 and 0.86534 at 6 μg/mL and 0.76056 and 0.77209 at 10 μg/mL, respectively.
These data were considered as a comparative analyst-response assessment rather than a formal statistical estimate of intermediate precision because only one observation per analyst was available at each concentration.
Limit Detection and Limit of Qualification
The limit of detection (LOD) and limit of Qualification (LOQ) were calculated using the standard deviation of response and the slope of the calibration curve according to:
LOD = 3.3 σ/S
LOQ = 10 σ/S
Using σ = 0.013 and the corrected calibration slope (S) of 0.11174, the calculated LOD and LOQ were 0.384 μg/mL and 1.163 μg/mL, respectively.
Table 8: Limit of Detection and Limit of Qualification
| Sr. No. | Parameter | Value |
|---|---|---|
| 1. | Σ | 0.013 |
| 2. | Slope (S) | 0.11174 |
| 3. | LOD | 0.383 μg/mL |
| 4. | LOQ | 1.163 μg/mL |
The calculated values indicate that the analytical procedure had measurable sensitivity below the investigated linearity range.
Accuracy and Recovery
Accuracy was evaluated by the standard-addition method at 80%, 100% and120% concentration levels. Recovery was determined for both atorvastatin and berberine.
Table 9: Accuracy and Recovery Results
| Sr. No. | Addition level | Atorvastatin recovery (%) | Mean recovery (%) | Berberine recovery (%) | Mean recovery (%) |
|---|---|---|---|---|---|
| 1. | 80% | 99.78, 99.65, 100.32 | 99.92 | 98.56, 99.65, 99.72 | 99.31 |
| 2. | 100% | 99.57, 100.12, 100.63 | 100.11 | 99.21, 99.57, 99.68 | 99.49 |
| 3. | 120% | 100.14, 100.32, 100.69 | 100.38 | 100.69, 100.85, 100.98 | 100.84 |
The mean recoveries for atorvastatin were 99.92%, 100.11% and 100.38% at the 80%, 100% and 120% levels, respectively. For berberine, the corresponding recoveries were 99.31%, 99.49% and 100.84%. The recovery values were close to 100% across all investigated levels, indicating satisfactory accuracy under the reported experimental conditions.
Specificity
By comparing the UV spectra of the standard solution, diluent and a typical pharmaceutical excipient, specificity was evaluated. Potential interference was assessed using a standard solution of 10 μg/mL. During the analysis, no interfering peaks were found.
The specificity of the analytical process for the tested formulation is supposed by the lack of reported interference under the examined conditions.
Overall Analytical Performance
The developed analytical procedure demonstrated a linear response over 2-12 μg/mL, with a regression equation of y = 0.11174 + 0.07467 and R2 of 0.9988. LOD and LOQ were determined to be 0.384 and 1.163 μg/mL, respectively. While accuracy studies demonstrated recoveries of 100% for both atorvastatin and berberine, precision studies yielded %RSD values below 2%. During the specificity assessment, no interference was reported.
AQbD-Oriented Analytical Method Development
The analytical method-development study evaluated selected analytical variables, including wavelength, solvent and scanning speed, to evaluate their impact on analytical time and spectrophotometric response. Rather than depending only on one trial condition, the investigation offered a systematic framework for selecting analytical conditions.
These characteristics are crucial for the development of UV-Visible methods, as evidenced by the wavelength and solvent studies, which showed variance in analytical responses with changes in experimental conditions. According to the scanning-speed investigation, slower scanning required longer analytical periods but only slightly increased absorbance. Therefore, when choosing instrumental conditions, both analytical response and operational efficiency should be taken into account. Thus, it is appropriate to characterize this study as an analytical method development study focused on AQbD. A formal multivariable Design of Experiments (DoE), response-surface model for numerical optimization function is not demonstrated by the available experimental data. As a result, rather than a statistically defined AQbD design space, the results represent a systematic assessment of selected analytical variables.
Overall Discussion
The present study combined formulation development, tablet evaluation, dissolution assessment and UV-visible analytical method development for an atorvastatin-berberine solid-dispersion tablet. An atorvastatin:berberine:PVP K30 ratio of 1:1:5 was used to develop the solid dispersion, which was then added to a tablet dosage form.
The produced tablets showed good mechanical integrity and disintegration properties under the examined conditions, with a hardness of 5.1 kg/cm2, friability of 0.60% and disintegration time of 15 minutes.
As compared to the corresponding physical combination, the dissolution study showed that the solid-dispersion formulation performed significantly. At 45 minutes, the solid dispersion demonstrated 93.45% drug release as opposed to 75.49% for the physical mixture, which is an improvement close to 17.96% or a relative increase of approximately 23.79%.
At 45 minutes, the marketed formulation had a greater release of 98.63%. as a result, the current formulation should not be regarded as better than the commercial product. However, the results demonstrate how effectively the solid-dispersion method based on PVP K30 improves dissolving in comparison to the physical combination. To further improve dissolving performance, more formulation tweaking may be required.
The analytical procedure demonstrated a linear response over the investigated concentration range of 2-12 μg/mL, with the working calibration equation y = 0.11174x + 0.07467 and R2 = 0.9988. The calculated LOD and LOQ were 0.384 and 1.163 μg/mL, respectively. Precision studies produced %RSD values below 2%, while recovery values for both atorvastatin and berberine were close to 100%.
No interference was reported during specificity assessment with the tested diluent and excipient. When considered together, the linearity, precision, accuracy, specificity and sensitivity results confirm that the developed UV-visible process can be applied for analytical evaluation of the formulation in the conditions under investigation.
A significant structure for the continued development of atorvastatin-berberine solid-dispersion tablets is provided by the combined formulation and analytical development approach. While the AQbD-oriented analytical research offers an organized method for assessing significant analytical variables, the formulation findings justify the use of PVP K 30 for enhancing dissolving performance. The formulation and analytical development could be strengthened by more research involving formal DoE-based optimization, robustness evaluation and more physiochemical characterization.
REFERENCES






Pranjali Raut, Anshuman Borkar, Kumudini Dhurve, Gaurav Badwaik, Sachin Lohe, Kumudini Dhurvey, Formulation and Analytical Method Development of Atorvastatin–Berberine Solid Dispersion Tablets Using an Analytical Quality by Design-Oriented Approach, Int. J. of Pharm. Sci., 2026, Vol 4, Issue 11, 4000-4011. https://doi.org/10.5281/zenodo.24415729
 10.5281/zenodo.24415729