

We use cookies to ensure our website works properly and to personalise your experience. Cookies policy
University college of Engineering science and Technology JNTUH Hyderabad, Kukatpally 500085.
In this study Nanosponges incorporated topical gels were prepared by the solvent evaporation technique of Celecoxib. The Nanosponges formulations were prepared by solvent evaporation method employing Ethyl Cellulose, Eudragit RS100, ?-cyclodextrin rate retarding polymers using PVA as a co polymer. The compatibility of the drug with formulation components was established by Fourier Transform Infra-Red (FTIR) spectroscopy. The surface morphology, production yield, and drug entrapment efficiency of Nano sponges were examined. Shape and surface morphology of the Nanosponges were examined using scanning electron microscopy. Scanning electron microscopy revealed the porous, spherical nature of the Nanosponges. SEM photographs revealed the spherical nature of the Nano sponges in all variations; however, at higher ratios, drug crystals were observed on the nano sponge surface. Increase in the drug/polymer ratio (1:1 to 1:2) which is in increasing order due to the increase in the concentration of polymer but after certain concentration it was observed that as the ratio of drug to polymer was increased, the particle size decreased. The particle size was found in the range of 500-600 nm.The entrapment efficiency of different formulations were found in the range of 51.24±1.58% to 79.79±1.15%. Then the best nanosponge formulation F8 was further carried to topical gels by using Poloxamer 407, Chitosan, Sodium Alginate as gelling agents. So the in vitro release studies revealed that the formulation with higher concentration of Sodium Alginate penetration enhancer showed greater drug release upto 12hours . The Formulation F8G6 was found to be 99.46±1.28% in 12 hours, all these parameters are in optimized range for preparing a sustained release dosage form so showing itself as an optimized formulation.
Nanosponges are porous polymeric delivery systems that are small spherical particles with large porous surface. These are used for the passive targeting of cosmetic agents to skin, there by achieving major benefits such as reduction of total dose, retention of dosage form on the skin and avoidance of systemic absorption.1 Nanotechnology is defined as the manipulation of matter on an atomic, molecular, and supramolecular scale, which includes the design, production, characterization and application of various nanoscale materials in various potential areas, primarily in the field of medicine, to provide novel technological advances.2-4
Nanosponges display dimensions typically below 1-μm, featuring cavities whose polarity can be adjusted. This adjustability in size and polarity of nanosponges is achieved through variations in the ratio of cross-linker to polymer during synthesis.5,6 Nanosponges can exist in either a para-crystalline form and/or in crystal form, dependent upon specific conditions of the process used during their fabrication. The crystal structure of nanosponges significantly influences their ability to complex with drugs. The drug loading capacity of the formulation is primarily decided using the extent of crystallization.7-9
Celecoxib is an NSAID used to treat osteoarthritis, rheumatoid arthritis, acute pain, menstrual symptoms, and to reduce polyps is familial adenomatous polyposis. Celecoxib inhibits cyclooxygenase 2 (COX-2) enzyme, reducing pain and inflammation. It is important to note that though the risk of bleeding with celecoxib is lower than with certain other NSAIDS, it exists nonetheless and caution must be observed when it is administered to those with a high risk of gastrointestinal bleeding.10
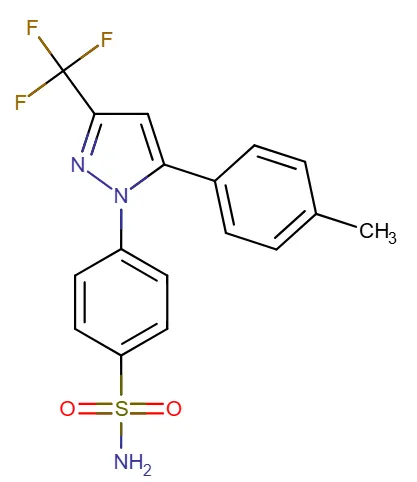
Fig 1: Structure of Celecoxib
Celecoxib is considered an ideal candidate for nanosponge-based drug delivery because of its poor aqueous solubility, variable oral bioavailability, and dose-dependent adverse effects. It is classified as a Biopharmaceutics Classification System (BCS) Class II drug, exhibiting high permeability but low water solubility (approximately 3–7 µg/mL at room temperature). The dissolution rate of celecoxib is the primary factor limiting its absorption after oral administration. Incorporation into nanosponges significantly enhances its apparent solubility and dissolution rate by encapsulating the drug within the porous three-dimensional polymeric network.11
MATERIALS
Celecoxib gift sample obtained from AR Life Sciences, Poloxamer 407 & Chitosan procured from Colorcon goa, Ethyl Cellulose, Eudragit RS100, Sodium Alginate, Propylene glycol, PVA & β-Cyclodextrin procured from B.M.R.Chemicals, Hyderabad, Methyl paraben, Propyl paraben & Triethanolamine procured from Narmada Chemicals, Hyderabad.
METHODOLOGY
Spectroscopic study:
Identification of pure drug:
Solubility studies12:
Solubility of Celecoxib was carried out in different solvents like- distilled water, 0.1 N HCl & 6.8 pH buffers 7.4 pH phosphate buffer and organic solvents like Ethanol & Dimethylformamide by taking excess amount of drug in different beakers containing the solvents. The mixtures were shaken for 24 hrs at regular intervals, filtered and analyzed spectrophotometrically.
Determination of absorption maximum (λmax):13
The wavelength at which maximum absorption of radiation takes place is called as λmax. This λmax is characteristic or unique for every substance and useful in identifying the substance. Accurately weighed 10mg Celecoxib separately was dissolved in a clean 10ml volumetric flask. The volume was made up to 10ml with 7.4pH phosphate buffer which will give stock solution-I with concentration 1000µg/ml. From the stock solution-I, 1ml was pipette out in 10ml volumetric flask. The volume was made up to 10ml using 7.4 pH phosphate buffer to obtain stock solution-II with a concentration 100µg/ml. From stock solution-II, 1ml was pipette out in 10ml volumetric flask. The volume was made up to 10ml using 7.4 pH phosphate buffer to get a concentration of 10µg/ml. This solution was then scanned at 200-400nm in UV-Visible double beam spectrophotometer to attain the absorption maximum (λ-max).
Construction of calibration curve:14
A stock solution of celecoxib (1000 µg/mL) was prepared by dissolving 10 mg of drug in 10 mL of pH 7.4 phosphate buffer. From this, a working standard solution (100 µg/mL) was prepared by diluting 1 mL of the stock solution to 10 mL with the same buffer. Aliquots of 0.2, 0.4, 0.6, 0.8, 1.0, and 1.2 mL of the working solution were further diluted to 10 mL with pH 7.4 phosphate buffer to obtain concentrations of 2, 4, 6, 8, 10, and 12 µg/mL, respectively. The absorbance of each solution was measured at 252 nm against pH 7.4 phosphate buffer as the blank, and a calibration curve of absorbance versus concentration was constructed.
Drug excipient compatibility study:15
Drug–excipient compatibility was evaluated using Fourier Transform Infrared (FT-IR) spectroscopy (Bruker Alpha T, Germany). Potassium bromide (KBr) pellets were prepared by thoroughly mixing the sample with KBr in a 1:100 ratio and compressing the mixture into pellets under a pressure of approximately 8 t/in². The FT-IR spectra were recorded over the wavenumber range of 4000–400 cm⁻¹ to identify any potential interactions between celecoxib and the excipients.
PREPARATION OF NANOSPONGES:16
Table No 1: Formulation table of Celecoxib loaded nanosponges
|
Ingredients |
F1 |
F2 |
F3 |
F4 |
F5 |
F6 |
F7 |
F8 |
F9 |
F10 |
F11 |
F12 |
|
Celecoxib (mg) |
100 |
100 |
100 |
100 |
100 |
100 |
100 |
100 |
100 |
100 |
100 |
100 |
|
100 |
100 |
100 |
100 |
100 |
100 |
100 |
100 |
100 |
100 |
100 |
100 |
|
|
Ethyl Cellulose (mg) |
50 |
100 |
150 |
200 |
-- |
-- |
-- |
-- |
-- |
-- |
-- |
-- |
|
Eudragit RS100 (mg) |
-- |
-- |
-- |
-- |
50 |
100 |
150 |
200 |
-- |
-- |
-- |
-- |
|
β-cyclodextrin (mg) |
-- |
-- |
-- |
-- |
-- |
-- |
-- |
-- |
50 |
100 |
150 |
200 |
|
DMF (ml) |
20 |
20 |
20 |
20 |
20 |
20 |
20 |
20 |
20 |
20 |
20 |
20 |
|
Water (ml) |
Q.S |
Q.S |
Q.S |
Q.S |
Q.S |
Q.S |
Q.S |
Q.S |
Q.S |
Q.S |
Q.S |
Q.S |
Nanosponges using different proportions of β-cyclodextrin, Ethyl Cellulose (mg), Eudragit RS100 (mg) as rate retarding polymer and co-polymers like polyvinyl alcohol were prepared by solvent evaporation method. Disperse phase consisting of Celecoxib (100mg) was dissolved in 20ml solvent (Dimethylformamide) and was slowly added to a definite amount of PVA in 100ml of aqueous continuous phase, prepared by using magnetic stirrer. The reaction mixture was stirred at 1000 rpm for three hours on a magnetic stirrer for 2hours. The nanosponges formed were collected by filtration through whatman filter paper and dried in oven at 50oC for 2 hours. The dried nanosponges were stored in vaccum desicator to ensure the removal of residual solvent.
Evaluation parameters of Nanosponges17
Drug Content
An accurately weighed quantity of each nanosponge formulation equivalent to 50 mg of celecoxib was dissolved in isotonic solution, filtered, suitably diluted, and analyzed at 252 nm using a UV–Visible spectrophotometer. Drug content was calculated from the calibration curve.
Entrapment Efficiency
Entrapment efficiency was determined by dispersing an accurately weighed quantity of celecoxib-loaded nanosponges equivalent to 100 mg in distilled water, followed by centrifugation at 500 rpm for 5 min. The drug content in the clear supernatant was measured at 252 nm using a UV–Visible spectrophotometer. The amount of entrapped drug was calculated by subtracting the free drug from the total drug content, and the entrapment efficiency (%) was calculated using the following equation:
Entrapment Efficiency (%) = [(Total Drug − Free Drug) / Total Drug] × 100
Scanning electron microscopy
The morphological features of prepared nanospongess are observed by scanning electron microscopy at different magnifications.
Particle size and shape
Average particle size and shape of the formulated nanospongess was determined by using Malvern Zetasizer ZS using water as dispersions medium. The sample was scanned for determination of particle size.
Preparation of Celecoxib Nanosponge Topical Gel
Celecoxib-loaded nanosponges were incorporated into a topical gel using Poloxamer 407, chitosan, and sodium alginate as gelling agents. The polymers were dispersed in water and allowed to hydrate overnight. Propylene glycol, methyl paraben, and propyl paraben were then added, followed by the dispersion of celecoxib-loaded nanosponges. The pH of the formulation was adjusted with triethanolamine to obtain a homogeneous gel. The composition of the nanosponge gel is presented in the corresponding table.
Table No 2: Composition of Celecoxib Nanosponge Gel
|
Ingredients |
F8G1 |
F8G2 |
F8G3 |
F8G4 |
F8G5 |
F8G6 |
F8G7 |
F8G8 |
F8G9 |
|
Nanosponges (mg) |
400 |
400 |
400 |
400 |
400 |
400 |
400 |
400 |
400 |
|
Poloxamer 407 |
400 |
600 |
800 |
|
|
|
|
|
|
|
Chitosan |
|
|
|
400 |
600 |
800 |
|
|
|
|
Sodium Alginate |
|
|
|
|
|
|
400 |
600 |
800 |
|
Propylene glycol |
20 |
20 |
20 |
20 |
20 |
20 |
20 |
20 |
20 |
|
Methyl paraben |
0.2 |
0.2 |
0.2 |
0.2 |
0.2 |
0.2 |
0.2 |
0.2 |
0.2 |
|
Propyl paraben |
0.05 |
0.05 |
0.05 |
0.05 |
0.05 |
0.05 |
0.05 |
0.05 |
0.05 |
|
Triethanolamine |
Q.S |
Q.S |
Q.S |
Q.S |
Q.S |
Q.S |
Q.S |
Q.S |
Q.S |
|
Distilled water |
Q.S |
Q.S |
Q.S |
Q.S |
Q.S |
Q.S |
Q.S |
Q.S |
Q.S |
Evaluation parameters of nanosponges incorporated topical insitu gels
pH:
The pH of the formulation was measured using a digital pH meter (Lab India, 6E404). The pH of the topical gel formulation should be between 3 to 9.
Drug content:
1 gm of the gel was dissolved in 100 ml of phosphate buffer pH 7.4, a sample (5ml) was taken from this solution and diluted to 25 ml. Fluconazole concentration was determined by measuring the absorbance at 264 nm using UV-visible Spectrophotometer (Shimadzu, UV2600).
Viscosity:
The viscosity of prepared gel was measured using Brookfield viscometer (Brookfield Engineering, spindle LV6) at different RPM viscosity. The measurement was made over a whole range of speed settings from 5-100 rpm with 10 seconds between two successive speeds.
Spreadability test:
The spreadability of the gel formulation was determined by using a sliding plate apparatus and by measuring the diameter of 1 gm of gel between horizontal plates after 1 minute. The standardized weight tied on the upper plate was 125 gm. An excess of gel is placed between two glass slides and a 1000 gm weight is placed on them for 5 minutes, to compress the sample to a uniform thickness. The bottom slide is anchored to the apparatus and weights are placed in the pan. The time in seconds needed to separate the two slides is taken as a measure of spreadability. A shorter time interval indicates better spreadability. Spreadability was determined by using a formula.
S = M*L/ T
S = Spreadbility, M = weight tied to the upper slide, L = length of a glass slide, T = Time taken to separate two slides (sec).
Diffusion Studies Procedure:18,19
In-vitro diffusion study of nanosponge formulation was performed through the cellulose membrane by using Franz diffusion cell. The receptor compartment was filled with 7.4 pH phosphate buffer and kept at 37 ± 0.5 °C with continuous stirring with help of a magnetic stirrer.100 mg of the gel was placed over the cellulose membrane. An interval of 1, 2, 3, 4, 5, 6, 7, and 8, 9 hour 1 ml sample was withdrawn and suitably diluted. The withdrawn sample was replaced with the same amount of 7.4 pH phosphate buffer to maintain the sink condition. Diluted samples were analyzed for fluconazole content with help of UV at 252 nm.
Kinetic Studies: Mathematical models:
Different release kinetic equations (zero-order, first-order, Higuchi's equation and Korsmeyer-peppas equation) were applied to interpret the release rate of the drug from matrix systems for the optimized formulation. The best fit with higher correlation (r2) was calculated.
Zero-order model:
Drug dissolution from dosage forms that do not disaggregate and release the drug slowly can be represented by the equation
Qt = Q0 + K0t
First Order Model:
The first order equation describes the release from systems where the dissolution rate is dependent upon the concentration of the dissolving species.
Log C= Log Co-kt/2.303
Higuchi model: The first example of a mathematical model aimed to describe drug release from a system was proposed by Higuchi in 1961. Initially conceived for planar systems, it was then sustained to different geometrics and porous systems. This model is based on the hypothesis that
Q = KH - t1/2
Korsmeyer-Peppas model: Korsmeyer et al.(1983) derived a simple relationship which described drug release from a polymeric system equation. To find out the mechanism of drug release, first60% drug release data were fitted in Korsmeyer-Peppas model,
Mt / M∞ = Ktn
Table No 3: Drug transport mechanisms suggested based on ‘n’ value.
|
S. No |
Release exponent |
Drug transport mechanism |
Rate as a function of time |
|
1 |
0.5 |
Fickian diffusion |
t -0.5 |
|
2 |
0.45 < n < 0.89 |
Non -Fickian diffusion |
t n-1 |
|
3 |
0.89 |
Case II transport |
Zero order release |
|
4 |
Higher than 0.89 |
Super case II transport |
t n-1 |
RESULTS & DISCUSSIONS
Celecoxib Characterization:
Solubility: Solubility of Celecoxib was carried out in different solvents like, methanol, Ethanol, 7.4 pH phosphate buffer, 0.1N HCl and 6.8 pH phosphate buffer. Solubility of the drug is more in 7.4pH Phosphate Buffer.
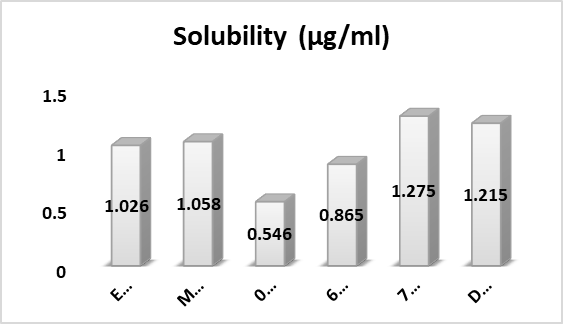
Fig2: Solubility studies of Celecoxib
Determination of absorption maximum (λmax): Determination of Celecoxib λ-max was done in 7.4pH Phosphate buffered Saline for accurate quantitative assessment of drug dissolution rate. The maximum absorbance of the Celecoxib in 7.4pH Phosphate Buffer was found to be 252 nm. The wavelength of 252 nm was selected for analysis of drug in dissolution media.
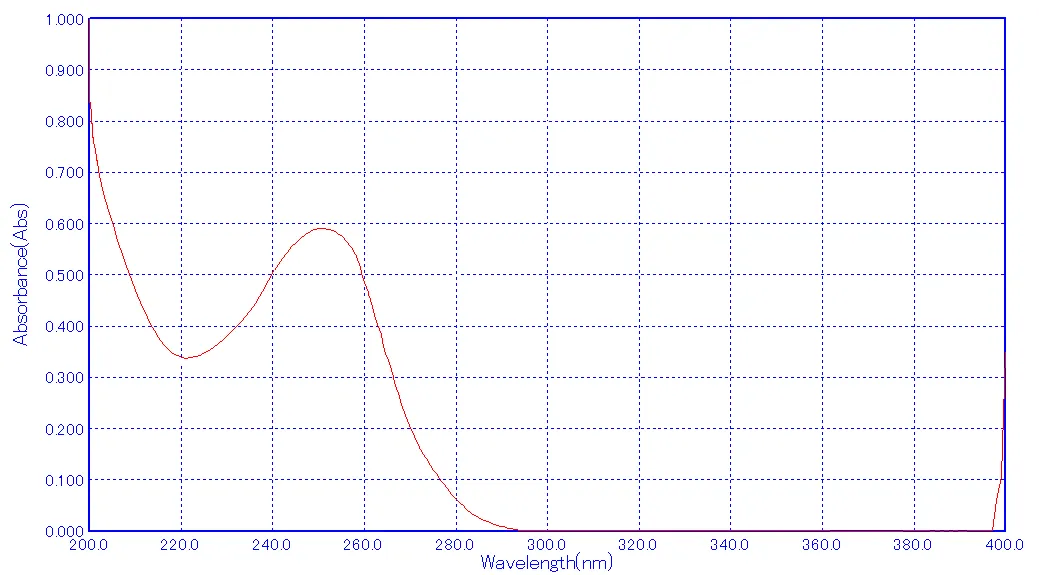
Fig.3: λ-max in 7.4pH Phosphate Buffer
Calibration curve: Table No 4: Calibration curve data of Celecoxib
|
Concentration (µg/ml) |
Absorbance |
|
0 |
0 |
|
2 |
0.144 |
|
4 |
0.289 |
|
6 |
0.435 |
|
8 |
0.586 |
|
10 |
0.735 |
|
12 |
0.853 |
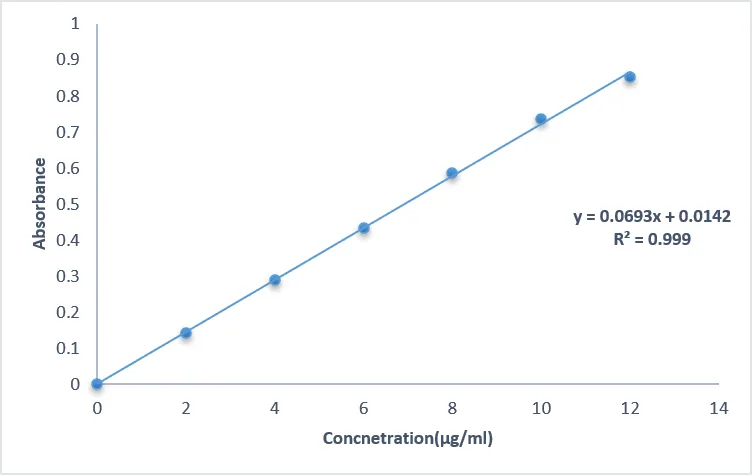
Fig.4:Calibration Curve of Celecoxib in 7.4pH Phosphate Buffer
The linearity was found to be in the range of 2-12μg/ml in 7.4 pH Phosphate Buffer. The regression value was closer to 1 indicating the method obeyed Beer-lambert’s law.
Drug excipient compatibility:
Drug and excipient compatibility was confirmed by comparing spectra of FT-IR analysis of Pure drug with that of various excipients used in the formulation. The functional groups that were presented in the pure drug were present in the optimized formulation with very minute changes.
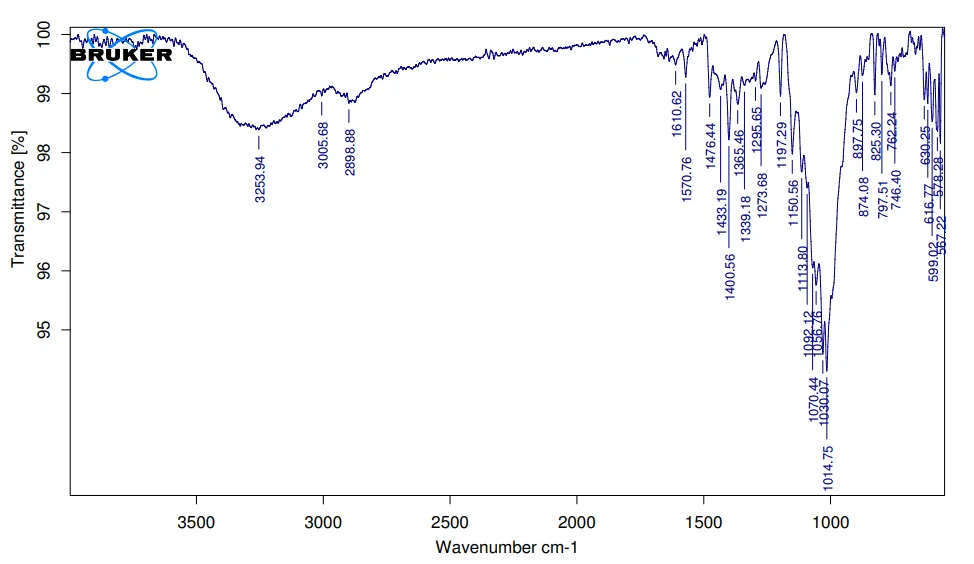
Fig.5.: FTIR Spectra of Pure Drug
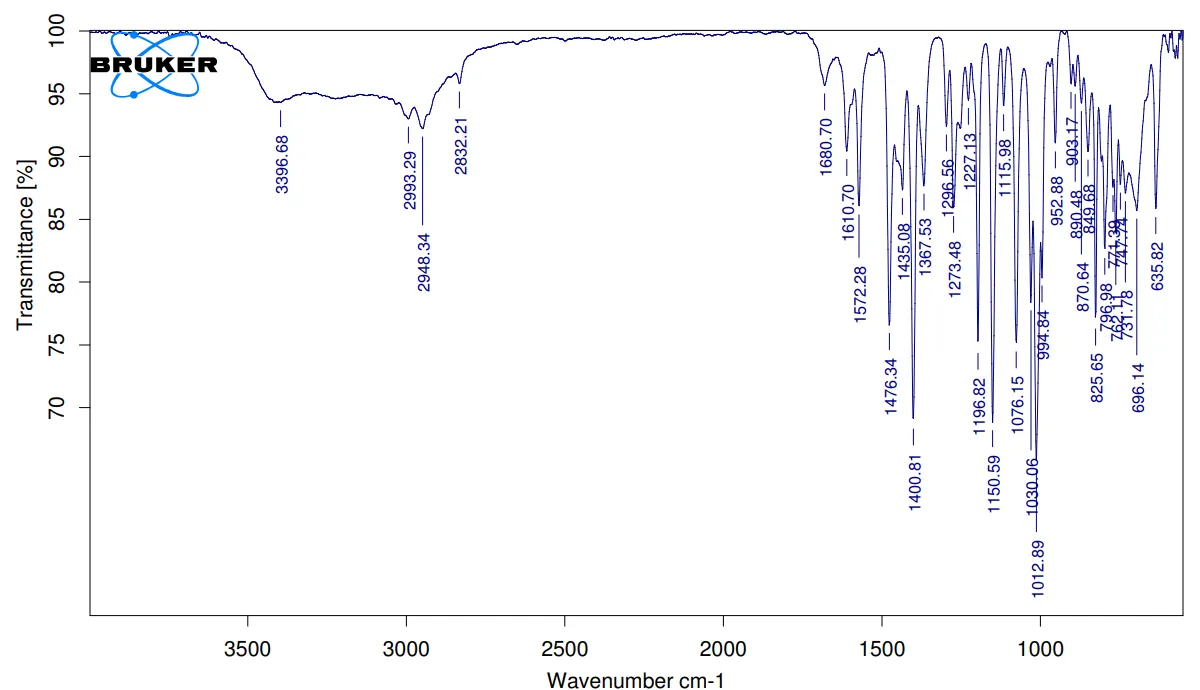
Fig.6: FTIR Spectra of drug and excipient
Drug Content: The Nanosuspension Formulation from F1-F12 was found to be in between 93.18±1.78%-99.26±1.46% and the drug content of Nano sponge formulation F8 which was having more drug content when compared to the remaining formulations.
Table.No.5: Drug content of formulations
|
Formulation code |
Drug Content |
|
F1 |
93.18±1.78% |
|
F2 |
94.24±1.48% |
|
F3 |
95.43±1.37% |
|
F4 |
95.19±1.15% |
|
F5 |
94.24±1.42% |
|
F6 |
96.43±1.39% |
|
F7 |
97.18±1.28% |
|
F8 |
99.26±1.46% |
|
F9 |
95.25±1.78% |
|
F10 |
96.41±1.25% |
|
F11 |
97.29±1.34% |
|
F12 |
98.57±1.18% |
Entrapment efficiency: The entrapment efficiency of formulation F1-F12 was found in the range of 51.24±1.58% to 79.79±1.15%
Table No 6: % Entrapment Efficiency of Nano sponges
|
Formulation code |
Entrapment efficiency % |
|
F1 |
51.24±1.58% |
|
F2 |
57.83±1.46% |
|
F3 |
63.48±1.21% |
|
F4 |
68.04±1.78% |
|
F5 |
64.16±1.66% |
|
F6 |
66.75±1.30% |
|
F7 |
74.15±1.59% |
|
F8 |
79.79±1.15% |
|
F9 |
64.54±1.28% |
|
F10 |
68.74±1.46% |
|
F11 |
73.46±1.45% |
|
F12 |
75.48±1.29% |
Morphology determination by scanning electron microscopy (SEM):
Scanning electron microscopy (SEM) was used to determine the Morphology of the prepared nano sponges. The surface morphology of the Celecoxib nanosponge F8 was studied by SEM. Surface morphology of the Celecoxib nanosponge was found to be porous, irregularly shaped structures.
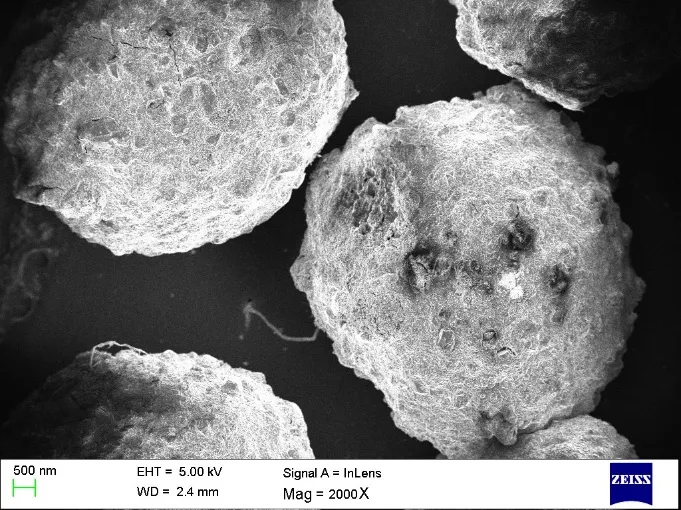
Fig.7: Nanosponges structure optimized formulation (F8)
Particle size analysis of Nanosponges:
The particle size of the nanosponges was determined by optical microscopy. As the ratio of polymer was increased, the mean particle size of Celecoxib nanosponges had also decreased. The significant decrease may be due to the increase in the viscosity of the droplets. Celecoxib nanosponges having a size range of 510 to 600 nm (nanometer) with normal frequency distribution was obtained.
Table No.7: Mean Particle size of Nano sponges
|
Formulation code |
Mean Particle size (nm) |
|
F1 |
540 nm |
|
F2 |
520 nm |
|
F3 |
580 nm |
|
F4 |
550 nm |
|
F5 |
570 nm |
|
F6 |
600 nm |
|
F7 |
550 nm |
|
F8 |
500 nm |
|
F9 |
590 nm |
|
F10 |
530 nm |
|
F11 |
510 nm |
|
F12 |
540 nm |
pH of the formulated gel
The pH of gel formulation was determined by using the pH meter. The results were reported in Table. The pH of all formulations was in the range compatible with the normal pH range of the skin. Hence the preparation was non-irritant.
Table No.8: pH of the formulated gel
|
Formulation Code |
pH
|
|
F8G1 |
6.8 |
|
F8G2 |
6.7 |
|
F8G3 |
6.9 |
|
F8G4 |
7.1 |
|
F8G5 |
6.9 |
|
F8G6 |
7.0 |
|
F8G7 |
7.2 |
|
F8G8 |
7.1 |
|
F8G9 |
6.9 |
Drug Content: The prepared formulation was analyzed for drug content. It was observed that the drug content in the prepared nanosponges gel was satisfactory and the drug was uniformly distributed in all the formulation. The percentage of drug content was found to be between 84.15% to 98.27%.
Table No.9: Drug Content
|
Formulation Code |
Drug Content |
|
F8G1 |
84.15% |
|
F8G2 |
91.27% |
|
F8G3 |
95.74% |
|
F8G4 |
88.37% |
|
F8G5 |
94.11% |
|
F8G6 |
98.27% |
|
F8G7 |
87.15% |
|
F8G8 |
92.16% |
|
F8G9 |
96.45% |
Viscosity
The viscosity of gel was measured by Brookfield viscometer with spindle LV6. The result shows a decrease in viscosity as a shear rate (RPM) is increased which indicates Gel has pseudoplastic flow. The result indicates the viscosity of gel formulation was consistent.
Table No.10: Viscosity values
|
Formulation Code |
Viscosity |
|
|
RPM |
Viscosity(cp) |
|
|
F8G1 |
20 40 90 100 |
976 762 571 429 |
|
F8G2 |
20 40 90 100 |
1026 867 725 612 |
|
F8G3 |
20 40 90 100 |
945 798 671 526 |
|
F8G4 |
20 40 90 100 |
1021 837 712 659 |
|
F8G5 |
20 40 90 100 |
992 810 699 584 |
|
F8G6 |
20 40 90 100 |
975 799 612 415 |
|
F8G7 |
20 40 90 100 |
1046 937 765 562 |
|
F8G8 |
20 40 90 100 |
1003 916 798 610 |
|
F8G9 |
20 40 90 100 |
976 807 716 629 |
Spreadability: Spreadability is an important characteristic of topical formulation and it’s responsible for correct dosage transfer to the target site. Spreadability is an important factor to consider in the formulation of gel. The viscosity and spreadability are inversely proportional to each other.
Table No.11: Spreadability
|
Formulation Code |
Spreadability (gm.cm/sec) |
|
F8G1 |
7.45 |
|
F8G2 |
7.29 |
|
F8G3 |
7.12 |
|
F8G4 |
7.26 |
|
F8G5 |
7.17 |
|
F8G6 |
7.34 |
|
F8G7 |
7.03 |
|
F8G8 |
7.12 |
|
F8G9 |
7.22 |
In vitro diffusion studies of prepared Nanosponges:
In vitro release studies were performed in triplicate using USP basket method at 50 rpm and 37±0.2oC in 900ml of phosphate buffer (pH 7.4), 100 mg of the formulated Nanosponge gels is used for each experiment. Samples were taken at appropriate time intervals for 1,2,3,4,5,6,7,8,9, hour. The samples were measured spectrophotometrically at 252 nm. Fresh dissolution medium was replenished each time when sample is withdrawn to compensate the volume. By comparing the above diffusion studies of formulations F8G1-F8G9 Maximum drug release was found in F8G6 formulation containing Drug: Chitosan in 1:2 ratio. So F8G6 formulation was taken as the optimized formulation, and drug release kinetics were performed for F8G6 formulation.
Table No.12: Percentage of drug release of Nanosponge gels (F8G6)
|
Time |
%CDR |
||||||||
|
(hrs) |
F8G1 |
F8G2 |
F8G3 |
F8G4 |
F8G5 |
F8G6 |
F8G7 |
F8G8 |
F8G9 |
|
0 |
0 |
0 |
0 |
0 |
0 |
0 |
0 |
0 |
0 |
|
1 |
33.85 |
25.01 |
18.24 |
26.03 |
19.45 |
15.20 |
25.84 |
20.10 |
15.45 |
|
2 |
44.21 |
33.69 |
24.48 |
29.84 |
27.87 |
22.47 |
39.18 |
27.18 |
19.20 |
|
3 |
51.68 |
41.42 |
39.65 |
37.17 |
38.52 |
35.85 |
43.78 |
33.06 |
26.36 |
|
4 |
59.47 |
48.16 |
45.37 |
48.75 |
45.75 |
46.06 |
51.21 |
48.81 |
35.18 |
|
5 |
65.20 |
55.18 |
51.12 |
59.185 |
49.61 |
58.38 |
59.47 |
53.45 |
48.20 |
|
6 |
79.39 |
69.38 |
59.36 |
67.78 |
56.58 |
65.52 |
69.20 |
61.72 |
59.76 |
|
7 |
87.16 |
79.45 |
67.45 |
75.69 |
65.51 |
73.41 |
78.48 |
67.36 |
67.98 |
|
8 |
98.85 |
85.51 |
78.78 |
83.27 |
78.20 |
79.67 |
85.65 |
79.10 |
73.39 |
|
9 |
|
92.48 |
83.85 |
92.84 |
83.15 |
85.84 |
90.27 |
85.45 |
80.24 |
|
10 |
|
99.37 |
93.45 |
98.26 |
91.37 |
90.78 |
98.48 |
93.84 |
88.45 |
|
11 |
|
|
98.37 |
|
98.75 |
94.85 |
|
98.20 |
95.61 |
|
12 |
|
|
|
|
|
99.46 |
|
|
98.82 |
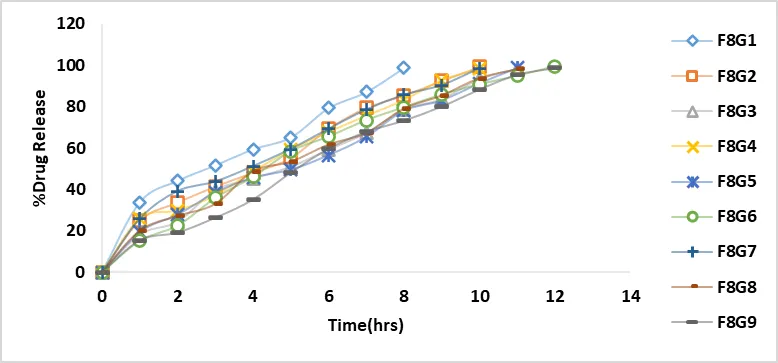
Fig.8 : In vitro drug release of formulations F8G1- F8G9
Release Kinetics Analysis for Optimized Formulation F8G6:
The optimized formulation F8G6 has coefficient of determination (R2) values of 0.967, 0.805, 0.932 and 0.713 for Zero order, First order, Higuchi and Korsmeyer Peppas respectively. A good linearity was observed with the First order, indicates the rate of drug release through the mode of diffusion and to further confirm the diffusion mechanism, data was fitted into the Korsmeyer Peppas equation which showed linearity with n value of 1.223 for optimized formulation. Thus n value indicates the super case II transport mechanism, the release kinetics of the optimized formulation was best fitted into Zero order with the super case II transport mechanism.
Zero Order
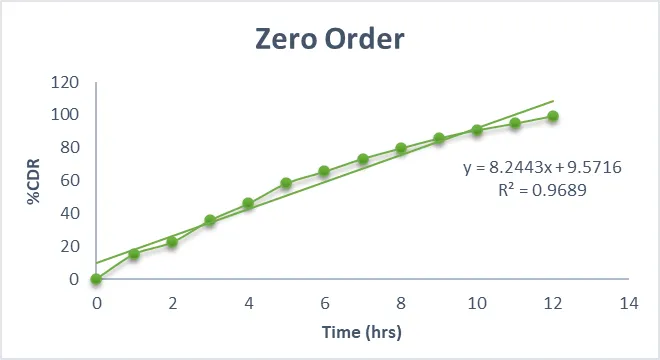
Fig.9: Zero Order Plot for F8G6
First Order
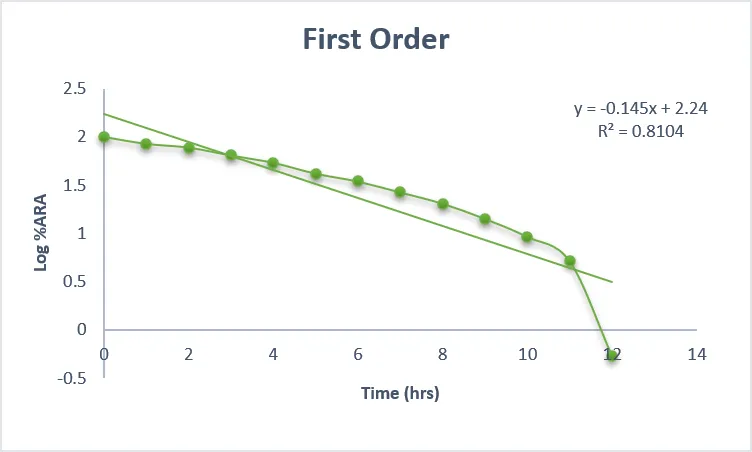
Fig.10: First Order Plot for F8G6
Higuchi Plot
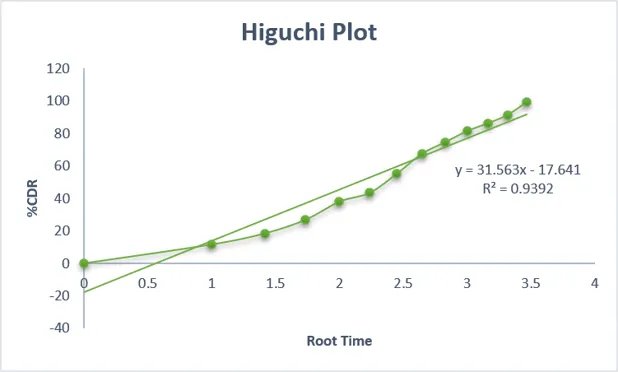
Fig.11: Higuchi Plot for F8G6
Peppas Plot
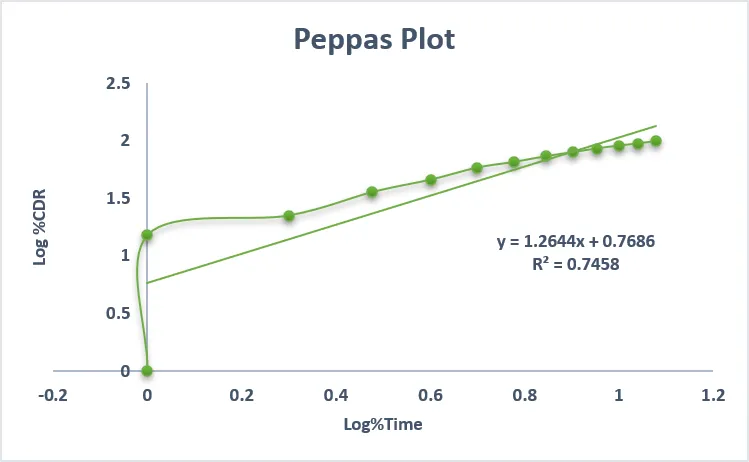
Fig.12: Peppas Plot for F8G6
Regression values of F8G6:
Table No.13: Regression values
|
S.NO |
Zero order |
First order |
Higuchi |
Peppas |
Peppas |
|
Code |
R² |
R² |
R² |
R² |
n |
|
0.967 |
0.805 |
0.932 |
0.713 |
1.223 |
SUMMARY AND CONCLUSION
Celecoxib-loaded nanosponges were successfully prepared by the solvent evaporation method using β-cyclodextrin, ethyl cellulose, Eudragit RS100, and polyvinyl alcohol. FT-IR analysis confirmed the compatibility of the drug with the selected excipients, while SEM images demonstrated the spherical morphology of the nanosponges. Among all formulations, F8 exhibited the best performance, with a particle size of 500 nm, drug content of 99.26 ± 1.46%, and entrapment efficiency of 79.79 ± 1.15%. The optimized drug-to-polymer ratio of Celecoxib RS100 (1:2) provided enhanced drug loading and reduced particle size.
The optimized nanosponge formulation (F8) was successfully incorporated into a topical gel. Among the gel formulations, F8G6, containing 800 mg of chitosan, showed optimum pH, viscosity, spreadability, drug content, and sustained drug release (99.46 ± 1.28% over 12 h). Drug release kinetic analysis indicated that the release profile best followed the Higuchi diffusion model, with an R² value of 0.932, while the Korsmeyer–Peppas release exponent (n = 1.223) suggested a Super Case II transport mechanism, indicating polymer relaxation and erosion-controlled release. Overall, the developed celecoxib nanosponge gel demonstrated sustained drug release and favorable physicochemical characteristics, highlighting its potential as an effective topical drug delivery system for prolonged anti-inflammatory therapy.
REFERENCES


Godike Prathyusha, Dr. M. Sunitha Reddy, Dr. K. Anie Vijetha, Formulation And In-Vitro Evaluation of Celecoxib Nanosponges Loaded Topical Gels, Int. J. of Pharm. Sci., 2026, Vol 4, Issue 9, 2065-2081, https://doi.org/10.5281/zenodo.22797040
 10.5281/zenodo.22797040