

We use cookies to ensure our website works properly and to personalise your experience. Cookies policy
Department of Pharmaceutics, Shree Santkrupa College of Pharmacy, SUK- Ghogaon - Karad, Maharashtra, India-41511.
The present study aimed to formulate, optimise, and evaluate Butoconazole-loaded nanosponges incorporated into a topical gel to enhance antifungal therapy. Butoconazole-loaded nanosponges were prepared by the emulsion solvent diffusion method using Ethyl Cellulose and Polyvinyl Alcohol as polymers. A 32 full factorial design was employed to optimize the formulation variables. Particle size and entrapment efficiency were selected as dependent responses. The prepared nanosponges were evaluated for particle size, entrapment efficiency, zeta potential, FTIR, SEM, production yield and in vitro drug release. The optimized formulation (F7) exhibited a particle size of 152.3nm, entrapment efficiency of 92%, zeta potential of -21.4 mV, and production yield of 91.12%. SEM analysis confirmed spherical porous morphology, while FTIR and DSC studies indicated compatibility between the drug and excipients. The optimized nanosponge formulation was incorporated into gel and evaluated for pH, viscosity, spreadability, in-vitro drug release, and antifungal activity. The gel exhibited suitable physicochemical properties with sustained drug release (86.74% at 8 h) following zero-order kinetics (R2= 0.9968) and demonstrated significant antifungal activity against Trichophyton rubrum. The findings suggest that Butoconazole-loaded nanosponges gel could serve as a promising topical delivery system for effective and controlled antifungal therapy.
Nanotechnology has emerged as a promising approach to enhance the bioavailability and dissolution rate of numerous drugs with poor solubility in water. Nanotechnology is an advanced technology used in pharmaceutical formulations to improve drug delivery systems. Some of these approaches involve altering the crystallinty of the drug or developing new nanomaterials that can act as a drug carrier to attain controlled release.1 Nanotechnology is a critical and interesting strategy because existing formulations have several concerns, including significant side effects, inaccurate targeting and solubility and stability complications.2 Nanosponge belongs to the new class of having nano-sized particles that are filled with therapeutic agents with specific substances. Nanosponges are spongy polymeric delivery systems that are tiny, sphere-shaped particles with a highly porous surface.3 Due to these advantages, nanosponges are widely used in gels, creams, and lotions for topical drug delivery.4, 5 The nanosponges are prepared by using different polymers based on the emulsion solvent diffusion method. Their great stability, high carrier potential, and ability to include both hydrophilic and hydrophobic substances make them a great choice for this novel delivery.6, 7 The use of nanosponges for selective and dispersed therapeutic agent delivery is the driving force behind research in this field. Butoconazole is a potent antifungal and belongs to the BCS II class.8, 9 Being an antifungal agent, it also requires long-term treatment and may increase the risk of side effects after systemic administration. To prevent these side effects, a topical butoconazole preparation should be made. Nanosponges-loaded topical gel improves patient compliance. A topical novel drug delivery device based on nanosponges has the potential to reduce effects associated with traditional delivery systems.10
2. MATERIALS AND METHODS:
2.1 Materials:
Butoconazole was obtained as a gift sample from Yarrow Chem Products, Mumbai. Other excipients like ethyl cellulose, polyvinyl alcohol, dichloromethane, carbopol 934, and triethanolamine were procured from Research Lab Fine Chem Industries, Mumbai and Loba Chemicals, Mumbai. All the chemicals used were analytical grade and were used as obtained.
2.2 Methods:
2.2.1 Preformulation studies:
Preformulation is the initiative in designing or development of a rational dosage form of a drug. Pre-formulation studies were performed to determine the physicochemical properties of the drug moiety that would affect the stability, safety, and efficacy of the dosage form.8-11
2.2.1.1. Organoleptic properties:
The drug samples were studied for external appearance, like colour, odour and texture, by using the visual method. 11, 12
2.2.1.2. Melting Point:
The melting point of butoconazole was determined by taking a small amount of sample into a sealed capillary tube, tying the thermometer with a rubber band, and immersing the end of the tube in a Thiele’s tube. Heating is initiated, and thus the temperature range at which the sample melts can be observed.13, 14
2.2.1.3 Solubility:
The solubility of butoconazole in methanol, water, dichloromethane and chloroform was determined by the shake-flask method. The examined compound dissolves in solid excess 1-0 ml respective solvent. The solutions were stirred for 48 hours in the magnetic stirrer under thermo stated circumstances until the solubility equilibrium. To separate phases, the solutions were filtered. Aliquots were diluted; the absorption was measured with uv-Spectrophotometer. The concentrations of the aliquots were calculated.15-19
2.2.1.4 Ultraviolet-visible:
Determination of Absorption Maxima (λmax):
Stock solution of PTX (100µg/ml) was prepared by dissolving 10 mg of drug in 30 ml of methanol and diluted to 100 ml with Methanol: PBS (30:70). The working standard solutions were scanned in the UV range (between 200-400 nm) to obtain the Absorption Maxima.20
Method for the Preparation of Standard Curve:
Butoconazole (10 mg) was accurately weighed and dissolved in 30 mL of methanol. The volume was made up to 100 ml with 30:70 methanol: PBS to give a stock solution of 100 µg/ml. Aliquots of 100 µg/ml solution were transferred into different 10 ml volumetric flasks, and the volume was adjusted with 30:70 methanol: PBS to give final concentrations of 2.0-20.0 µg/ml. The absorbance was measured at 254 nm against 3 mL methanol made up to 10 mL with 30:70 methanol: PBS as a blank.21
2.2.1.5 Fourier Transform Infrared Spectroscopy (FTIR):
Infrared spectrum patterns are crucial for understanding how a medicine interacts with other chemicals in a formulation. Using an IR spectrophotometer (BRUKER Alpha-II), an infrared analysis of the drugs and excipients was conducted to investigate possible chemical interactions between butoconazole, ethyl cellulose and polyvinyl alcohol. IR spectra from pure butoconazole and excipient combinations were scanned in the 4000-600 cm-1 region.22
2.2.1.6 Drug-Excipient Compatibility Studies:
A critical component of the pre-formulation phase in pharmaceutical development is the assessment of drug-excipient compatibility. Interactions between the active pharmaceutical ingredient (API) and excipients can markedly affect the drug’s stability, bioavailability, and the overall physicochemical properties of the final formulation. Compatibility studies are conducted to support the strategic selection of suitable excipients by identifying any potential interactions that might compromise the formulation’s integrity. The main aim of these investigations is to detect, evaluate, and predict possible physical or chemical interactions between the drug and the excipients. The insights gained from these studies are instrumental in determining their influence on the quality, performance, and manufacturability of the final dosage form.23
2.2.2 Preparation of butoconazole loaded nanosponges by using Emulsion Solvent Diffusion Method.
Table 1: Formulation of Butoconazole loaded nanosponges
|
Sr. No |
Formulation code |
Butoconazole (mg) |
Ethyl cellulose (mg) |
Polyvinyl Alcohol (g) |
DCM (ml) |
Distilled water |
|
1 |
F1 |
100 |
100 |
0.5 |
30 |
100 |
|
2 |
F2 |
100 |
200 |
1 |
30 |
100 |
|
3 |
F3 |
100 |
300 |
1.5 |
30 |
100 |
|
4 |
F4 |
100 |
100 |
0.5 |
30 |
100 |
|
5 |
F5 |
100 |
200 |
1 |
30 |
100 |
|
6 |
F6 |
100 |
300 |
1.5 |
30 |
100 |
|
7 |
F7 |
100 |
100 |
0.5 |
30 |
100 |
|
8 |
F8 |
100 |
200 |
1 |
30 |
100 |
|
9 |
F9 |
100 |
300 |
1.5 |
30 |
100 |
Table 1 illustrates the formulation of butoconazole loaded nanosponges using the emulsion solvent diffusion method. In this formulation, two different polymers, such as ethyl cellulose, were used for the nanosponges formulation. A total of nine formulations were prepared for the further optimisation process. Two phases were used; one is organic, and the other is the aqueous phase. The organic phase, which contained the drug and polymer mixture, was placed in 30 ml of DCM, and the aqueous phase, which contained PVA, was placed in 100 ml of distilled water. The aqueous phase was added in a drop wise manner to the dispersed phase on a magnetic stirrer at 1000-5000 rpm; after two hours of stirring, nanosponges were collected by the filtration method and dried in an oven at 40 °C for 24 hours. Nanosponges were stored in vacuum desiccators for the removal of moisture.24-30
2.2.3 Preparation of Butoconazole nanosponges’ topical gel
Carbopol 934 was first allowed to soak in water for 2 hours to initiate gel formation, followed by dispersion through agitation at 500 rpm using a magnetic stirrer to obtain a uniform mixture. Triethanolamine was then added to adjust and neutralise the pH of the dispersion. Subsequently, the previously prepared optimized nanosponge suspension was incorporated into the gel base.31, 32
2.2.4 Evaluation of nanosponges:
2.2.4.1 Particle size:
The average particle size of optimized nanosponges formulation was determined by a dynamic light scattering analyzer by using Brookhaven Zetasizer (Brookhaven Instrument Ltd.). The dried nanosponges were added to distilled water to get proper light scattering intensity for Butoconazole nanosponges.33
2.2.4.2 Drug Entrapment Efficiency:
Entrapment efficiency refers to the percentage of the total drug that is effectively enclosed or entrapped within the nanosponge system. Higher EE% values indicate better formulation performance. A UV-visible spectrophotometer was employed to determine the absorbance of the filtrate at 254 nm following the proper dilution of 10 mg of precisely weighed nanosponges dispersed in 100mL of phosphate buffer(pH7.4) and then filtered through filter paper.34, 35
𝑬𝑬 (%) = (𝑻𝒐𝒕𝒂𝒍 𝑫𝒓𝒖𝒈−𝑼𝒏𝒆𝒏𝒕𝒓𝒂𝒑𝒑𝒆𝒅𝑫𝒓𝒖𝒈)/ (𝑻𝒐𝒕𝒂𝒍 𝒅𝒓𝒖𝒈) × 𝟏𝟎𝟎
2.2.4.3 Zeta potential:
The zeta potential was analyzed for the determination of the movement of the particle in an electric field and the particle charge. In the present work, nanosponges were diluted 10 times with distilled water and analyzed by Brookhaven Zestasizer, (Brookhaven Instrument Ltd.).36
2.2.4.4 Fourier Transform Infrared Spectroscopy (FTIR):
IR spectroscopy, particularly FTIR (Fourier Transform Infrared Analysis), is a crucial analytical technique used for characterizing nanosponges. It provides insights into their chemical structure, functional groups, and interactions with encapsulated drug.37
2.2.4.5 Surface Morphology by Scanning Electron Microscopy (SEM):
Scanning Electron Microscopy (SEM) was employed to investigate the surface morphology and structural characteristics of the prepared Butoconazole-loaded nanosponges. The nanosponges were thoroughly dried to eliminate any residual moisture before imaging. The dried samples were mounted onto glass slides and placed under vacuum conditions. SEM imaging was conducted at an accelerating voltage of 20.0 kV, and micrographs were captured at various magnifications to examine the shape, surface texture, and morphological features of the nanosponges.38
2.2.4.6 Production Yield:
Butoconazole loaded nanosponges were weighed after drying. Percentage yield was calculated by 39
𝑷𝒓𝒐𝒅𝒖𝒄𝒕𝒊𝒐𝒏 𝒀𝒊e𝒍𝒅 =
𝑷𝒓𝒂𝒄𝒕𝒊𝒄𝒂𝒍 𝒎𝒂𝒔𝒔 𝒐𝒇 𝒏𝒂𝒏𝒐𝒔𝒑𝒐𝒏𝒈𝒆𝒔
𝑻𝒉𝒆𝒓𝒐𝒕𝒊𝒄𝒂𝒍 𝑴𝒂𝒔𝒔
×𝟏𝟎0
2.2.5 Evaluation of Gel
2.2.5.1 Physical Evaluation
The clarity and homogeneity of the formulation were observed. pH of the formulated gel was measured using a digital pH meter.40
2.2.5.2 Viscosity
The viscosity of the prepared topical gel was measured using a Brookfield viscometer set at a spindle speed of 100 rpm and maintained at a temperature of 25 degrees Celsius. All measurements were performed in triplicate for accuracy.41
2.2.6.3 pH determination
The pH of the formulated butoconazole loaded Nanosponge based topical gel was measured using a pH meter by immersing the electrode into the gel and recording the reading after a stabilization period of two minutes.42
2.2.6.4 Spreadability
Achieving optimal spreadability is a crucial characteristic for an ideal gel formulation. Spreadability refers to the ease with which the gel spreads over the affected area of the skin. It plays a significant role in ensuring the effective delivery of therapeutic agents. Spreadability is assessed by measuring the time (in seconds) required for two glass slides, placed with a layer of gel between them, to separate under a specified weight. A shorter separation time indicates superior spreadability of the formulation. The following mathematical expression was used to determine spreadability.43, 44
2.2.6.5 In-vitro drug release study
The in-vitro drug release study of Butoconazole nanosponge gel formulations (F1–F9) was carried out using a Franz diffusion cell. The dialysis membrane was soaked in phosphate buffer pH 6.8 before use and mounted between the donor and receptor compartments. An accurately weighed quantity of gel equivalent to the required drug dose was placed in the donor compartment. The receptor compartment was filled with phosphate buffer pH 6.8 and maintained at 37 ± 0.5°C under continuous magnetic stirring. At predetermined time intervals (1, 2, 3, 4, 5, 6, 7, and 8 h), aliquots of the receptor medium were withdrawn and replaced with an equal volume of fresh buffer to maintain sink conditions. The collected samples were analysed using a UV–Visible spectrophotometer at the λmax of Butoconazole. The cumulative percentage drug release was calculated and recorded for all formulations (F1–F9). This study was performed to evaluate the drug release behaviour and compare the release profiles of the prepared nanosponge gel formulations.45
Kinetics of drug release
In-vitro release profile data were utilised to confirm the validity of the kinetic equation and to determine the drug release control mechanism.
A) Zero-Order Kinetics: Q t=Q0 + k0.t
B) First-order Kinetics: Log Qt = logQ0 + k1.t/2.303
C) The Higuchi Model: Q t / Q∞ = k.t1/2
D) Korsmeyer and Peppas Model: Mt / M∞= k.tn.
2.2.6.6 Antifungal activity by well diffusion method
Fungal inoculums were prepared using freshly cultured fungal strains. Approximately 15 mL of sterile Sabouraud’s agar medium (HiMedia) was poured into sterilized petri dishes and allowed to solidify at room temperature. After solidification, 100 µL of fungal broth culture was uniformly spread over the agar surface using a sterile spreader to obtain an even microbial lawn. Sterile cork borers were used to prepare wells of about 6 mm diameter in the agar plates. Test samples were prepared in chloroform at a concentration of 100 µL/mL, and 100 µL of each sample solution was carefully introduced into the respective wells. The standard drug solution was also added similarly. The plates were then incubated at 37°C for 24 hours under suitable conditions. Miconazole at a concentration of 1 mg/mL was used as the positive control, whereas DMSO served as the negative control. Antifungal activity was determined by measuring the diameter of the zone of inhibition produced around each well after incubation.46, 47
3. RESULTS AND DISCUSSION
3.1 Preformulation study of Butoconazole:
Preformulation study appears to be a crucial component in the appropriate formulation of pharmaceutical dosage forms for the medication. Preformulation studies are primarily conducted to generate relevant data for the development of stable. Compliant and effective dosage forms.
3.1.1 Organoleptic properties
The organoleptic properties of Butoconazole were evaluated by visual inspection. The drug was found to be white in color with an odourless to faint odour appearance. No visible impurities were observed in the sample. These findings confirmed the acceptable physical characteristics and purity of the drug, indicating its suitability for formulation development.
3.1.2 Melting point
The melting point of pure butoconazole was found to be 163°C, which is found to be nearly the standard melting range of butoconazole. This indicates the gifted samples obtained were of pure quality.
3.1.3 Solubility:
Butoconazole was found to be insoluble in water, soluble in methanol and chloroform, and freely soluble in dichloromethane. The solubility profile supported the selection of suitable solvents for nanosponge preparation.
3.1.4 UV Spectroscopic analysis
a) Determination of λmax
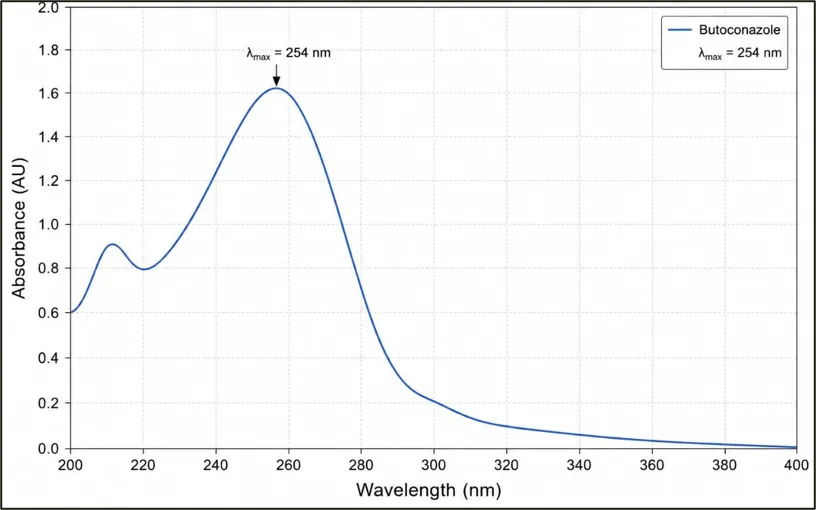
Fig.1 UV-visible absorption spectrum of Butoconazole
The λmax of Butoconazole was observed at 254 nm. The UV-visible absorption spectrum of Butoconazole is presented in Fig.1
b) Calibration Curve of the drug Butoconazole
The calibration curve of Butoconazole was prepared in methanol: PBS (30:70). The absorbance values were measured at 254 nm over the concentration range of 0–10 μg/ml. A linear increase in absorbance was observed with increasing drug concentration. The calibration curve followed Beer-Lambert's law over the studied concentration range, as shown in Fig. 2, confirming the reliability and accuracy of the analytical method for quantitative estimation of Butoconazole.
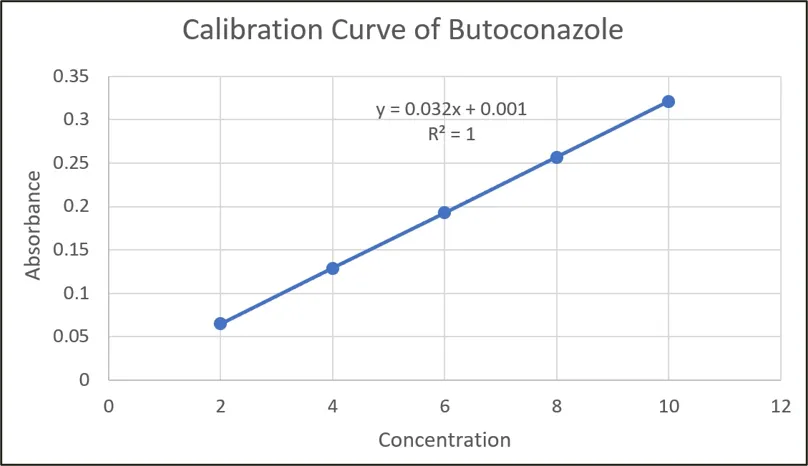
Fig.2 Graph of Standard Calibration Curve of Butoconazole
3.1.5 FTIR spectroscopy study:
a) FTIR of Pure Butoconazole drug
The FTIR spectrum of Butoconazole was recorded using an FTIR spectrophotometer over the wavenumber range of 4000 to 450 cm-1. The FTIR spectrum showed characteristic peaks corresponding to O-H stretching, C-H stretching, C=N stretching, C=C stretching, C-N stretching, C-O-C stretching, and C-Cl stretching vibrations are illustrated in Fig.3. The presence of all characteristic peaks confirmed the identity and purity of Butoconazole and indicated the absence of any structural alteration in the drug molecule.
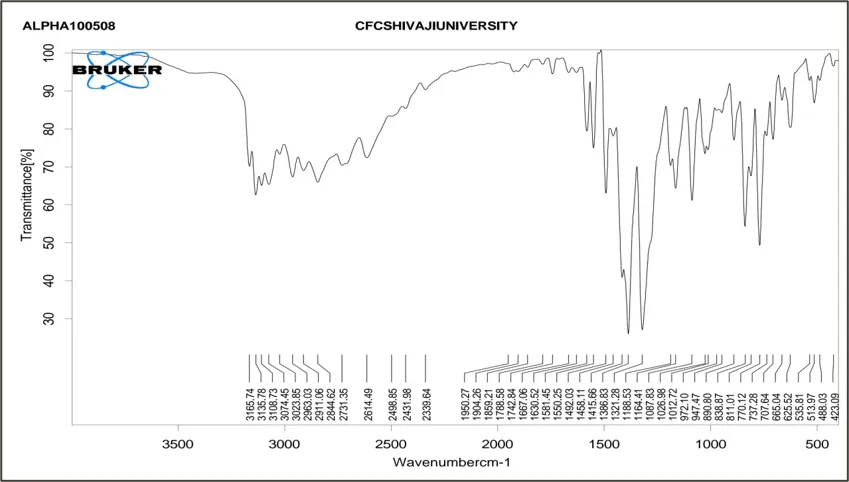
Fig.3 FTIR Spectrum of Pure Butoconazole Drug
3.1.6 Drug-Excipient Compatibility Study
a) FTIR of Physical Mixture of EC+PVA+Drug
FTIR spectroscopy of the physical mixture containing Butoconazole, Ethyl Cellulose, and Polyvinyl Alcohol was performed to investigate possible drug-excipient interactions and to confirm compatibility is shown in Fig.4. The characteristic peaks of Butoconazole were retained in the physical mixture without significant shifting or disappearance. This observation indicated the absence of any chemical interaction between the drug and excipients. Therefore, Ethyl Cellulose and Polyvinyl Alcohol were considered compatible with Butoconazole and suitable for nanosponge formulation.
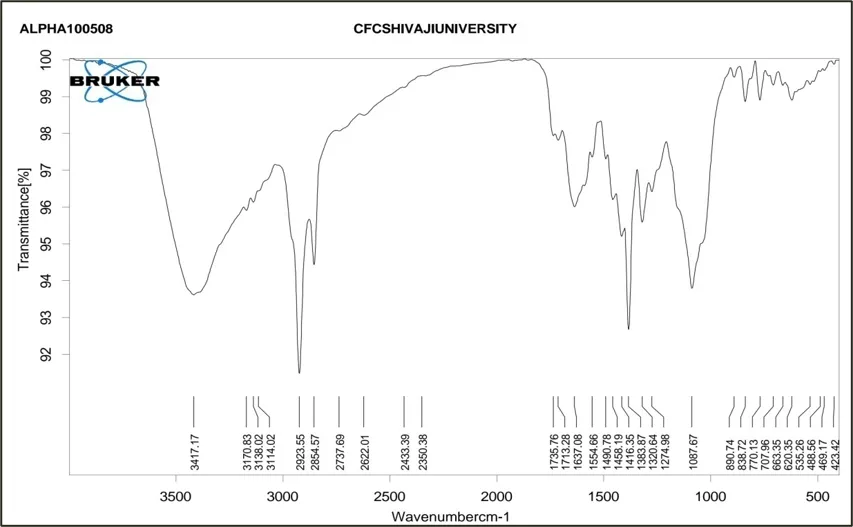
Fig.4 FTIR Spectrum of Physical Mixture of EC+PVA+Drug
3.1.7 Differential Scanning Calorimetry
The DSC thermogram of pure Butoconazole is presented in Fig. 5 and exhibited a sharp endothermic peak at 162.47 °C with an onset temperature of 160.55 °C. The presence of a distinct and narrow peak indicates the crystalline nature and purity of the drug. The enthalpy of fusion was found to be 87.471 J/g, which confirms the thermal behaviour of Butoconazole. No additional peaks or thermal events were observed in the thermogram, suggesting the absence of impurities or degradation products. The obtained DSC result confirmed the identity, purity, and thermal stability of the pure drug sample, making it suitable for further formulation development of nanosponges.
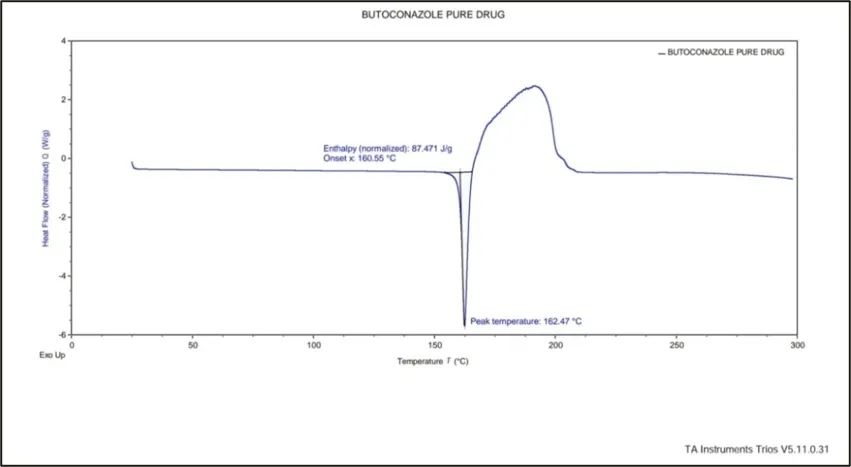
Fig.5 DSC Thermogram of Pure Butoconazole Drug
Experimental Design
A 32 full factorial design was employed to evaluate the influence of formulation variables on the characteristics of Butoconazole-loaded nanosponges. Ethyl Cellulose (X₁) and Polyvinyl Alcohol (X₂) were selected as independent variables, while particle size (Y₁) and entrapment efficiency (Y₂) were considered dependent responses. Nine experimental formulations were prepared and analyzed using Design Expert® Software summarized in Table 2. The factorial design facilitated systematic optimization of formulation variables and enabled identification of the optimized nanosponge formulation.
Table.2 Summary of Experimental Design
|
Formulation code |
Factors (X) |
Responses (Y) |
||
|
Ethyl Cellulose X1 |
Polyvinyl Alcohol X2 |
Particle Size Y1 |
EE Y2 |
|
|
mg |
g |
nm |
% |
|
|
F1 |
100 |
0.5 |
141.4 |
78 |
|
F2 |
100 |
1 |
138.8 |
76 |
|
F3 |
100 |
1.5 |
137.9 |
72 |
|
F4 |
200 |
0.5 |
146.2 |
86 |
|
F5 |
200 |
1 |
143.2 |
84 |
|
F6 |
200 |
1.5 |
142.4 |
80 |
|
F7 |
300 |
0.5 |
152.3 |
92 |
|
F8 |
300 |
1 |
149.1 |
90 |
|
F9 |
300 |
1.5 |
148 |
87 |
ANOVA for Quadratic model
Response 1: Particle Size:
The ANOVA results for particle size are presented in Table3, while the fit statistics are shown in Table 4.
Table 3 Response 1: Particle Size
|
Source |
Sum of Squares |
df |
Mean Square |
F- value |
p- value |
|
|
Model |
188.71 |
5 |
37.74 |
4246.05 |
< 0.0001 |
significant |
|
A-Ethyl cellulose |
163.28 |
1 |
163.28 |
18369.19 |
< 0.0001 |
|
|
B-Polyvinyl alcohol |
22.43 |
1 |
22.43 |
2523.00 |
< 0.0001 |
|
|
AB |
0.1600 |
1 |
0.1600 |
18.00 |
0.0240 |
|
|
A² |
0.8450 |
1 |
0.8450 |
95.06 |
0.0023 |
|
|
B² |
2.00 |
1 |
2.00 |
225.00 |
0.0006 |
|
|
Residual |
0.0267 |
3 |
0.0089 |
|
|
|
|
Cor Total |
188.74 |
8 |
|
|
|
|
The Model F-value of 4246.05 implies the model is significant. P-values less than 0.0500 indicate model terms are significant. In this case, A, B, AB, A², and B² are significant model terms.
Fit Statistics
Table 4. Fit Statistics Particle Size
|
Std. Dev. |
0.0943 |
R² |
0.9999 |
|
Mean |
144.37 |
AdjustedR² |
0.9996 |
|
C.V.% |
0.0653 |
PredictedR² |
0.9985 |
|
|
|
Adeq Precision |
185.7624 |
The Predicted R² of 0.9985 is in reasonable agreement with the Adjusted R² of 0.9996; i.e. the difference is less than 0.2.
Adeq Precision measures the signal-to-noise ratio. A ratio greater than 4 is desirable. Your ratio of 185.762 indicates an adequate signal. This model can be used to navigate the design space.
ANOVA for Quadratic model
Response 2: Entrapment Efficiency:
The ANOVA results for entrapment efficiency are presented in Table 5, and the fit statistics are summarized in Table.6
Table.5 Response 2: Entrapment Efficiency
|
Source |
Sum of Squares |
df |
Mean Square |
F- value |
p- value |
|
|
Model
|
359.36 |
5 |
71.87 |
1108.89 |
< 0.0001 |
significant
|
|
A-Ethyl cellulose |
308.17 |
1 |
308.17 |
4754.57 |
< 0.0001 |
|
|
B-Polyvinyl alcohol |
48.17 |
1 |
48.17 |
743.14 |
0.0001 |
|
|
AB |
0.2500 |
1 |
0.2500 |
3.86 |
0.1443 |
|
|
A² |
1.39 |
1 |
1.39 |
21.43 |
0.0190 |
|
|
B² |
1.39 |
1 |
1.39 |
21.43 |
0.0190 |
|
|
Residual |
0.1944 |
3 |
0.0648 |
|
|
|
|
Cor Total |
359.56 |
8 |
|
|
|
|
The Model F-value of 1108.89 implies the model is significant. There is only a 0.01% chance that an F-value this large could occur due to noise.
P-values less than 0.0500 indicate model terms are significant. In this case A, B, A², B² are significant model terms.
Fit Statistics
Table 6. Fit Statistics: Entrapment Efficiency
|
Std. Dev. |
0.2546 |
R² |
0.9995 |
|
Mean |
82.78 |
AdjustedR² |
0.9986 |
|
C.V.% |
0.3076 |
PredictedR² |
0.9938 |
|
|
|
Adeq Precision |
96.2140 |
The Predicted R² of 0.9938 is in reasonable agreement with the Adjusted R² of 0.9986; i.e. the difference is less than 0.2.
Adeq Precision measures the signal-to-noise ratio. A ratio greater than 4 is desirable. Your ratio of 96.214 indicates an adequate signal. This model can be used to navigate the design space.
Polynomial Equations are used to analyse responses
Effect of variables on Particle size:
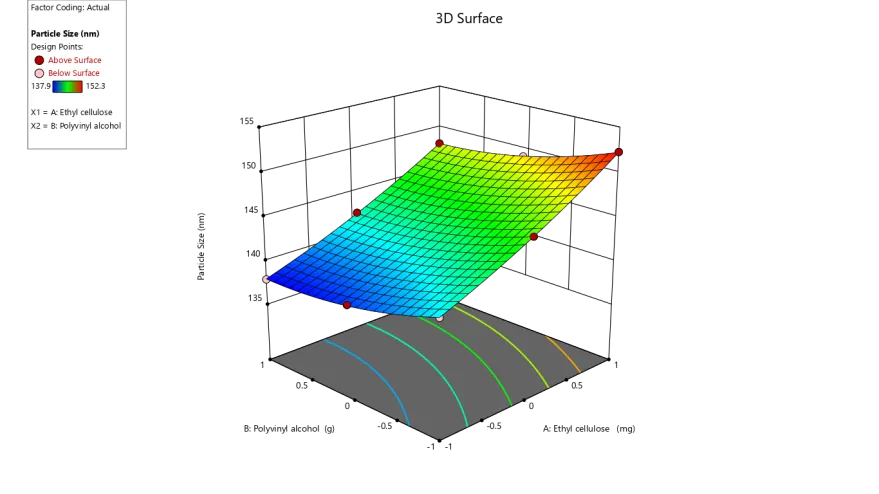
The particle size of the prepared nanosponges was significantly affected by both formulation variables, namely Ethyl cellulose (X1) and polyvinyl alcohol (X2). From the obtained results, particle size was observed in the range of 137.9 nm to 152.3 nm. An increase in the concentration of Ethyl cellulose increased the particle size. In contrast, increasing the concentration of Polyvinyl alcohol decreased the particle size. The lowest particle size (137.9 nm) was obtained at a higher Polyvinyl alcohol concentration. The ANOVA results confirmed that the effects of X1, X2, the interaction term (AB), and the quadratic terms were statistically significant for particle size response.
Response 1: Particle Size, Y1
Y1 = 143.27+5.22X1-1.93X2-0.2000X1X2+0.6500X12+ 1.00X22 ….Eq (1)
Effect of variables on Entrapment Efficiency:
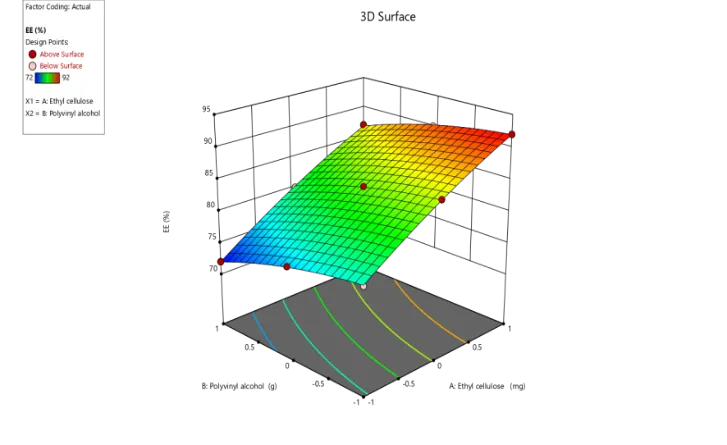
The ANOVA results demonstrated that both independent variables (X1 and X2) and their quadratic terms significantly influenced entrapment efficiency, as indicated by p-values less than 0.05. The developed quadratic model was found to be significant with a high F-value and excellent R² value, confirming the suitability of the model for predicting and optimizing entrapment efficiency of nanosponges.
Response 2: Entrapment Efficiency, Y2
Y2 = 83.89+7.17X1+2.83X2-0.2500X1X2-0.8333X12-0.8333X22 ……. Eq (2)
The influence of Ethyl Cellulose and Polyvinyl Alcohol on particle size and entrapment efficiency is illustrated through contour plots in Fig.6 and response surface plots in Fig.7.
Fig.6 2D Contour plots for evaluating influence of Ethyl cellulose(X1) and Polyvinyl alcohol (X2) on Particle size (Y1) and Entrapment efficiency (Y2)
|
(2a) |
(2b) |
Fig.7 3D Response surface plots for evaluating influence of Ethyl cellulose(X1) and Polyvinyl alcohol (X2) on Particle size (Y1) and Entrapment efficiency (Y2)
3.2 Evaluation of Butoconazole loaded Nanosponges
3.2.1 Particle Size
The particle size of all prepared Butoconazole-loaded nanosponge formulations was found in the range of 137.9 nm to 152.3 nm. The optimized formulation F7 exhibited the highest particle size of 152.3 nm is shown in Fig.8. All formulations showed particle sizes within the nanometer range, indicating successful preparation of nanosponge systems suitable for topical drug delivery.
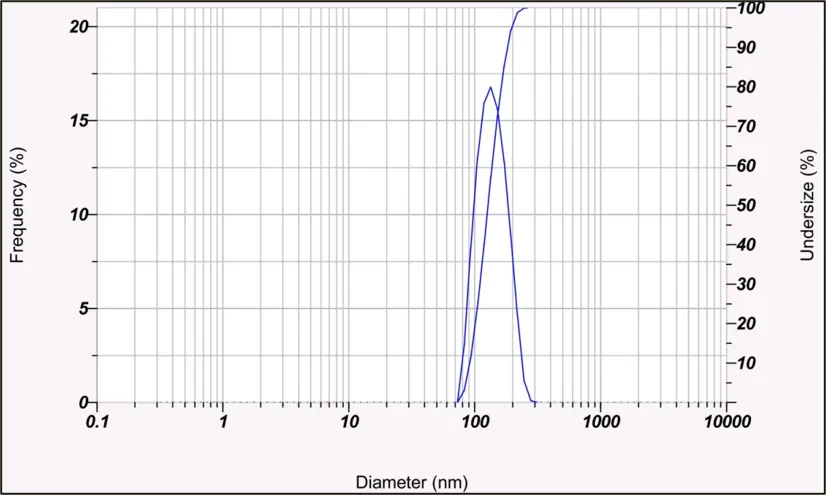
Fig.8 Particle Size of F7 Batch
3.2.2 Drug Entrapment Efficiency %
Table 8.12 provides the entrapment efficiency of the formulation of Butoconazole loaded Nanosponges. All Nanosponges have entrapment efficiencies that range from 72 to 92 are represented in Fig.9 and Table 7. It appears that, with further increases in drug and polymer, the ability for drug entrapment was at its peak.
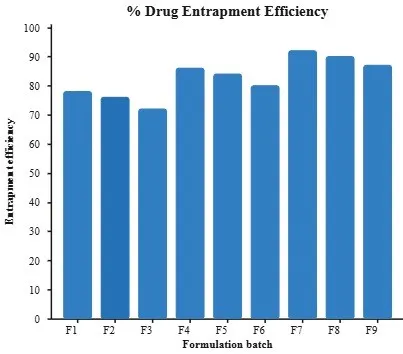
Fig.9 Entrapment Efficiency of all Nanosponge Formulations
3.2.3 Production Yield %
Table.7 displayed that every batch of Butoconazole nanosponges had a manufacturing yield that varied from 68.74% to 91.12%. It was discovered that the amount of Ethyl cellulose and Butoconazole drug had a major impact on production yield. The increased production yield was attributed to higher polymer concentration and efficient nanosponge formation.
Table.7 Drug Entrapmrent Efficiency
|
Formulation Code |
Drug Entrapment Efficiency % |
Production Yield % |
|
F1 |
78 |
69.62 |
|
F2 |
76 |
71.93 |
|
F3 |
72 |
68.74 |
|
F4 |
86 |
76.45 |
|
F5 |
84 |
78.64 |
|
F6 |
80 |
80.52 |
|
F7 |
92 |
91.12 |
|
F8 |
90 |
89.43 |
|
F9 |
87 |
69.62 |
3.2.4 Zeta Potential
The zeta potential analysis of the F7 nanosponge formulation is shown in Fig.10 showed a mean zeta potential value of −21.4 mV. This negative value indicates the presence of negatively charged particles on the surface of the nanosponges. The obtained result suggests moderate stability of the formulation due to sufficient electrostatic repulsion between particles. A single peak was observed in the negative region, indicating uniform distribution of charged particles. Hence, the prepared nanosponge formulation was found to be physically stable and suitable for topical delivery applications.
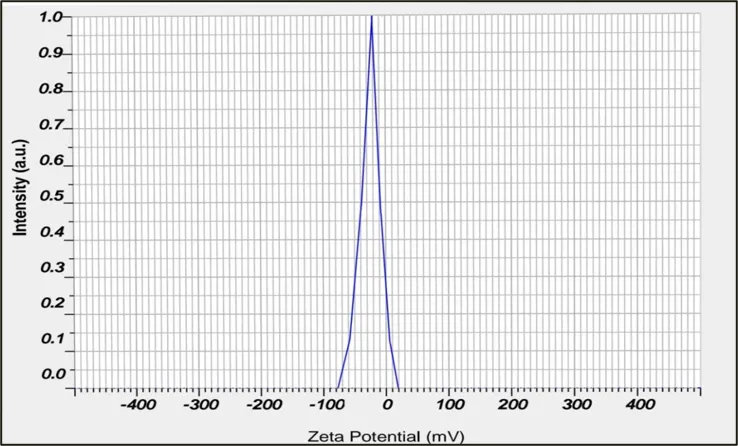
Fig.10 Zeta Potential of Batch F7
3.2.5 FTIR spectroscopy study:
FTIR analysis of the optimized nanosponge formulation (F7) was performed to investigate the compatibility of Butoconazole with the selected excipients and to confirm successful drug incorporation within the nanosponge matrix. The observed peaks included O–H stretching at 3461.48 cm⁻¹, C–H stretching at 2968.76 cm⁻¹, C=C stretching at 1612.99 cm⁻¹, C–N stretching at 1361.90 cm⁻¹, and C–O stretching at 1056.50 cm⁻¹ presented in Fig.11. The characteristic peaks of Butoconazole were retained in the optimized formulation without any significant shift, disappearance, or formation of additional peaks. This indicates the absence of chemical interaction between Butoconazole and the formulation excipients.
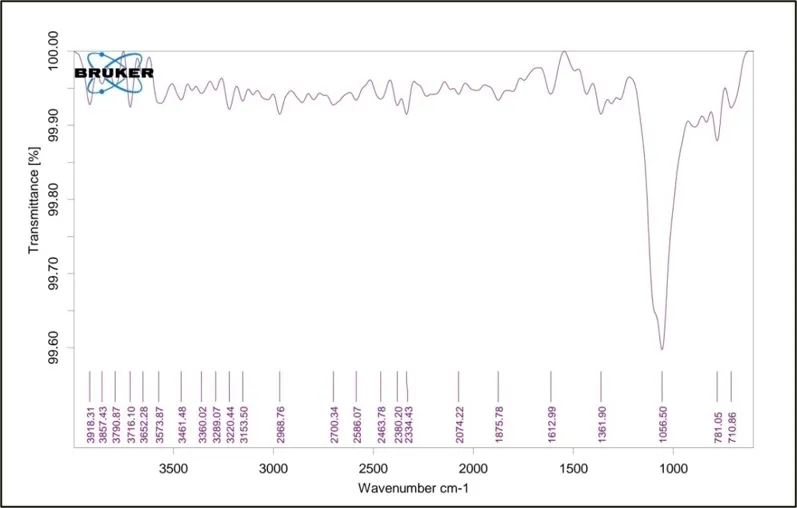
Fig.11 FTIR Spectrum of Optimized Batch F7
3.2.6 Scanning Electron Microscopy
The SEM image revealed spherical nanosponges with a porous surface morphology indicating sponge-like structure these pores enhance the surface area, enabling high drug leading and controlled release observed by SEM is shown in Fig.12. The uniform morphology suggests an optimized synthesis process such characteristics make the nanosponges ideal carriers for poorly soluble drugs like Butoconazole improving solubility, stability, and sustained drug delivery.
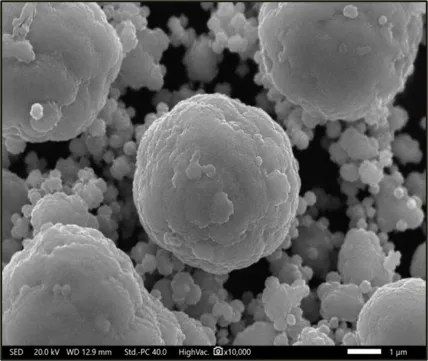
Fig.12 SEM image of Optimized Batch
3.3 Evaluation of Topical Gel
3.3.1 Physical Evaluation
The topical gel formulations were visually evaluated to derive their appearance, including their homogeneity, color, and consistency. All of the batches have a good appearance and a homogenous viscosity. Formulated batches were transparent and exhibited a smooth consistency.
3.3.2 Viscosity
The viscosity of the prepared gel formulations ranged from 4909.3 to 5518.4 cPs is summarized in Table.8. The optimized formulation F7 exhibited the highest viscosity (5518.4 cPs). The increase in viscosity may be attributed to the higher polymer concentration, which improved the consistency and retention of the gel at the site of application.
Table.8
|
Formulation Code |
Viscosity |
pH Determination |
Spreadability |
|
F1 |
5071.5 |
6.32 |
7.3 |
|
F2 |
5204.9 |
6.08 |
7.1 |
|
F3 |
4909.3 |
6.42 |
7.9 |
|
F4 |
5077.7 |
6.25 |
7.5 |
|
F5 |
5160.5 |
6.01 |
7.2 |
|
F6 |
5192.4 |
6.75 |
7.4 |
|
F7 |
5518.4 |
5.87 |
8.0 |
|
F8 |
5348.2 |
6.22 |
7.9 |
|
F9 |
5231.6 |
5.91 |
7.7 |
3.3.3 pH determination:
The pH values of all gel formulations were found in the range of 5.87 to 6.75 is summarized in Table.8, which is compatible with the physiological pH of the skin. The optimized formulation F7 showed a pH of 5.87, indicating suitability for topical application without causing skin irritation.
3.3.4 Spreadability:
The spreadability of the prepared gel formulations ranged from 7.1 to 8.0 g·cm/sec is summarized in Table.8. The optimized formulation F7 showed a spreadability of 8.0 g·cm/sec, indicating good spreadability and ease of application over the skin surface.
3.3.5 In-vitro drug release study:
The in-vitro drug release study of Butoconazole-loaded nanosponge topical gel formulations (F1–F9) demonstrated a sustained drug release pattern over a period of 8 hours. At 1 hour, the cumulative drug release ranged from 6.82% to 11.34%. At 2 hours, the release increased to 9.74%–18.35%, while at 3 hours, it reached 14.63%–26.17%. The cumulative drug release further increased to 21.15%–35.91% at 4 hours and 31.84%–49.68% at 5 hours. At 6 hours, the drug release ranged from 42.26% to 63.92%, and at 7 hours, it increased to 55.73%–74.36%. After 8 hours, the cumulative drug release ranged from 68.42% to 86.74%, with the optimized formulation F7 exhibiting the highest drug release (86.74%). These results indicate that the developed nanosponge gel provided a controlled and sustained drug release profile, making it suitable for prolonged topical antifungal therapy. The CDR profiles of all formulations are illustrated in Fig.13
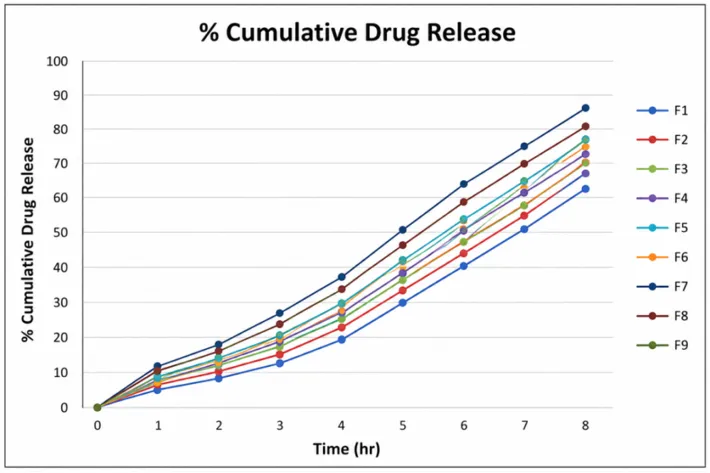
Fig.13 Graph of In-vitro release of Drug
Kinetics of Drug Release
The in-vitro data was applied to various kinetics models to predict the mechanism of drug release of the Nanosponge formulations. The zero-order, first-order, higuchi and krosmeyer-Peppas kinetics plots are presented in Fig 14, 15, 16 and 17 respectively.
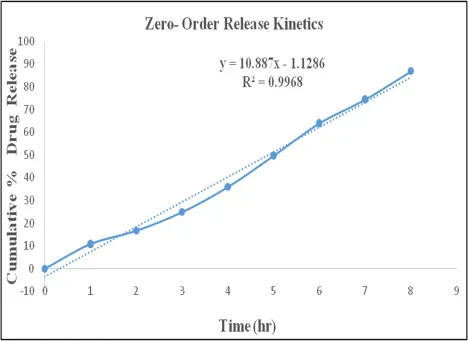
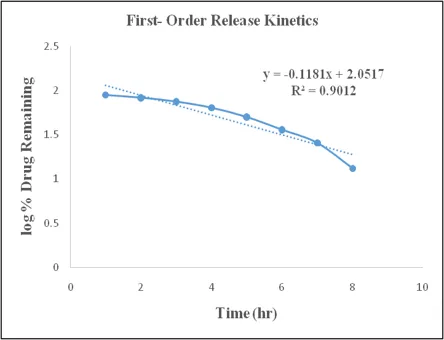
Fig.14 Graph of Zero Order Kinetics Fig.15 Graph of First Order Kinetics
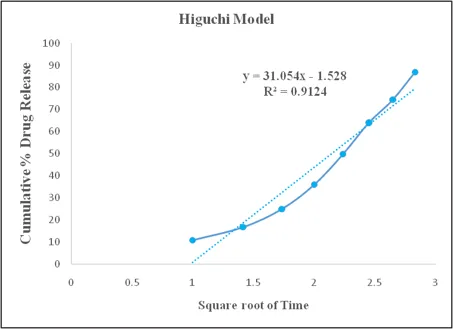
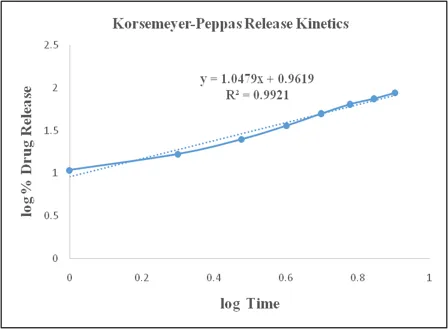
Fig.16 Graph of Higuchi release kinetics Fig.17 Graph of Korsemeyer-Peppas Release
The release kinetics study revealed that the optimized formulation F7 followed Zero-order release kinetics with an R² value of 0.9968. This indicates controlled and sustained drug release from the nanosponge gel formulation.
3.3.6 Antifungal activity by well diffusion method
The nanosponges gel formulation exhibited significant antifungal activity with a zone of inhibition of 18 mm, while the standard Miconazole showed a zone of inhibition of 22 mm is observed in Fig.18. The observed activity confirms that the developed nanosponge gel effectively retained the antifungal. The compounds Nanosponges gel exhibited good activity as compared to the standard Miconazole.
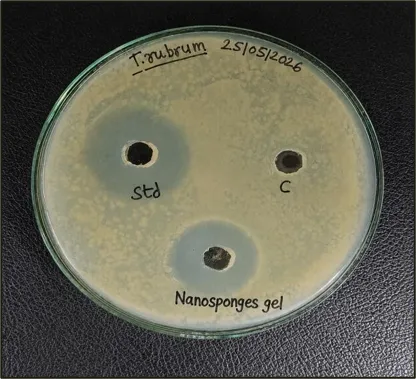
Fig.18 Antifungal Activity of test samples against T.rubrum
CONCLUSION
Butoconazole-loaded nanosponges were successfully formulated using the emulsion solvent diffusion technique and optimized by employing a 32 full factorial design. Among the prepared formulations, batch F7 was identify as the optimized formulation based on desirable particle size, high entrapment efficiency, and satisfactory production yield. Characterization studies confirmed the compatibility of the drug with selected excipients and demonstrated the formation of stable nanosponge systems with porous morphology. The optimized nanosponge formulation, when incorporated into a Carbopol 934 gel base, exhibited acceptable physicochemical characteristics, sustained drug release behavior, and appreciable antifungal activity against Trichophyton rubrum. The release profile followed zero-order kinetics, indicating controlled drug delivery. Therefore, Butoconazole-loaded nanosponge-based topical gel can be considered a promising approach for enhancing topical antifungal therapy by improving drug retention, providing sustained release, and minimizing systematic side effects.
REFERANCES

Ekata Nivas Desai, Dr. Jameel Ahmed Mulla, Formulation, Optimization and Evaluation of Butoconazole-Loaded Nanosponges-Based Topical Gel, Int. J. of Pharm. Sci., 2026, Vol 4, Issue 9, 2045-2064, https://doi.org/10.5281/zenodo.22796905
 10.5281/zenodo.22796905