

We use cookies to ensure our website works properly and to personalise your experience. Cookies policy
1Department of Pharmaceutics, Shree Santkrupa College of Pharmacy, SUK- Ghogaon - Karad, Maharashtra, India-41511.
2HOD - Department of Pharmaceutics, Shree Santkrupa College of Pharmacy, SUK- Ghogaon - Karad, Maharashtra, India-41511
Citrus fruits naturally contain naringenin, a flavonoid known for its anti-inflammatory, antioxidant, and antibacterial properties. However, because of its low permeability, quick metabolism, poor bioavailability, and poor water solubility, its therapeutic use is restricted. Phytosomes are sophisticated lipid-based medication delivery systems that enhance phytoconstituent absorption and penetration by supplementing them with phospholipids. Naringenin is anticipated to improve skin penetration, stability, prolonged drug release, and therapeutic effectiveness when included in a phytosomal gel system. Targeted administration, extended retention at the application location, fewer doses, and increased patient compliance are just a few benefits of topical phytosomal gel. In order to create and assess Naringenin-loaded phytosomal gel as a new topical drug delivery method for increased anti-inflammatory efficacy and better skin penetration, the current research was conducted.
A Novel Drug Delivery System refers to advanced formulation approaches designed to delivery strategies. Systems such as liposomes, nanoparticles, microspheres, and phytosomes improve the therapeutic performance of drugs.1Traditional dosage forms such as tablets, capsules, and injections deliver drugs without controlling their release or targeting specific tissues. As a result, drugs may be rapidly eliminated, degraded before reaching the target site, or distributed to non-target tissues, which can reduce therapeutic efficiency and increase side effects. NDDS have been developed to address these limitations by modifying the way a drug is delivered in the body. These systems aim to provide controlled, sustained, or targeted drug release while maintaining effective drug concentration at the site of action for a longer duration. By improving pharmacokinetic and pharmacodynamics properties, NDDS can enhance therapeutic outcomes and reduce dosing frequency. Recent advances in pharmaceutical technology, particularly in nanotechnology and polymer science, have significantly expanded the scope of novel drug phytosomes are now widely investigated to improve drug solubility, stability, and bioavailability.2, 3
2.1 Materials:
Naringenin was obtained as a gift sample from Yarrow Yucca Enterprises, Mumbai. Other excipients like Soya Lecithin, Cholesterol, Dichloromethane, Carbopol 934, Triethanolamine, Methyl Paraben, Propyl Paraben, Disodium Hydrogen Phosphate, Potassium Dihydrogen Phosphate, and Sodium Chloride were procured from Research Lab Fine Chem Industries, Mumbai. All the chemicals used were analytical grade and were used as obtained.2
2.2 Methods:
2.2.1 Preformulation studies:
Preformulation is the initiative in designing or development of a rational dosage form of a drug. Pre-formulation studies were performed to determine the physicochemical properties of the drug moiety that would affect the stability, safety, and efficacy of the dosage form.3-6
2.2.1.1. Organoleptic properties:
The drug samples were studied for external appearance, such as colour, odour and texture, by using the visual method.7-8
2.2.1.2. Melting Point:
The melting point of naringenin was determined by taking a small amount of sample into a sealed capillary tube, tying the thermometer with a rubber band, and immersing the end of the tube in a Thiele’s tube. Heating is initiated, and thus the temperature range at which the sample melts can be observed.9-12
2.2.1.3 FTIR:
Fourier Transform Infrared (FTIR) spectroscopy is an important analytical technique widely employed for the characterization of phytosomal formulations. It is mainly used to investigate molecular interactions, confirm chemical composition, and evaluate the structural integrity and stability of the developed systems. In this study, FTIR analysis was carried out for the pure drug and physical mixture using a Bruker Alpha-100508 FTIR spectrophotometer. The obtained infrared spectra were further analyzed at different wavenumbers (cm⁻¹) to identify and confirm the presence of functional groups and possible interactions between components.13-17
2.2.1.4 DSC:
Differential Scanning Calorimetry (DSC) analysis was carried out to evaluate the thermal characteristics of the developed formulation. The technique is commonly employed to investigate thermal transitions such as melting behaviour, crystallization, and thermal stability of pharmaceutical systems. The thermal analysis was performed using a simultaneous Hitachi SDT-Q600 TA Instruments, Trios V5.18-20.
2.2.1.5 XRD:
Phosphatidylcholine, Phosphatodylcholine-Phytophospholipid Complexes, and related formulations commonly use XRD to analyse both their microstructured amorphous and crystalline materials. Sharp crystalline peaks in XRD patterns of active components and their physical mixture often indicate a high degree of crystallinity. Germany’s Bruker D 2 Phaser for XRD, an instrument was utilized.21
2.2.1.6 Ultraviolet-visible:
Determination of λmax:
The wavelength of maximum absorption (λmax) of Naringenin was determined using a UV–Visible spectrophotometric method. Accurately weighed 1 mg of Naringenin was transferred into a 10 mL volumetric flask and dissolved in methanol to obtain a primary stock solution (100 µg/mL). The prepared solution was scanned in the UV region of 200–400 nm using a double-beam UV–Visible spectrophotometer, keeping methanol as the blank.22, 23
Preparation of Dilution of standard solution of Naringenin:
Pipetting 0.2 mL, 0.4 ml, 0.6 mL, 0.8 mL, 1.0 mL, and 1.2 mL from the working standard stock solution into a 10 ml volumetric flask yielded the dilution of the naringenin standard solution the volume was then adjusted with methanol to create 20-120 μg/ ml accordingly.24, 25
A rotating round-bottom flask containing concentrations of Naringenin and soya lecithin was charged with 5 mL methanol and 5 mL dichloromethane. The resulting mixture was stirred continuously for 1 hour while maintaining the temperature below 40°C to ensure proper interaction between the drug and phospholipid components. After complete mixing, the solvent system was evaporated to obtain a thin film deposited on the inner wall of the flask. Thereafter, n-hexane was introduced, and the mixture was continuously agitated until the formation of a phospholipid monolayer complex occurred. The prepared phytophospholipid complex was then rinsed with n-hexane under constant stirring to remove any uncomplexed material. The final phospholipid complex obtained was collected in an amber-colored container, flushed with nitrogen, and allowed to stand at room temperature for complete drying and stabilisation.26
Table 1. Formulation Table of Phytosome
|
Sr. No |
Batches |
Naringenin (mg) |
Soya lecithin(mg) |
Cholesterol (mg) |
Methanol (ml) |
Dichloromethane (ml) |
|
1 |
F1 |
100 |
100 |
25 |
5 |
5 |
|
2 |
F2 |
100 |
100 |
50 |
5 |
5 |
|
3 |
F3 |
100 |
100 |
75 |
5 |
5 |
|
4 |
F4 |
100 |
200 |
25 |
5 |
5 |
|
5 |
F5 |
100 |
200 |
50 |
5 |
5 |
|
6 |
F6 |
100 |
200 |
75 |
5 |
5 |
|
7 |
F7 |
100 |
300 |
25 |
5 |
5 |
|
8 |
F8 |
100 |
300 |
50 |
5 |
5 |
|
9 |
F9 |
100 |
300 |
75 |
5 |
5 |
The particle size (z-average) and zeta potential of the prepared phytosomal formulation were evaluated using dynamic light scattering and photon correlation spectroscopy techniques. The measurements were carried out using a Horiba Particle Size Analyzer (SZ-100) and assessed for physical stability of the phytosome dispersion. Generally, formulations exhibiting zeta potential values above ±30 mV are considered highly stable due to sufficient electrostatic repulsion between particles, whereas values between ±20 mV and ±30 mV indicate moderate stability of the colloidal system.27
2.2.3.2 FTIR:
FTIR analysis was carried out to study the interaction between the drug and phospholipid in the prepared phytosomal formulation. The spectra of pure drug, soya lecithin, physical mixture, and phytosome were recorded using an FTIR spectrophotometer. The obtained spectra were evaluated for characteristic peaks and possible peak shifting or broadening, which indicated complex formation and compatibility between the drug and phospholipid.28
2.2.3.3 Entrapment Efficiency:
The entrapment efficiency of the prepared phytosomal formulation was determined using the centrifugation method. For analysis, 0.5 mL of phytosomal sample was taken and centrifuged at 3000–4000 rpm for 15–30 minutes to separate the free drug from the vesicular system.29, 30
2.2.3.4 Polydispersity Index:
The mean particle diameter and polydispersity index (PDI) can be determined from the obtained particle size data. The PDI indicates the uniformity of particle distribution within the formulation. A lower PDI value represents a narrow and more uniform particle size distribution, indicating a monodisperse system. In contrast, a higher PDI value suggests greater variation in particle size, showing a polydisperse system with a broader distribution range.31
2.2.3.5 Transmission Electron Microscopy:
Transmission Electron Microscopy (TEM) was performed to study the shape and surface morphology of the optimized naringenin-loaded phytosomes performed by instrument TEM-HT7800 series (120Kv) Hitachi instrument. A diluted phytosomal suspension was placed on a carbon-coated copper grid, stained with phosphotungstic acid, and dried before analysis under TEM.32
2.2.4 Development of phytosomal gel:
The Optimized Phytosome Formulations was incorporated into the Carbopol gel. The Carbopol gel 934 Base was developed separately with distilled water. The base was allowed to stand for one day then stirred and added a neutralizing base, TEA into the gel base, after a gel based was form, Phytosomes suspension of Naringenin was added and stirred until homogeneous, then methyl paraben and propyl paraben is added which has been dissolved before in a portion of propylene glycol and all stirred.33
Table 2. Formulation Table of Phytosomal gel
|
Sr. No. |
Ingredients For Gel |
Concentration |
|
1 |
Carbopol 934 (gm) |
1gm |
|
2 |
Naringenin Phytosomes (ml) |
20 ml |
|
3 |
Triethanolamine (mL) |
1.2 ml |
|
4 |
Methyl paraben (gm) |
0.05 |
|
5 |
Propyl Paraben (gm) |
0.02 |
|
6 |
Propylene glycol 400 (ml) |
0.5 |
|
7 |
Distilled Water (ml) |
100 |
2.2.5.1 Viscosity:
The viscosity of the prepared Naringenin-loaded phytosomal gel was evaluated using a Brookfield Viscometer (DV-E Model). For the analysis, an appropriate quantity of gel formulation was transferred carefully into a small-volume sample holder without entrapping air bubbles.34
The pH of each gel formulation was determined using standard buffer solutions of pH 4.0 and 7.0 for calibration of the pH meter. For analysis, accurately weighed 0.5 g of gel was dispersed in 50.0 mL of distilled water to obtain a homogeneous dispersion. The pH of the prepared dispersion was measured using a calibrated digital pH meter, and the readings were recorded.35
2.2.5.3 Spreadability:
For the evaluation of spreadability, a pair of clean glass slides measuring 20 cm × 20 cm were selected. A small amount of the gel formulation was placed between the two slides. The sample was then gently pressed and moved repeatedly in opposite directions over both slides to ensure uniform distribution and formation of a thin, even film of the gel. To maintain a constant compressive force and achieve reproducible spreading, a 50 g weight was carefully placed on the upper glass slide. The assembly was left undisturbed, and the time required for the gel to spread between the slides was recorded using a stopwatch.36
2.2.5.4 In Vitro Drug Release:
The in vitro drug release study was performed using the dialysis membrane diffusion technique to evaluate the release profile of the formulation. Phosphate-buffered saline (PBS) was selected as the dissolution medium. The entire experimental setup was maintained on a magnetic stirrer with continuous stirring, and the temperature was controlled at 37 ± 0.5 °C to simulate physiological conditions. For the study, a dialysis bag containing 10 mL of the phytosomal dispersion or drug solution with an equivalent concentration was tightly sealed and immersed in 100 mL of PBS pH 6.8, which served as the receptor medium. A magnetic bead was used to maintain uniform agitation throughout the experiment. Samples were withdrawn at predetermined time intervals of 0.5, 1, 1.5, 2, 3, 4, 5, 6, and 8 hours, and the same volume of fresh pre-warmed dissolution medium was replaced after each withdrawal to maintain sink conditions. The collected samples were analyzed using a UV spectrophotometer at 289 nm, and the cumulative percentage drug release % CDR was calculated accordingly.37
Drug Release Kinetics:
The In-Vitro drug release data were evaluated using different kinetic models such as zero-order, first-order, and Higuchi equations to identify the mechanism and pattern of drug release from coated granules.18 The release profile obtained from dissolution studies was fitted into these mathematical models to determine the best fit based on regression coefficient (R2) values. The analysis also helped in understanding the release-controlling mechanism of the formulation.38
Naringenin is a tasteless to very bitter fine crystalline solid obtained as a white to pale yellow crystalline powder.
The melting point of Naringenin was found to be 248 256 ° c.
Naringenin is soluble in organic solvents such as Methanol, ethanol, DMSO, and DMF and sparingly soluble in aqueous buffer and practically insoluble in water
A naringenin standard solution was prepared by dissolving 1 mg Naringenin in 10 mL of Methanol. This Solution was scanned within the UV range of 200-400 nm. The highest absorption of Naringenin was observed at 289 nm (as shown in Fig.1), as illustrated in the graph. As a result, 289nm was selected as the wavelength for drug content estimation.
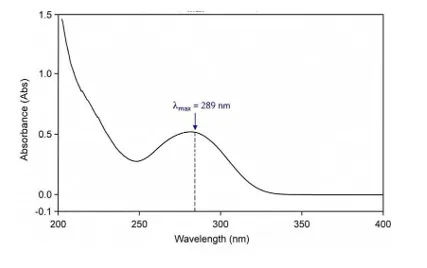
Figure.1 λ max of Naringenin
The absorbance of the drug in methanol was measured at 289 nm. Table 8.1 presents the findings. Fig.2 displays the Naringenin Calibration Curve
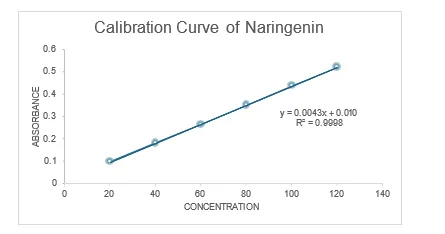
Figure 2. 2 Calibration Curve of Naringenin
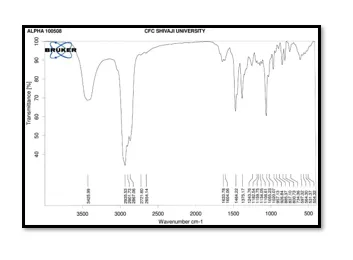
Figure 3. FTIR of Naringenin
This graph is an FTIR spectrum that serves as a chemical fingerprint to identify functional groups within an organic molecule. It reveals a broad O-H or N-H group at 3285 cm⁻¹, followed by aromatic and aliphatic C-H bonds around 3000 cm⁻¹. Additionally, the sharp dip at 1634 cm⁻¹ points to a strong C=O or C=C double bond, while the complex peaks below 1500 cm⁻¹ form the unique fingerprint region of the compound.
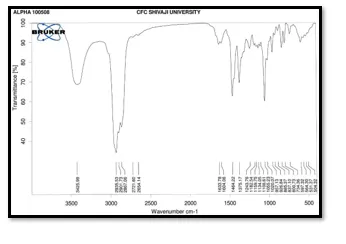
Figure.4 FITR of Physical mixture of Naringenin, Soya Lecithin, cholesterol
This graph is an FTIR spectrum used to identify the functional groups of an organic compound through light absorption. It shows a moderately broad peak at 3425 cm⁻¹ corresponding to an O-H or N-H stretching group, alongside a very strong, deep peak near 2935–2867 cm⁻¹ indicating dominant aliphatic C-H stretching Additionally, the prominent peaks at 1464 cm⁻¹ and 1375 cm⁻¹ confirm C-H bending vibrations, while the signal at 1108 cm⁻¹ points to a single-bond stretching region like C-O, completing the compound's unique chemical profile
FTIR of Phytosome:
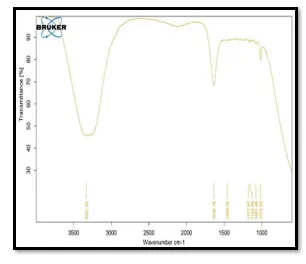
Figure.5 FTIR of Phytosome
This graph is an FTIR spectrum showing fewer, broader features that typically indicate a simpler compound or a highly aqueous mixture. It features a major, wide absorption band centred at 3331 cm⁻¹ representing strong O-H stretching (characteristic of water, alcohols, or hydroxyl groups). Additionally, the prominent peak at 1636 cm⁻¹ signifies O-H bending vibrations or an alkene/carbonyl group, while the weak features around 1015–1177 cm⁻¹
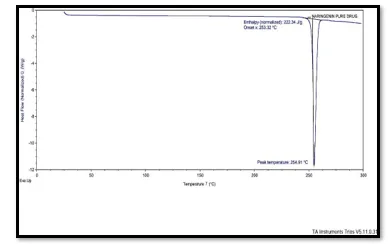
Figure.6 DSC of Naringenin
The DSC thermogram of pure Naringenin exhibited a sharp endothermic peak at 254.91°C with an onset temperature of 253.32°C, corresponding to its melting point. The sharpness of the peak indicates the crystalline nature and purity of the drug. The enthalpy value of 222.34 J/g suggests strong crystal lattice energy and thermal stability. No additional peaks were observed, confirming the absence of impurities or polymorphic transitions.
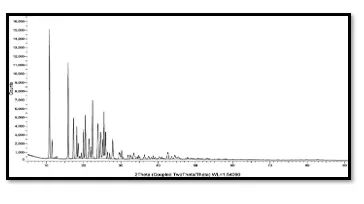
Figure.8 XRD of Naringenin
The XRD pattern of pure Naringenin exhibited sharp and intense diffraction peaks at various 2θ values, particularly between 10° and 30°, confirming its crystalline nature. The presence of well-defined peaks indicates high purity and ordered molecular arrangement of the drug. No extra peaks or amorphous halo were observed, suggesting absence of impurities and good crystalline stability.
The results of the main composite design were statistically evaluated using Design-Expert software. Soya lecithin (X1) and Cholesterol (X2) were investigated as independent variables, and their effects on particle size and Entrapment efficiency were examined as dependent variables. The 32-factorial result in 9 runs.
Table 3. 3 Factors and Response
|
Formulation code |
Soya Lecithin (X1) mg |
Cholesterol (X2) mg |
Particle Size (Y1) mg |
Entrapment Efficiency (Y2) mg |
|
1 |
100 |
25 |
141 |
77.5 |
|
2 |
100 |
50 |
143.3 |
78.7 |
|
3 |
100 |
75 |
147.8 |
80.5 |
|
4 |
200 |
25 |
134.6 |
81.5 |
|
5 |
200 |
50 |
136.1 |
82.2 |
|
6 |
200 |
75 |
140.3 |
84.4 |
|
7 |
300 |
25 |
151.7 |
85.2 |
|
8 |
300 |
50 |
153.4 |
86.1 |
|
9 |
300 |
75 |
157.8 |
88.3 |
ANOVA for Quadratic model
Table.4 Response 1: Particle Size
|
Source |
Sum of Squares |
df |
Mean Square |
F-value |
p-value |
|
|
Model |
515.15 |
5 |
103.03 |
1435.78 |
< 0.0001 |
significant |
|
A-Soy Lecithin |
158.11 |
1 |
158.11 |
2203.29 |
< 0.0001 |
|
|
B- Cholesterol |
57.66 |
1 |
57.66 |
803.52 |
< 0.0001 |
|
|
AB |
0.1225 |
1 |
0.1225 |
1.71 |
0.2825 |
|
|
A² |
296.06 |
1 |
296.06 |
4125.68 |
< 0.0001 |
|
|
B² |
3.21 |
1 |
3.21 |
44.72 |
0.0068 |
|
|
Residual |
0.2153 |
3 |
0.0718 |
|
|
|
|
Cor Total |
515.37 |
8 |
|
|
|
|
The Model F-value of 1435.78 implies the model is significant. P-values less than 0.0500 indicate model terms are significant. In this case A, B, A², B² are significant model terms.
Fit Statistics
Table.5 Fit Data Particle Size
|
Std. Dev. |
0.2679 |
R² |
0.9996 |
|
Mean |
145.11 |
Adjusted R² |
0.9989 |
|
C.V. % |
0.1846 |
Predicted R² |
0.9950 |
|
|
|
Adeq Precision |
106.6420 |
The Predicted R² of 0.9950 is in reasonable agreement with the Adjusted R² of 0.9989; i.e. the difference is less than 0.2. Adeq Precision measures the signal to noise ratio. A ratio greater than 4 is desirable. Your ratio of 106.642 indicates an adequate signal. This model can be used to navigate the design space.
ANOVA for Quadratic model
Table.6 Response 2: Entrapment Efficiency
|
Source |
Sum of Squares |
df |
Mean Square |
F-value |
p-value |
|
|
Model |
101.55 |
5 |
20.31 |
743.53 |
< 0.0001 |
signi fican t |
|
A-Soy Lecithin |
87.40 |
1 |
87.40 |
3199.79 |
< 0.0001 |
|
|
B- Choleste rol |
13.50 |
1 |
13.50 |
494.24 |
0.0002 |
|
|
AB |
0.0025 |
1 |
0.0025 |
0.0915 |
0.7820 |
|
|
A² |
0.0006 |
1 |
0.0006 |
0.0203 |
0.8956 |
|
|
B² |
0.6422 |
1 |
0.6422 |
23.51 |
0.0167 |
|
|
Residual |
0.0819 |
3 |
0.0273 |
|
|
|
|
Cor Total |
101.63 |
8 |
|
|
|
|
The Model F-value of 743.53 implies the model is significant. P-values less than 0.0500 indicate model terms are significant. In this case A, B, B² are significant model terms.
Fit Statistics
Table.7 Fit Statistics of Entrapment Efficiency
|
Std. Dev. |
0.1653 |
R² |
0.9992 |
|
Mean |
82.71 |
Adjusted R² |
0.9978 |
|
C.V. % |
0.1998 |
Predicted R² |
0.9917 |
|
|
|
Adeq Precision |
78.7981 |
The Predicted R² of 0.9917 is in reasonable agreement with the Adjusted R² of 0.9978; i.e. the difference is less than 0.2. Adeq Precision measures the signal to noise ratio. A ratio greater than 4 is desirable. Your ratio of 78.798 indicates an adequate signal. This model can be used to navigate the design space.
Polynomial Equation are used to analyze response Influencing Variables on Particle Size
Response 1 represents particle size (Y₁) of the phytosomal formulation. The obtained particle size ranged from lower to higher values depending on concentration of Soy Lecithin and Cholesterol. Increase in both formulation variables caused gradual increase in vesicle size. The model F-value indicated that the quadratic model was significant for predicting particle size. The contour and response surface plots clearly demonstrated the relationship between formulation variables and particle size response. The DOE contour plot and 3D response surface plot were used to study the influence of Soy Lecithin (X₁) and Cholesterol (X₂) on particle size (Y₁) of phytosomes. In the contour plot, the blue colour region represents smaller particle size, while green, yellow, and red regions indicate larger particle size. From the diagram, it was observed that particle size increased gradually with increase in concentration of both Soy Lecithin and Cholesterol AND indicate that both variables showed significant effect on particle size. In the 3D surface plot, the surface became higher at higher levels of X₁ and X₂, confirming increase in vesicle size .
Optimization
The optimized formulation was observed at moderate concentrations of Soy Lecithin and Cholesterol where minimum particle size and good stability were obtained. This optimized region corresponds to the lowest point in the 3D surface plot and the blue region in the contour plot.
Polynomial Equation for Particle Size
Y1 = 136.16+5.13X1+3.10X2-0.1750X1X2+12.17X12+1.27X22
Influencing Variables on Entrapment Efficiency
Response 2 represents entrapment efficiency (Y₂) of the phytosomal formulation. The 2D contour plot and 3D surface Plot illustrates the influence of Soy Lecithin (X1) and Cholesterol (X2) on Entrapment Efficiency (Y2). In both graphs, the x-axis represents the concentration of Soy Lecithin and the y-axis represents the concentration of Cholesterol, while the z-axis in the 3D plot represents Entrapment Efficiency. In the 2D contour plot, the color gradient changes from blue to red, where blue indicates lower entrapment efficiency and red indicates higher entrapment efficiency. The contour lines represent regions of constant EE%. The graph shows that entrapment efficiency increased with increase in both Soy Lecithin and Cholesterol concentrations, as indicated by the gradual shift from blue to red region. The 3D surface plot also demonstrates an upward slope, confirming the positive influence of both variables on entrapment efficiency. The higher surface region indicates maximum drug entrapment, while the lower blue region represents minimum entrapment efficiency.
Effect of Soy Lecithin and Cholesterol
An increase in Soy Lecithin concentration increased entrapment efficiency because higher phospholipid content provides more space for incorporation of drug molecules within vesicles. Similarly, increasing Cholesterol concentration improved membrane rigidity and reduced drug leakage, thereby enhancing entrapment efficiency. The combined effect of both variables showed a synergistic improvement in drug loading capacity and vesicle stability.
Polynomial equation of Entrapment Efficiency, Y2
Y2 = 82.32+3.82X1+1.50X2+0.0250X1X2+0.0167X12-+0.5667X2
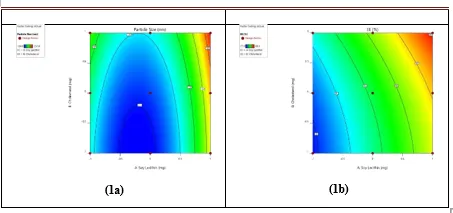
Figure.9 2D Contour plots for evaluating influence of Soy Lecithin (X1) and Cholesterol (X2) on Particle size (Y1) and Entrapment efficiency (Y2)
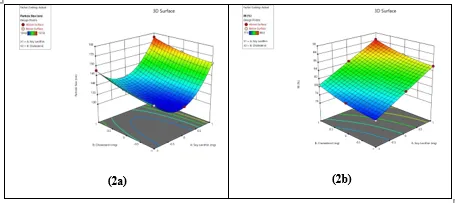
Figure.10 3D Response surface plots for evaluating influence of Soy Lecithin (X1) and Cholesterol (X2) on Particle size (Y1) and Entrapment efficiency (Y2)
Phytosomes are developed to improve the bioavailability and stability of herbal drugs. Particle size is an important parameter because it affects drug absorption, penetration, stability, and therapeutic activity of the formulation. Smaller particle size provides better surface area and enhances drug delivery through the skin. For the prepared naringenin phytosomal formulations, the particle size was found to range from 134.6 nm to 157.8 nm, among all batches, formulation F9 Showed the smallest particle size, while formulation F4 is highest particle size with an average particle size of about 145.9 nm. The obtained nano-size range indicates uniform vesicle formation and good stability of the phytosomal system. The smaller particle size may help in improving permeation and drug release, making the formulation suitable for topical drug delivery applications.
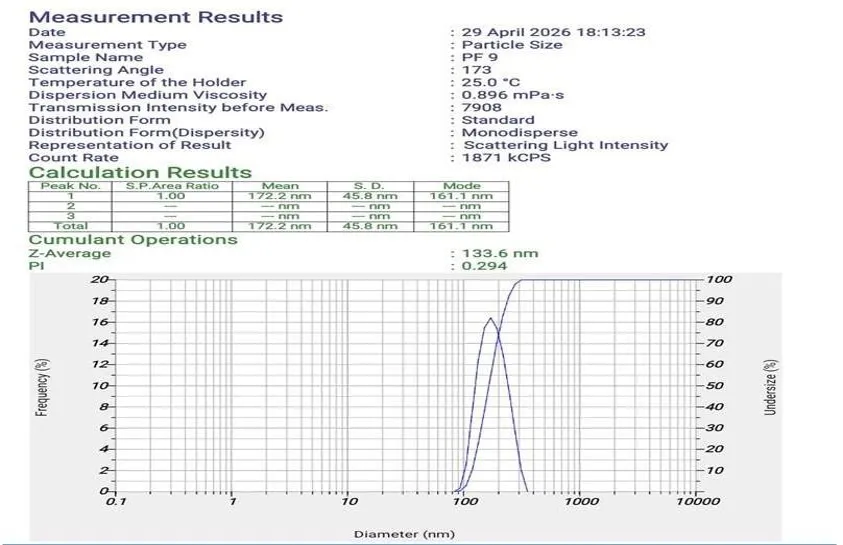
Figure.11 Particle size of Naringenin Loaded Phytosomes (F9)
The zeta potential data provided for the phytosomes containing Naringenin essential to comprehending the nanoparticles stability in suspension. Zeta potential analysis was performed only for the optimized phytosomal formulation batch F9 as it showed the best overall evaluation parameters among all prepared batches obtains optimized batch range F9 Show most stable.
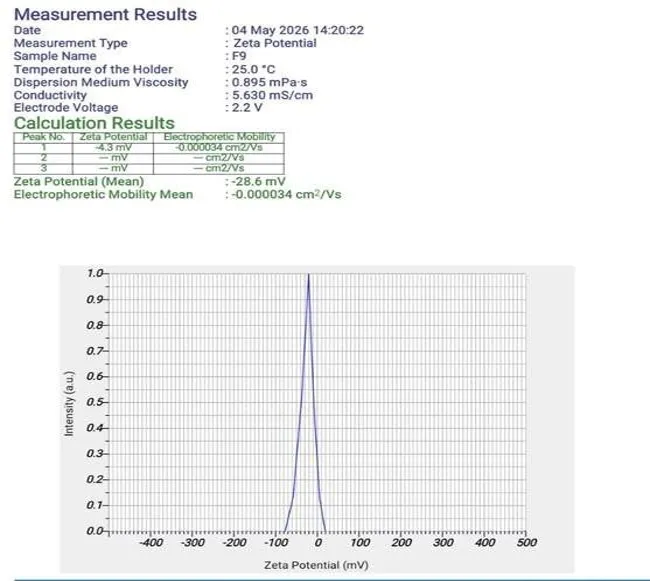
Figure.12 Zeta Potential of Naringenin Loaded Phytosomes (F9)
The Entrapment efficiency of phytosome formulation ranged from 77.5% to 88.3%.the entrapment efficiency of nine formulations was shown in table 8.13 F9 formulation shows the highest entrapment efficiency as compare to other formulations. F9 formulation states that the concentrations of Soya lecithin and cholesterol are in a right proportion to produce phytosomal vesicles.
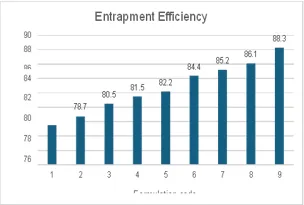
Figure.13 Entrapment Efficiency of Naringenin Loaded Phytosomes
The polydispersity index (PDI) of the prepared Naringenin loaded phytosomal formulations was found to be in the range of 0.294 to 0.452. The obtained PDI values indicate moderate and acceptable particle size distribution within the formulations. Among all batches, formulation F9 showed the lowest PDI value (0.294), indicating better uniformity and homogenous vesicle distribution compared to other formulations.
3.2.5 Transmission Electron Microscopy TEM
The TEM picture of the Naringenin Phytosome shows smaller particle size compared to the values obtained using the Horiba SZ-100 Particle size analyzer. This difference occurs because the Horiba analyzer measures the hydrodynamic diameter of particles in a liquid medium, including solvation layer and any possible aggregation, leading to large size readings. In contrast, TEM visualizes the dry, solid core of individuals particles under vacuum, without the hydration shell. For example, the F9 batch shows 134.6 nm by Horiba, while TEM image reveals much smaller core sizes 20-40 nm. This size variation is expected due to the fundamental differences in measurement techniques. These TEM diagram confirmed spherical morphology, nanosized particle distribution and good dispersion of the optimized phytosomal formulation.
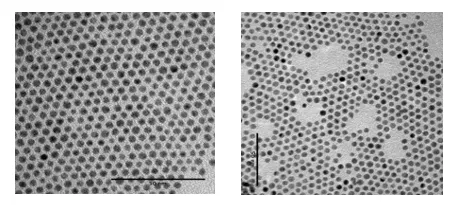
Figure.14 :50 nm TEM images of Naringenin Phytosomes
Carbopol 934 were used as a gelling agent in Naringenin loaded phytosomes. The viscosity of phytosomal gel ranging from 7012 cP to 7988 cP.
The ph of several phytosomal gel from 6.42 to 7.12 it is in a general physiological value and doesn’t irritate the skin.
Spreadability is an important for topical formulations influencing how easily the product can be applied and distributed on the skin or other surfaces. A higher spreadability value generally indicate better case of application and more uniform coverage. Spreadability rate ranging from
18.42 to 22.73 g·cm/sec. as shown in table 8.17. F9 Batch Indicate good case of spreadability for the Naringenin gel.
The result of In vitro drug release studies of Naringenin phytosomes made by thin film hydration technique are shown in the figure.15 percentage CDR of Phytosomal gel was obtained between 77.248% to 93.482%. most formulation show steady increase in drug release F8 and F9 consistently show higher cumulative release percentages compared to other formulations .by 8 hours F9 batch achieve highest cumulative release 93.482% indicating it releases the drug more completely and quickly.
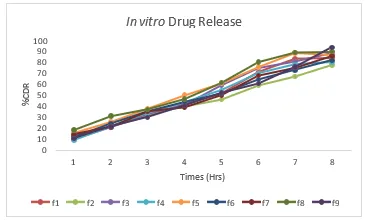
Figure.15 In vitro Release Study
Drug Release Kinetics
Table.8 Value of Correlation Coffecient
|
Sr. no |
Models |
Correlation coefficient (R2) |
|
1 |
Zero order |
0.9959 |
|
2 |
First order |
0.7842 |
|
3 |
Higuchi kinetic |
0.9634 |
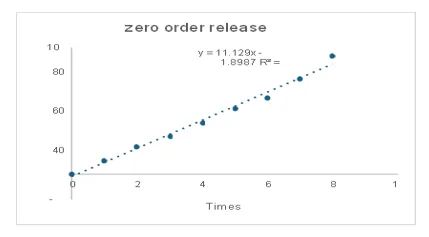
Figure 16: Zero order release kinetics (F9)
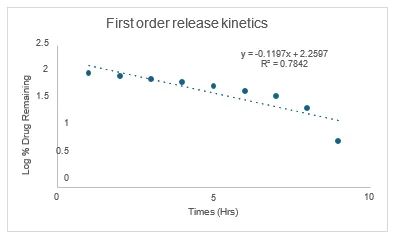
Figure 17: First order release kinetics (F9)
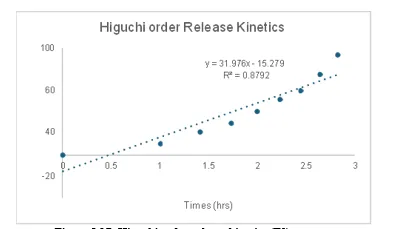
Figure 8.17: Higuchi order release kinetics (F9)
3.3.5 Anti-inflammatory
Table .9 Anti-inflammatory test
|
|
|
|
Protein denaturation assay |
||||
|
Sr no |
Sample code |
Concentrat ions (µg/ml) |
Absorbance at 660 nm |
|
|||
|
|
|
|
Test 1 |
Test 2 |
Test 3 |
Mean |
% of Inhibition |
|
1 |
Control |
|
1.54 |
1.54 |
1.54 |
1.54 |
- |
|
2 |
Standard (Diclofenac Sodium) |
20 |
1.40 |
1.37 |
1.39 |
1.39 |
9.74% |
|
|
|
40 |
1.20 |
1.20 |
1.22 |
1.21 |
21.43% |
|
|
|
60 |
0.91 |
0.89 |
0.93 |
0.91 |
40.91% |
|
|
|
80 |
0.67 |
0.65 |
0.63 |
0.65 |
57.79% |
|
|
|
100 |
0.21 |
0.18 |
0.23 |
0.21 |
86.36% |
|
|
|
|
|
|
|
|
|
|
3 |
Phytosomal gel |
20 |
1.47 |
1.43 |
1.47 |
1.46 |
5.19% |
|
|
|
40 |
1.36 |
1.39 |
1.41 |
1.39 |
9.74% |
|
|
|
60 |
1.11 |
1.15 |
1.17 |
1.14 |
25.97% |
|
|
|
80 |
0.88 |
0.82 |
0.85 |
0.85 |
44.81% |
|
|
|
100 |
0.61 |
0.59 |
0.58 |
0.59 |
61.69% |
|
|
|
|
|
|
|
|
|
*NE-Not Evaluable
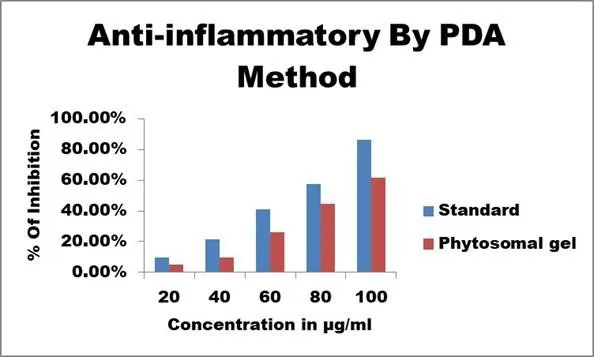
Fig. 8.18 : Anti-inflammatory by PDA Method Anti-inflammatory Activity
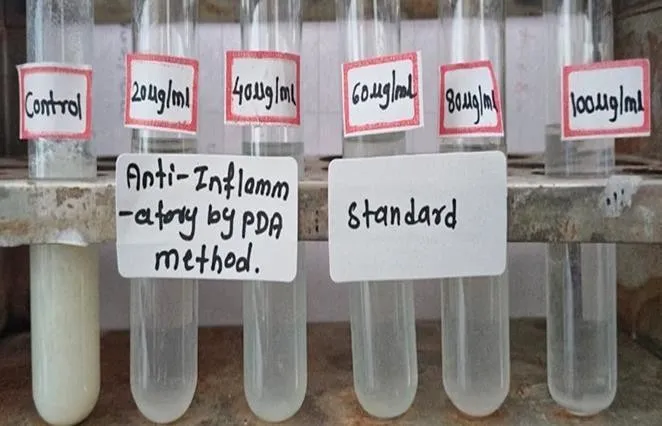
Fig.8.19. Anti-inflammatory Test of Naringenin by PDA Method
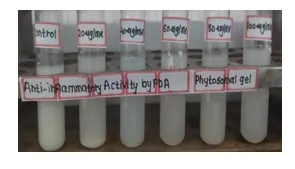
Fig. 8.20. Anti-inflammatory Test of Naringenin- gel by PDA Method
The Protein Denaturation Assay showed that the phytosomal gel possessed significant anti-inflammatory activity in a concentration-dependent manner. The percentage inhibition increased from 5.19% at 20 µg/mL to 61.69% at 100 µg/mL, indicating effective prevention of protein denaturation. Although the activity was lower than the standard diclofenac sodium, the formulation demonstrated good anti-inflammatory potential and confirmed successful incorporation of the phytosomal drug into the gel system.
4. CONCLUSION:
The Naringenin-loaded phytosomal gel was successfully formulated and evaluated for topical delivery. The phytosomal system effectively improved the solubility, stability, and skin permeation of Naringenin. The optimized formulation exhibited satisfactory particle size distribution, high entrapment efficiency, suitable pH, viscosity, and spreadability characteristics. In-vitro drug release studies demonstrated a sustained release profile, while anti-inflammatory studies indicated enhanced therapeutic activity compared to conventional formulations. The phytosomal gel provided improved bioavailability, prolonged drug release, and better skin retention of Naringenin. Therefore, the developed Naringenin-loaded phytosomal gel can be considered a promising topical drug delivery system for the treatment of inflammatory skin disorders and related dermatological conditions.
REFERENCES


Roshani Atugade, Dr. Jameel Ahmed Mulla, Formulation, Optimization And Evaluation Of Naringenin - Loaded Phytosomal Gel For Topical Delivery, Int. J. of Pharm. Sci., 2026, Vol 4, Issue 9, 3728-3749. https://doi.org/10.5281/zenodo.23022609
 10.5281/zenodo.23022609