

We use cookies to ensure our website works properly and to personalise your experience. Cookies policy
Department of Pharmaceutics, Sri Vijay Vidyalaya College of Pharmacy (SVVCOP), Dharmapuri – 636807, Tamil Nadu, India.
Background: Ibrutinib, a first-in-class Bruton's tyrosine kinase (BTK) inhibitor used for B-cell malignancies, is a Biopharmaceutics Classification System (BCS) Class II drug with very low aqueous solubility and high intestinal permeability. Poor wettability and slow dissolution may limit its oral absorption and consistent systemic exposure.Objective: This study aimed to formulate, optimize, and evaluate an Ibrutinib nanosuspension using the nanoprecipitation technique to enhance saturation solubility and in-vitro dissolution.Methods: Nine nanosuspension formulations (F1–F9) were prepared using Carbopol, Ethyl Cellulose, and Sodium Carboxymethyl Cellulose (Na CMC) as polymeric stabilizers at three concentration levels, with PVP K-30 and sodium lauryl sulfate (SLS) as co-stabilizer/surfactant. Ibrutinib dissolved in methanol was added dropwise to the aqueous polymer solution under continuous stirring (900–1000 rpm), followed by solvent evaporation. Formulations were evaluated for drug–excipient compatibility, percentage yield, drug content, entrapment efficiency, particle size, polydispersity index (PDI), zeta potential, saturation solubility, viscosity, surface morphology, and in-vitro drug release.Results: All formulations exhibited submicron particle sizes (260.4–453.2 nm). F3, containing 140 mg Ibrutinib and 200 mg Carbopol, was selected as the optimized formulation, showing a particle size of 341.8 nm, PDI of 0.43, zeta potential of ?34.44 mV, drug content of 99.63%, entrapment efficiency of 98.90%, and yield of 94.25%. F3 demonstrated the highest saturation solubility (0.892 mg/mL) and released 98.98% of drug within 60 min. FTIR and DSC confirmed drug–excipient compatibility, while SEM revealed discrete spherical particles.Conclusion: The optimized Ibrutinib nanosuspension demonstrated enhanced saturation solubility and dissolution, indicating the potential of nanoprecipitation as a formulation strategy for improving the biopharmaceutical performance of Ibrutinib. Further in-vivo pharmacokinetic studies are warranted.
Oral administration remains the most widely used and preferred route of drug delivery on account of its convenience, ease of administration, high patient compliance and cost-effective manufacturing. However, the clinical usefulness of a large proportion of orally administered drugs is limited not by their intrinsic pharmacological activity but by inadequate aqueous solubility and consequent poor dissolution in gastrointestinal fluids. By some estimates, more than 40% of new chemical entities emerging from contemporary drug-discovery programmes are poorly water-soluble, and this proportion is expected to rise further as high-throughput screening continues to identify potent but lipophilic candidates. The Biopharmaceutics Classification System (BCS) categorises such drugs on the basis of their aqueous solubility and intestinal permeability; BCS Class II drugs, which combine low solubility with high permeability, are of particular formulation interest because their oral bioavailability is generally dissolution-rate limited rather than permeability-limited. For this class of drugs, any formulation strategy capable of increasing the effective dissolution rate can be expected to translate into a meaningful improvement in oral absorption.
Ibrutinib is a potent, orally active, first-in-class inhibitor of Bruton's tyrosine kinase (BTK), an enzyme central to B-cell receptor signalling. By forming an irreversible covalent bond with a cysteine residue (Cys481) in the BTK active site, Ibrutinib blocks downstream phosphorylation events and B-cell proliferation and survival pathways. It is used clinically in the treatment of mantle cell lymphoma, chronic lymphocytic leukaemia/small lymphocytic lymphoma (including cases with 17p deletion), Waldenström's macroglobulinemia, marginal zone lymphoma, and chronic graft-versus-host disease. Ibrutinib is a BCS Class II compound with a reported aqueous solubility of only 0.003 mg/mL and a molecular weight of 440.5 g/mol (C25H24N6O2); the drug is rapidly but incompletely absorbed after oral dosing (Cmax ≈ 35 ng/mL; tmax 1–2 h), and its extensive hepatic metabolism (CYP3A4/CYP2D6) together with poor aqueous solubility contributes to variable systemic exposure. Improving the dissolution characteristics of Ibrutinib is therefore a rational and clinically relevant formulation objective.
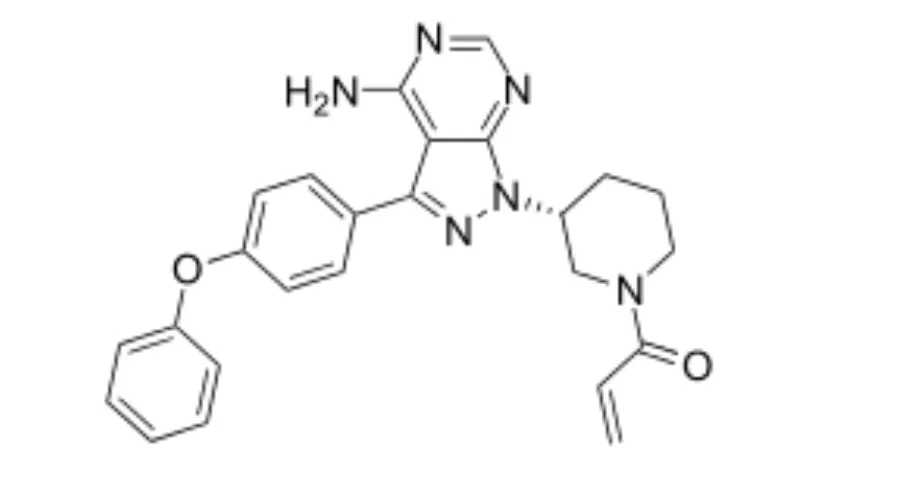
Figure 1. Chemical structure of Ibrutinib (C25H24N6O2; MW 440.5 g/mol)
According to the Noyes–Whitney equation, the dissolution rate of a solid drug is directly proportional to its available surface area and to the difference between its saturation solubility and the bulk concentration in the dissolution medium. Reduction of particle size into the nanometer range increases the specific surface area available for solvation and, in many cases, also increases the apparent saturation solubility, thereby enhancing dissolution velocity. Numerous strategies — including micronisation, solid dispersions, inclusion complexation with cyclodextrins, self-emulsifying systems, liposomes and lipid-based carriers — have been explored to overcome the dissolution-limited absorption of BCS Class II drugs, but each carries specific constraints related to drug loading, manufacturing complexity, excipient toxicity, or physical/chemical stability.
Nanosuspension technology has emerged as a comparatively simple and versatile alternative for poorly water-soluble drugs that are insoluble in both aqueous and organic media, a situation in which many classical solubilisation techniques are unworkable. A pharmaceutical nanosuspension is defined as a colloidal, biphasic dispersion of pure drug particles, typically 200–600 nm in mean diameter, stabilised in an aqueous (or other suitable) vehicle by surfactants or polymers, without the need to alter the crystalline form or chemical structure of the drug. Because the drug remains in its native crystalline or amorphous state at reduced particle size, nanosuspensions can achieve high drug loading, improved wetting, increased saturation solubility and a correspondingly higher dissolution rate, which together may translate into improved and more consistent oral bioavailability. Nanosuspensions can be prepared by "top-down" approaches such as media milling and high-pressure homogenisation, or by "bottom-up" approaches such as nanoprecipitation (solvent–antisolvent precipitation), in which a drug solution in a water-miscible organic solvent is introduced into an aqueous antisolvent phase containing a stabiliser, causing rapid nucleation and growth of nano sized drug particles as the organic solvent diffuses into the aqueous phase. Nanoprecipitation is attractive because it avoids the high energy input and equipment-related contamination risks associated with milling and homogenisation techniques.
Against this background, the present study was undertaken to formulate an Ibrutinib nanosuspension by the nanoprecipitation technique using three pharmaceutically established stabilising polymers — Carbopol, Ethyl Cellulose and Sodium Carboxymethyl Cellulose (Na CMC) — in combination with PVP K-30 and sodium lauryl sulfate, and to systematically evaluate the influence of stabiliser type and concentration on particle size, polydispersity, zeta potential, drug content, entrapment efficiency, saturation solubility and in-vitro dissolution behaviour. The overall goal was to identify an optimised Ibrutinib nanosuspension formulation with improved dissolution characteristics relative to the unmodified drug, as a step toward addressing the bioavailability limitations associated with its poor aqueous solubility.
2. MATERIALS AND METHODS
2.1 Materials
Ibrutinib was received as a gift sample from SURA LABS, Dilsukhnagar, Hyderabad, India. Carbopol, Ethyl Cellulose, Sodium Carboxymethyl Cellulose (Na CMC), PVP K-30, sodium lauryl sulfate (SLS) and methanol were procured from Merck Limited, Mumbai, India. Purified water was used throughout the study. All materials used are summarised in Table 1.
Table 1. Materials used and their sources
|
Material |
Source |
|
Ibrutinib |
Gift sample, SURA LABS, Dilsukhnagar, Hyderabad |
|
Carbopol |
Merck Limited, Mumbai, India |
|
Ethyl Cellulose |
Merck Limited, Mumbai, India |
|
Sodium CMC |
Merck Limited, Mumbai, India |
|
PVP K-30 |
Merck Limited, Mumbai, India |
|
Sodium lauryl sulfate (SLS) |
Merck Limited, Mumbai, India |
|
Methanol |
Merck Limited, Mumbai, India |
|
Purified water |
In-house |
2.2 Instruments
The major equipment employed during formulation and evaluation, along with the respective manufacturers, is listed in Table 2.
Table 2. Instruments used
|
Equipment |
Manufacturer / Model |
|
Electronic weighing balance |
Sartorius |
|
Dissolution test apparatus (USP II) |
Lab India, Mumbai, India |
|
UV–Visible spectrophotometer |
Lab India, Mumbai, India |
|
pH meter |
Lab India, Mumbai, India |
|
FT-IR spectrophotometer |
Bruker, Germany |
|
Ultrasonic bath cleaner |
Remi Laboratories |
|
Scanning Electron Microscope |
JEOL Ltd., Japan (Model JSM-840A) |
|
Homogenizer |
Kinematica AG, Poly-tron PT2100 |
|
Rotary evaporator |
Super Fit Instruments, Mumbai |
|
Vacuum pump |
SH TID-75, oil-free diaphragm type |
|
Lyophilizer |
Lyophilisation Systems India Pvt. Ltd. |
|
Particle size analyzer |
Malvern Instruments |
|
Zeta potential analyzer |
Malvern Instruments |
|
Magnetic stirrer |
REMI 2MLH, Remi International, Mumbai |
|
Mechanical stirrer |
RQ-122, Remi Instruments, Vasai |
|
Probe sonicator |
Model UP100H, Dr Hielscher Ultrasonics GmbH, Germany |
|
Brookfield viscometer |
Brookfield Engineering Laboratories Inc., USA |
|
Centrifuge |
Rotex Instruments, Kerala |
|
Differential Scanning Calorimeter |
Hitachi DSC 7020 |
2.3 Preformulation Studies
Organoleptic characteristics (colour, odour, physical state) of Ibrutinib were examined visually. The melting point was determined by the capillary-tube method as per USP, and solubility was assessed by the equilibrium visual-observation method in water, phosphate buffer pH 6.8, 0.1N HCl, ethanol, dimethyl sulfoxide (DMSO) and dimethylformamide (DMF), using 100 mg of drug per 10 mL of solvent.
2.4 Analytical Method Development
The absorption maximum (λmax) of Ibrutinib was determined by scanning a dilute solution of the drug in 0.1N HCl between 200 and 400 nm against a 0.1N HCl blank using a UV-Visible spectrophotometer. A standard (Beer–Lambert) calibration curve was subsequently constructed in 0.1N HCl over the concentration range of 5–25 µg/mL by serial dilution of a primary stock solution (100 mg of Ibrutinib in 100 mL of 0.1N HCl), with absorbance recorded at the identified λmax.
2.5 Drug–Excipient Compatibility Studies
Fourier Transform Infrared (FTIR) spectra of the pure drug and of the optimised formulation were recorded on a Bruker FTIR spectrophotometer (Alpha-T, Germany) over the wavenumber range 4000–550 cm-1 using the ZnSe crystal attenuated total reflectance accessory. Differential Scanning Calorimetry (DSC) was carried out on a Hitachi DSC 7020 using 5–15 mg samples sealed in aluminium pans, heated at 10 °C/min from 30 to 350 °C under a nitrogen purge of 50 mL/min, to detect any thermal interaction between drug and polymeric stabilisers.
2.6 Preparation of Ibrutinib Nanosuspension by Nanoprecipitation
Ibrutinib nanosuspensions were prepared by the nanoprecipitation (solvent–antisolvent) technique. For each batch, 140 mg of Ibrutinib was accurately weighed and dissolved in 50 mL of methanol to form the organic (drug) phase. In parallel, the required quantities of the polymeric stabiliser (Carbopol, Ethyl Cellulose or Na CMC), together with PVP K-30 (20 mg) and sodium lauryl sulfate (15 mg), were dissolved/dispersed in 10 mL of purified water to constitute the aqueous phase. The aqueous phase was placed on a magnetic stirrer and maintained under continuous stirring at 900–1000 rpm at room temperature. The methanolic drug solution was then added dropwise into the aqueous phase using a syringe under continuous stirring, promoting rapid antisolvent precipitation and nucleation of nanosized drug particles. Stirring was continued after complete addition of the organic phase until the methanol had evaporated sufficiently and a visually uniform nanosuspension was obtained. The resulting nanosuspension was collected and stored for further characterisation. Nine formulations (F1–F9) were prepared by varying the stabiliser type (Carbopol, Ethyl Cellulose, Na CMC) and concentration (100, 150 and 200 mg), while keeping the drug, PVP K-30, SLS, methanol and water quantities constant, as summarised in Table 3.
Table 3. Composition of Ibrutinib nanosuspension formulations (F1–F9)
|
Ingredient (mg/mL) |
F1 |
F2 |
F3 |
F4 |
F5 |
F6 |
F7 |
F8 |
F9 |
|
Ibrutinib (mg) |
140 |
140 |
140 |
140 |
140 |
140 |
140 |
140 |
140 |
|
Carbopol (mg) |
100 |
150 |
200 |
– |
– |
– |
– |
– |
– |
|
Ethyl Cellulose (mg) |
– |
– |
– |
100 |
150 |
200 |
– |
– |
– |
|
Na CMC (mg) |
– |
– |
– |
– |
– |
– |
100 |
150 |
200 |
|
PVP K-30 (mg) |
20 |
20 |
20 |
20 |
20 |
20 |
20 |
20 |
20 |
|
SLS (mg) |
15 |
15 |
15 |
15 |
15 |
15 |
15 |
15 |
15 |
|
Methanol (mL) |
50 |
50 |
50 |
50 |
50 |
50 |
50 |
50 |
50 |
|
Purified water (mL) |
10 |
10 |
10 |
10 |
10 |
10 |
10 |
10 |
10 |
2.7 Evaluation of Ibrutinib Nanosuspension
Particle size and polydispersity index (PDI): The mean particle size and PDI of each formulation were determined by dynamic light scattering (DLS) using a Malvern particle-size analyzer after appropriate dilution of the nanosuspension with deionised water. A lower PDI value indicates a comparatively narrower and more uniform particle-size distribution.
Zeta potential: The surface charge (zeta potential) of the nanosuspensions was measured using a Malvern Zetasizer. The instrument determines electrophoretic mobility from the frequency shift of scattered light (measured at a detection angle of 130°) generated as charged particles move under an applied electric field, and calculates the corresponding zeta potential.
Drug content and entrapment efficiency (EE):
The freshly prepared nanosuspension was centrifuged at 20,000 rpm for 20 min at 5 °C. The unentrapped (free) drug present in the supernatant was quantified spectrophotometrically at 288 nm against a blank nanosuspension, and the entrapment efficiency was calculated by the difference between the total drug added and the free drug detected in the supernatant, relative to the total drug added. All measurements were performed in triplicate.
Percentage yield: Percentage practical yield was calculated from the ratio of the actual quantity of nanosuspension/drug recovered to the theoretical quantity taken for formulation.
Saturation solubility: An excess quantity of each nanosuspension was equilibrated in 10 mL of purified water, centrifuged at 10,000 rpm for 15 minutes, and the supernatant was filtered (0.45 µm membrane), suitably diluted and analysed spectrophotometrically at 288 nm to determine the saturation solubility of Ibrutinib from each formulation.
Viscosity: The viscosity of each nanosuspension was measured using a Brookfield rotational viscometer with a suitable spindle at 37 ± 0.5 °C after thermal equilibration.
Surface morphology (SEM): The surface morphology of the optimised (F3) nanosuspension was examined using a scanning electron microscope (JEOL JSM-840A, Japan) after gold–palladium sputter coating of the dried sample, operated at an accelerating voltage of 15 kV.
In-vitro dissolution studies: In-vitro drug release from all nine formulations was studied using USP Dissolution Apparatus II (paddle method) at 50 rpm, in 900 mL of 0.1N HCl maintained at 37.0 ± 0.5 °C. Aliquots of 5 mL were withdrawn at 0, 5, 10, 15, 20, 25, 30, 45 and 60 minutes and replaced with an equal volume of fresh dissolution medium. Withdrawn samples were filtered (0.45 µm PVDF filter), suitably diluted, and analysed spectrophotometrically at 288 nm against a 0.1N HCl blank; percentage cumulative drug release was calculated using the previously established calibration curve.
3. RESULTS
3.1 Preformulation and Identification Studies
Ibrutinib was obtained as an odourless, white, solid powder, consistent with its reported description. The observed melting point of the drug (150.2 °C) fell within the reported range of 149–158 °C, confirming the identity and purity of the sample (Table 4).
Table 4. Organoleptic properties and melting-point verification of Ibrutinib
|
Parameter |
Observation |
|
Physical state |
Solid |
|
Colour |
White |
|
Odour |
Odourless |
|
Reported melting point (°C) |
149–158 |
|
Observed melting point (°C) |
150.2 |
Solubility studies indicated that Ibrutinib was freely soluble in ethanol, DMSO and DMF (Table 5), while its solubility in aqueous media was markedly lower, being highest in phosphate buffer pH 6.8, followed by 0.1N HCl and water (Table 6).
Table 5. Solubility of Ibrutinib in organic solvents
|
Solvent |
Solubility |
|
Ethanol |
Freely soluble |
|
DMSO |
Freely soluble |
|
DMF |
Freely soluble |
Table 6. Solubility of Ibrutinib in aqueous media (mean ± SD)
|
Medium |
Solubility of pure drug (µg/mL) |
|
Water |
0.201 ± 0.01 |
|
Phosphate buffer pH 6.8 |
0.212 ± 0.05 |
|
0.1N HCl |
0.565 ± 0.09 |
3.2 Analytical Method
The UV absorption spectrum of Ibrutinib in 0.1N HCl exhibited a well-defined absorption maximum at 288 nm (Figure 2), which was accordingly selected as the analytical wavelength for all subsequent spectrophotometric estimations.
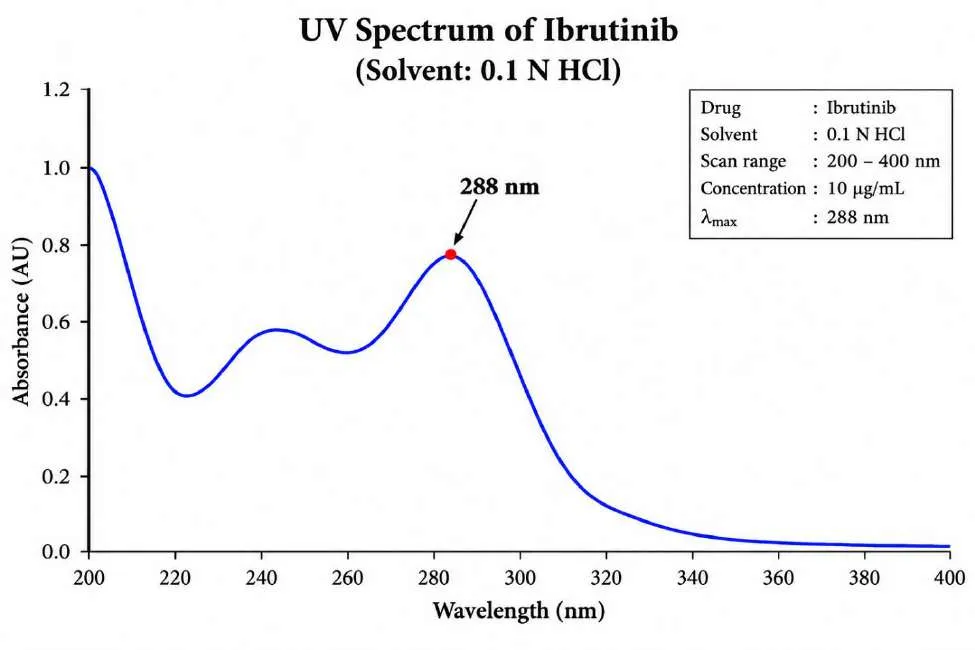
Figure 2. UV absorption spectrum of Ibrutinib in 0.1N HCl showing λmax at 288 nm
A linear calibration curve was obtained over the concentration range of 5–25 µg/mL (Table 7), described by the regression equation y = 0.0209x + 0.0057 with a correlation coefficient (R²) of 0.9984, confirming good linearity and reproducibility of the method (Figure 3).
Table 7. Calibration data for Ibrutinib in 0.1N HCl at 288 nm
|
Concentration (µg/mL) |
Absorbance |
|
0 |
0.000 |
|
5 |
0.119 |
|
10 |
0.215 |
|
15 |
0.322 |
|
20 |
0.412 |
|
25 |
0.535 |
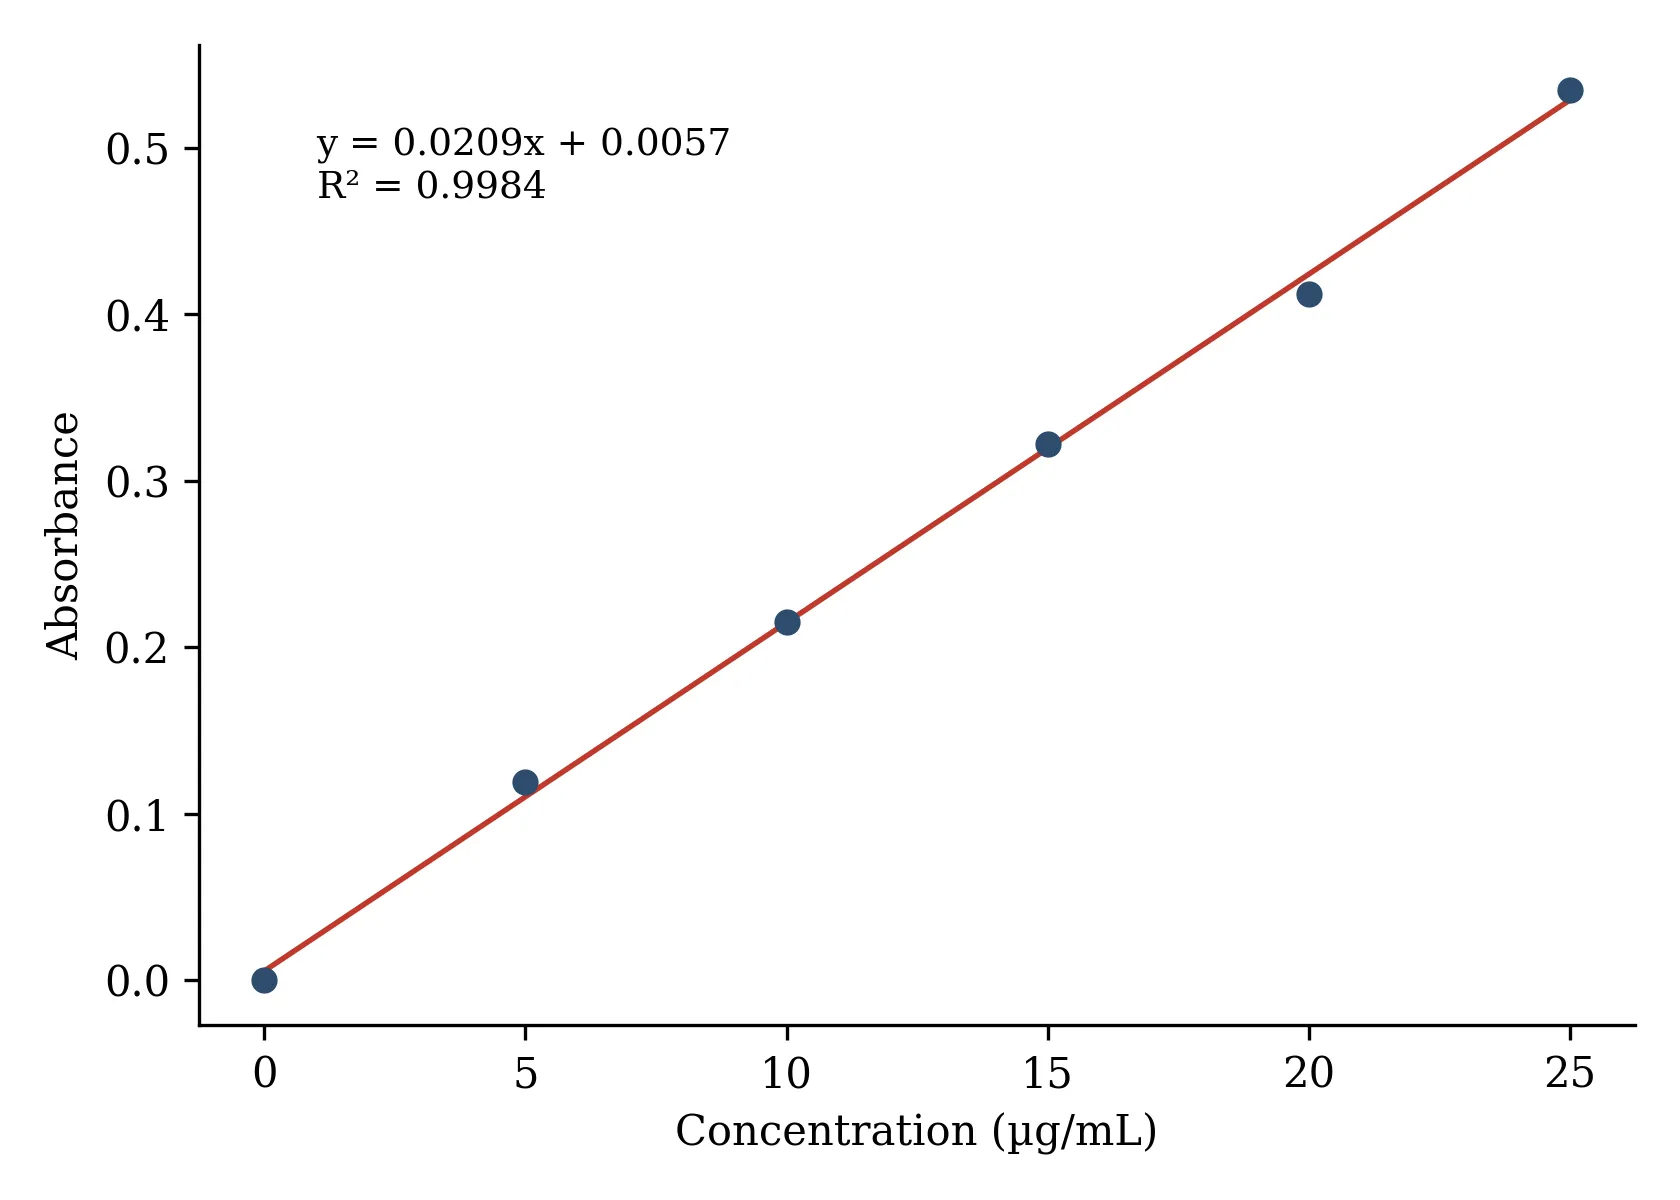
Figure 3. Calibration curve of Ibrutinib in 0.1N HCl (288 nm); y = 0.0209x + 0.0057, R² = 0.9984
3.3 Drug–Excipient Compatibility
FTIR spectra of the pure drug and of the optimised nanosuspension formulation (Figure 4) showed retention of all the principal characteristic absorption bands of Ibrutinib, with no appreciable shift, disappearance, or emergence of new peaks. This indicated the absence of any significant chemical interaction between the drug and the polymeric excipients used in the formulation.
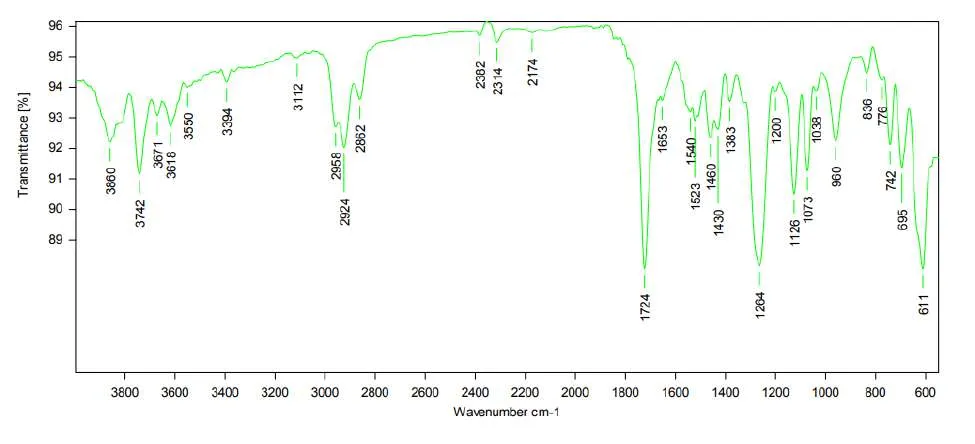
Figure 4a. FTIR spectrum of pure Ibrutinib
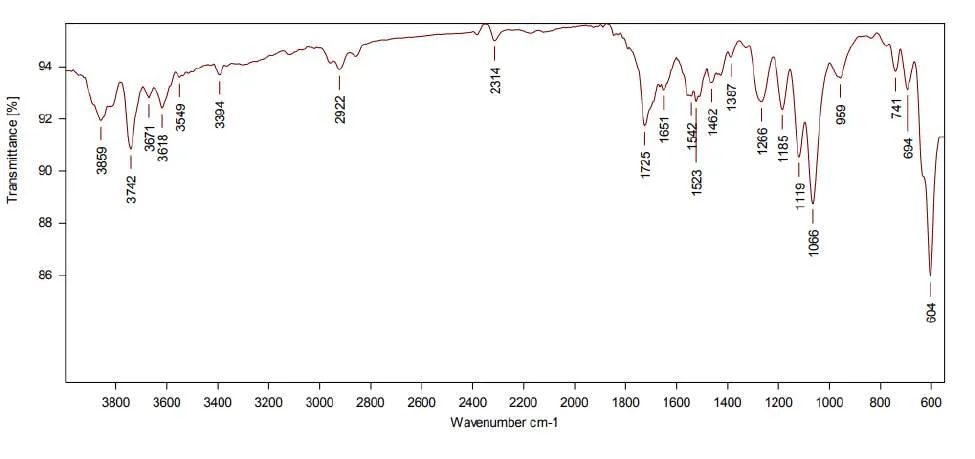
Figure 4b. FTIR spectrum of the optimised (F3) Ibrutinib nanosuspension
DSC analysis of the pure drug (Figure 5) showed a sharp endothermic peak at approximately 151.4 °C, corresponding to the melting transition of crystalline Ibrutinib and consistent with the capillary melting-point determination, along with a smaller thermal event near 74.6–76.6 °C. The sharpness of the principal melting endotherm is indicative of a well-defined crystalline drug substance.
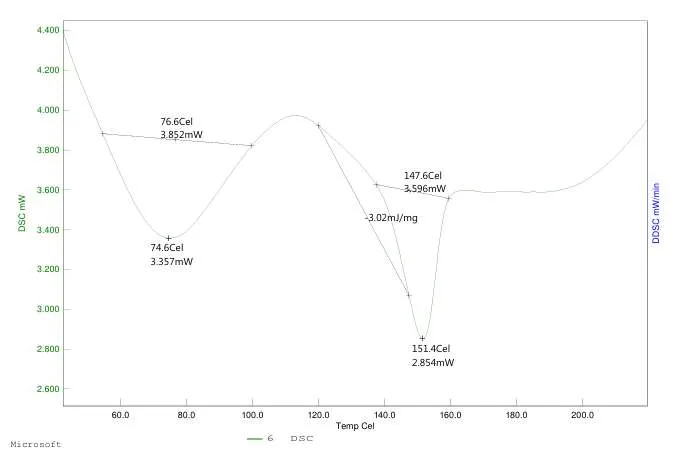
Figure 5. DSC thermogram of pure Ibrutinib
3.4 Percentage Yield, Drug Content and Entrapment Efficiency
All nine formulations showed satisfactory recovery and drug loading (Table 8). Entrapment efficiency ranged from 83.25% (F7) to 98.90% (F3); drug content ranged from 78.23% (F7) to 99.63% (F3); and percentage yield ranged from 74.63% (F4) to 94.25% (F3). Formulation F3, containing the highest concentration of Carbopol (200 mg, drug:polymer ratio 1:1.43 ~ 1:3 on a proportion basis), consistently exhibited the highest values across all three parameters.
Table 8. Percentage yield, drug content and entrapment efficiency of Ibrutinib nanosuspension formulations (F1–F9)
|
Formulation |
Entrapment efficiency (%) |
Drug content (%) |
Percentage yield (%) |
|
F1 |
92.51 |
86.10 |
90.33 |
|
F2 |
94.63 |
94.26 |
91.63 |
|
F3 |
98.90 |
99.63 |
94.25 |
|
F4 |
85.12 |
84.26 |
74.63 |
|
F5 |
90.20 |
91.56 |
78.33 |
|
F6 |
94.99 |
92.62 |
86.30 |
|
F7 |
83.25 |
78.23 |
76.99 |
|
F8 |
85.63 |
86.60 |
85.12 |
|
F9 |
96.39 |
90.22 |
88.48 |
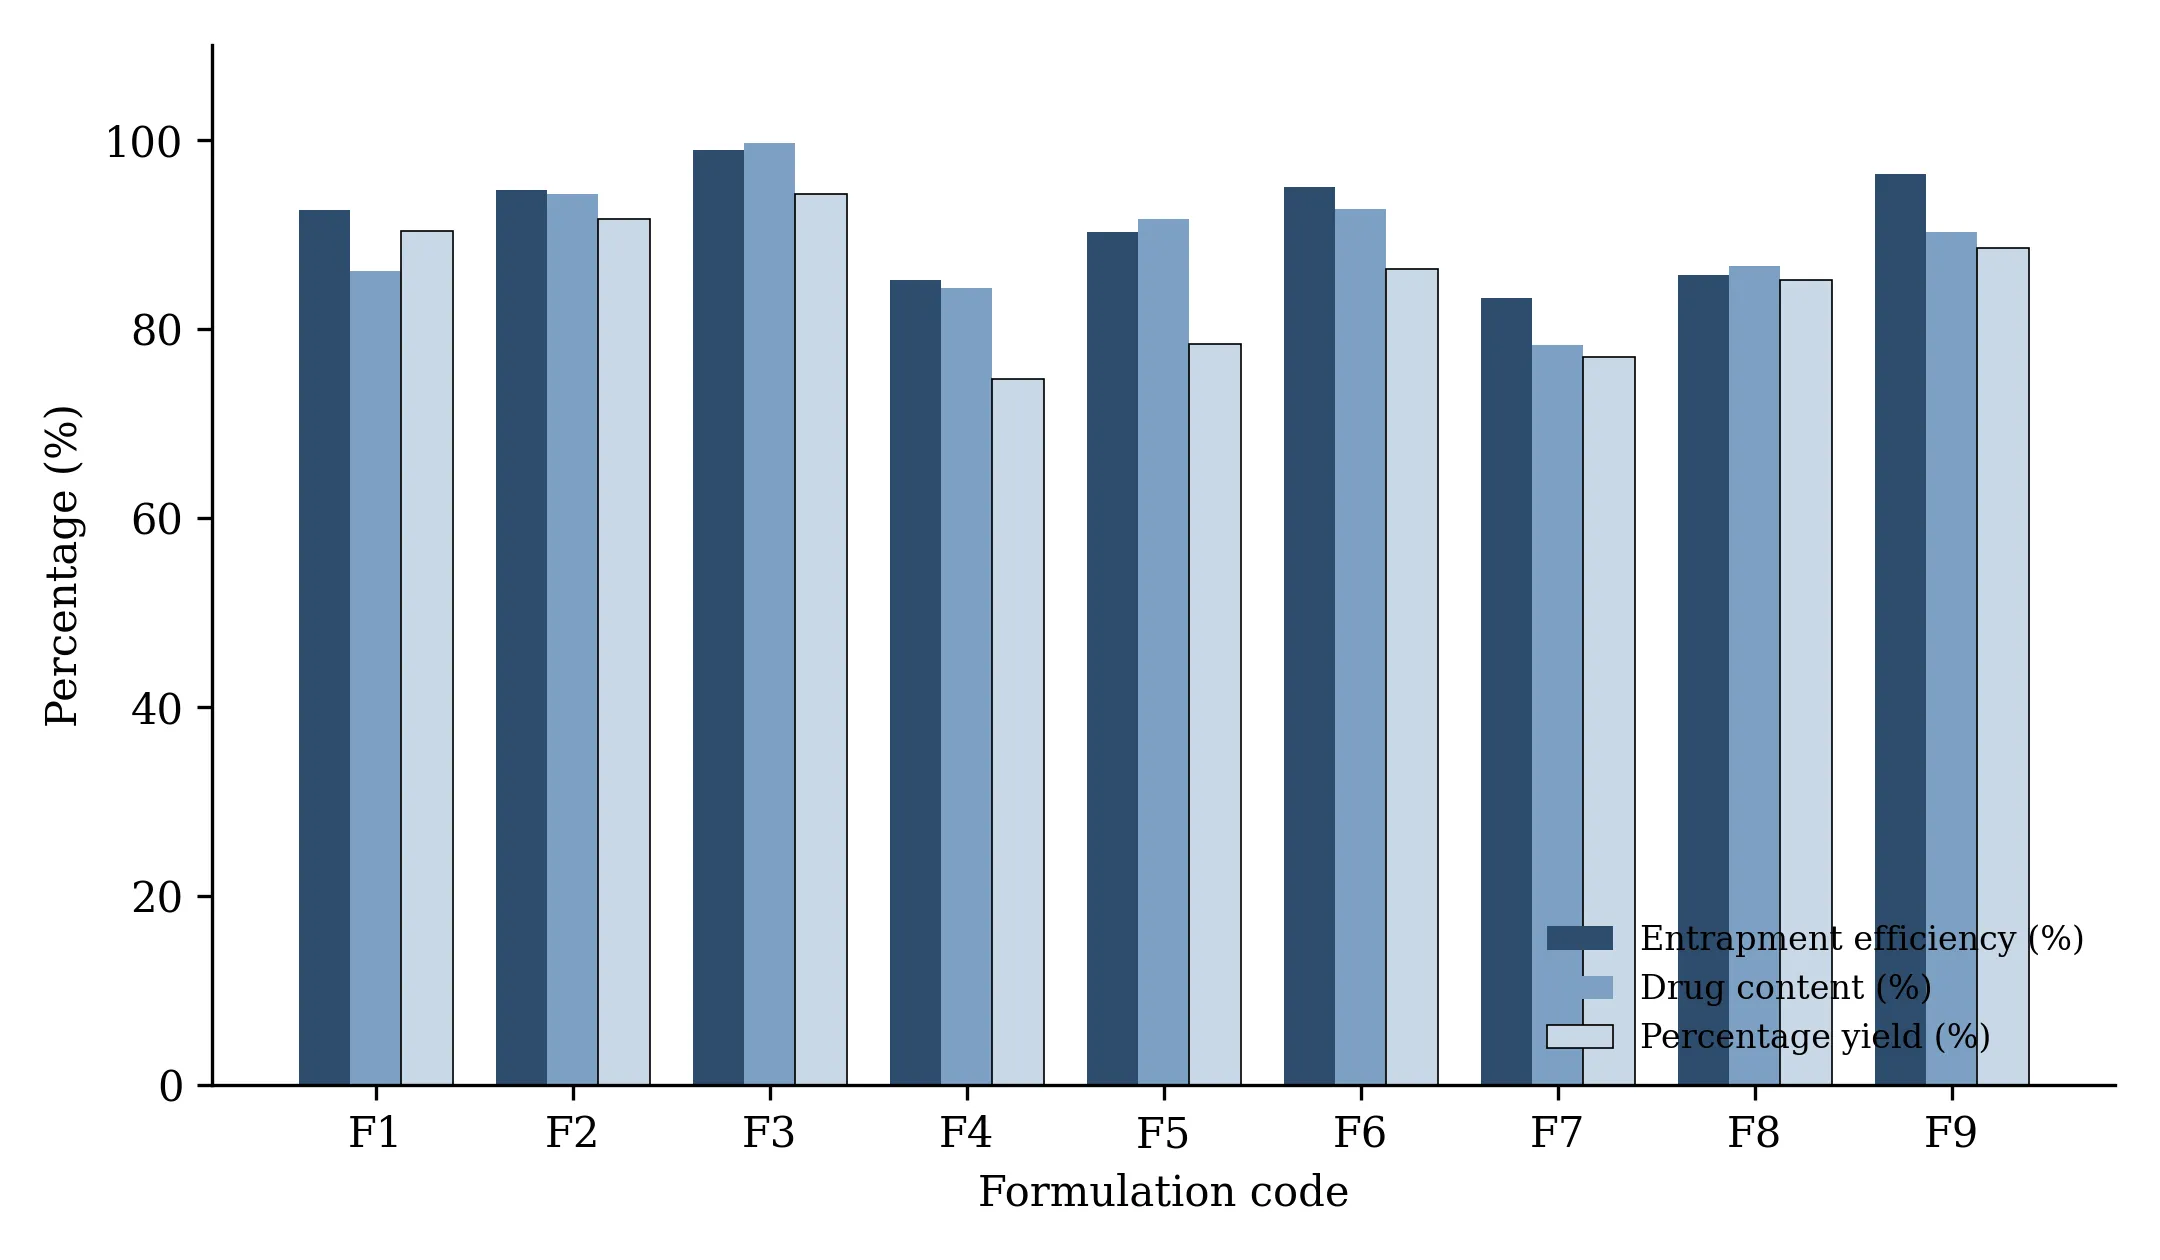
Figure 6. Entrapment efficiency, drug content and percentage yield of formulations F1–F9
3.5 Particle Size, Polydispersity Index and Zeta Potential
The mean particle size of the nine formulations ranged from 260.4 nm (F9) to 453.2 nm (F6), confirming that all formulations were within the sub-micron (nanometre) range (Table 9). Formulation F3 exhibited a mean particle size of 341.8 nm with the lowest PDI of the series (0.43), indicating the most homogeneous particle-size distribution among the batches tested; several other formulations (F1, F4, F8, F9) showed PDI values exceeding 0.7, reflecting comparatively broader and less uniform size distributions. Zeta potential values ranged from −18.51 mV (F4) to −34.44 mV (F3); the markedly higher negative zeta potential of F3 indicates stronger electrostatic (and, given the nature of Carbopol, additional steric) repulsion between particles, favouring physical stability against aggregation.
Table 9. Particle size, polydispersity index and zeta potential of Ibrutinib nanosuspension formulations (F1–F9)
|
Formulation |
Particle size (nm) |
PDI |
Zeta potential (mV) |
|
F1 |
278.6 |
0.75 |
−22.16 |
|
F2 |
312.4 |
0.56 |
−21.30 |
|
F3 |
341.8 |
0.43 |
−34.44 |
|
F4 |
365.2 |
1.10 |
−18.51 |
|
F5 |
398.7 |
0.71 |
−27.19 |
|
F6 |
453.2 |
0.60 |
−19.32 |
|
F7 |
329.5 |
0.52 |
−25.49 |
|
F8 |
295.8 |
1.20 |
−26.56 |
|
F9 |
260.4 |
1.31 |
−21.22 |
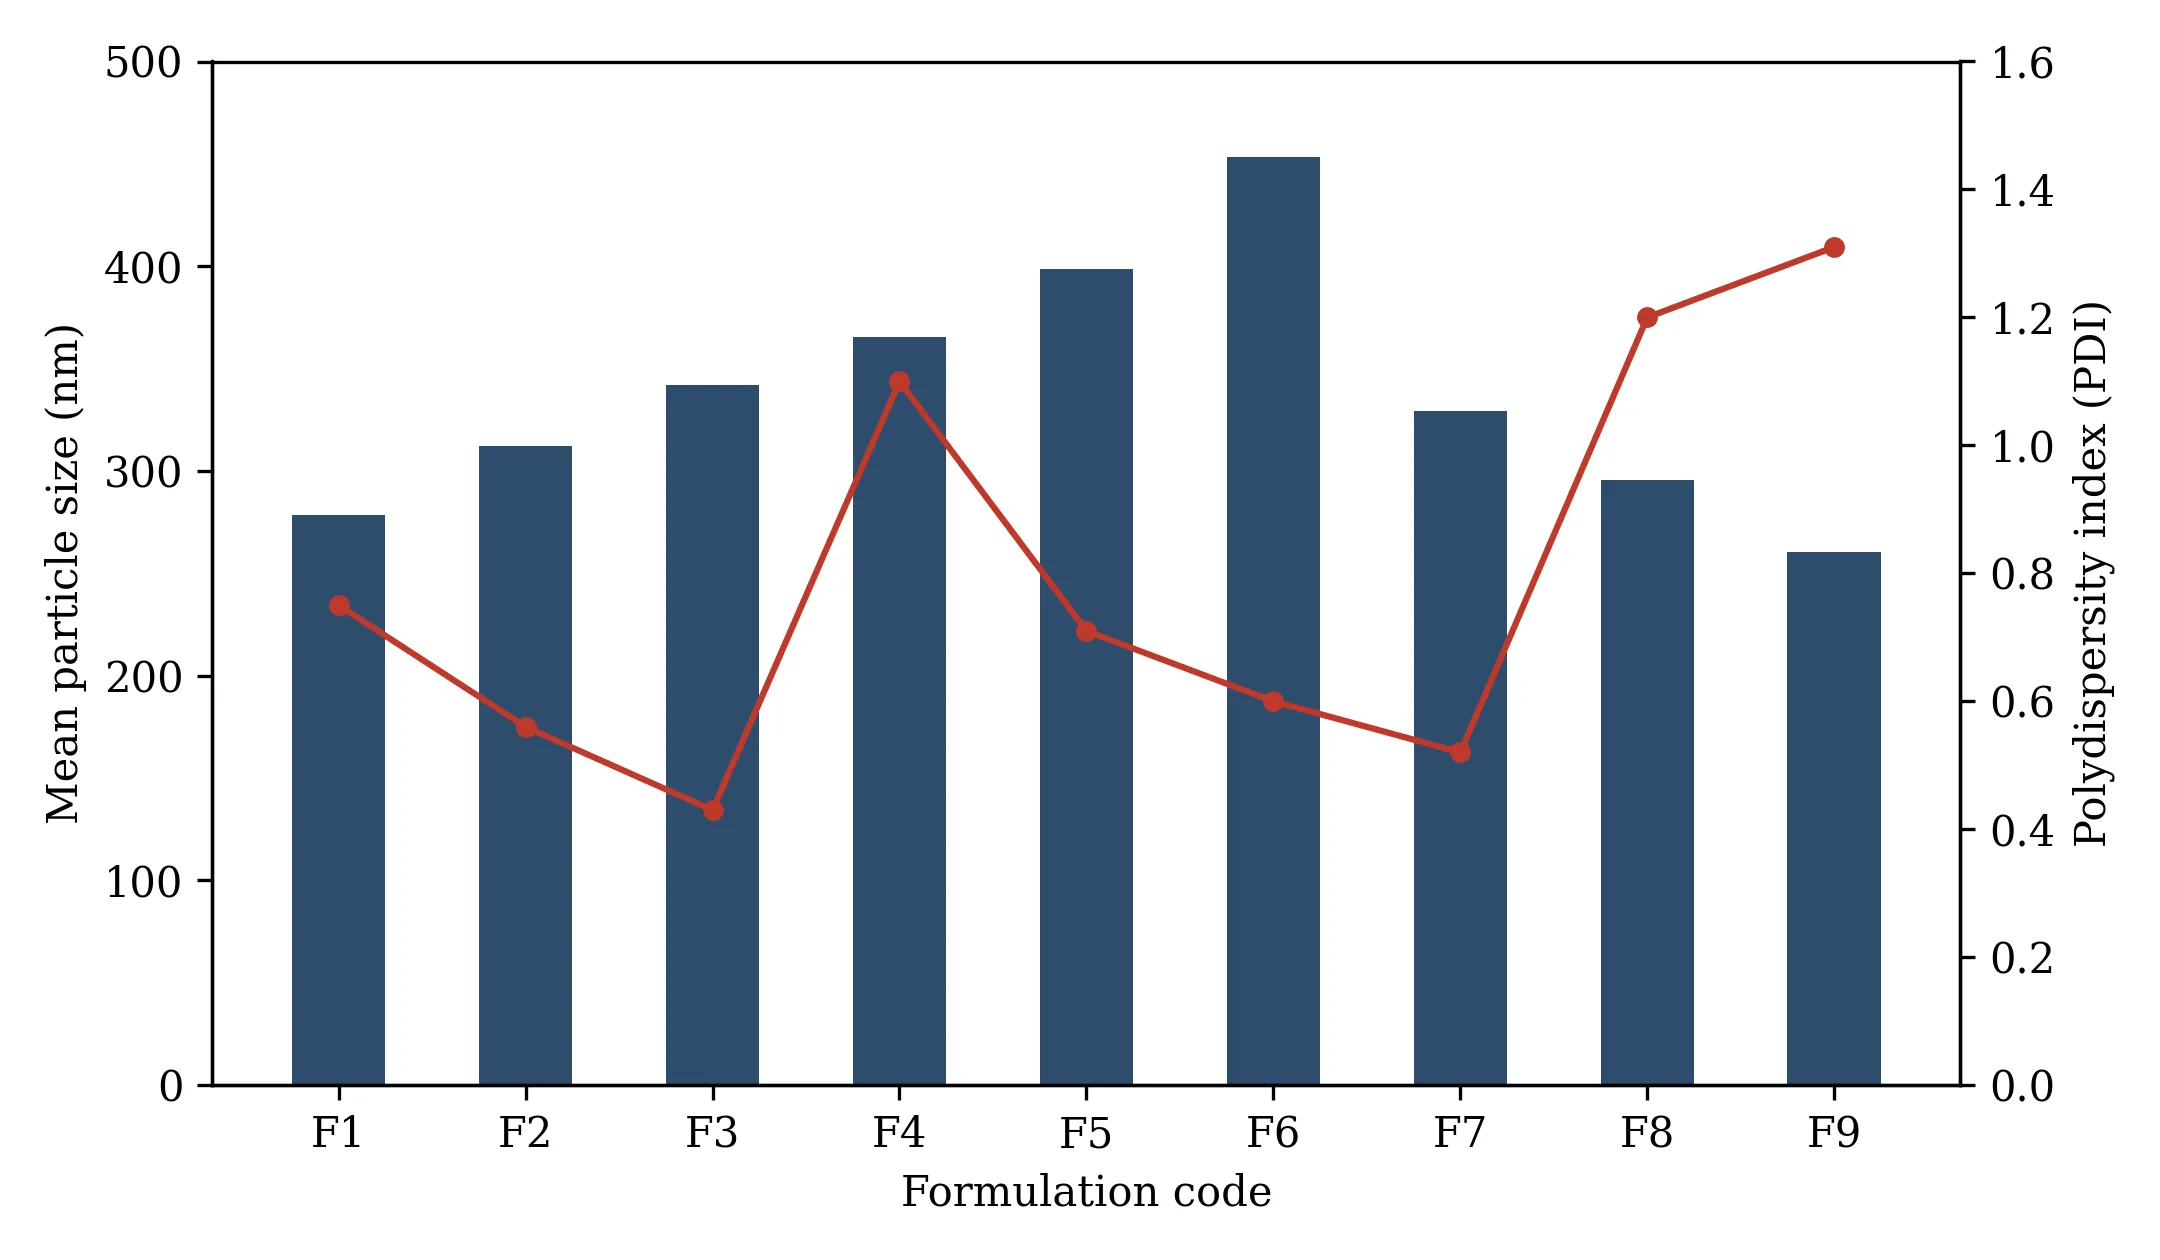
Figure 7. Mean particle size (bars) and polydispersity index (line) of formulations F1–F9
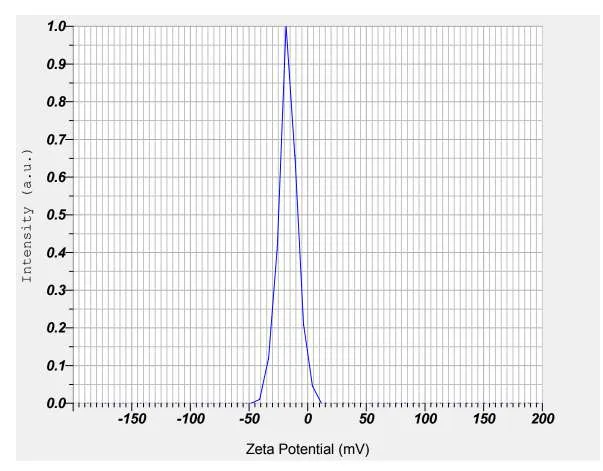
Figure 8. Representative zeta-potential distribution profile of the optimised (F3) Ibrutinib nanosuspension
3.6 Saturation Solubility and Viscosity
Saturation solubility in purified water improved substantially for all nanosuspension formulations relative to the aqueous solubility of the pure drug (0.201 ± 0.01 µg/mL), consistent with the expected effect of particle-size reduction on apparent solubility. The highest saturation solubility (0.892 mg/mL) was recorded for formulation F3, attributable to its reduced particle size, narrow size distribution and correspondingly increased effective surface area. Viscosity of the dispersion medium was low and comparable across formulations (0.871–0.898 mPa·s), indicating that the nanosuspensions retained an easily pourable, low-viscosity consistency suitable for oral administration (Table 10).
Table 10. Saturation solubility and viscosity of Ibrutinib nanosuspension formulations (F1–F9)
|
Formulation |
Saturation solubility in water (mg/mL) |
Viscosity (mPa·s) |
|
F1 |
0.752 |
0.893 |
|
F2 |
0.812 |
0.890 |
|
F3 |
0.892 |
0.898 |
|
F4 |
0.436 |
0.886 |
|
F5 |
0.556 |
0.871 |
|
F6 |
0.610 |
0.878 |
|
F7 |
0.522 |
0.873 |
|
F8 |
0.496 |
0.871 |
|
F9 |
0.636 |
0.872 |
3.7 In-Vitro Drug Release
The in-vitro release profiles of all nine formulations in 0.1N HCl over 60 minutes are summarised in Table 11 and Figure 9. Formulation F3 exhibited the fastest and most complete release, reaching 54.12% at 5 minutes and 98.98% cumulative release by 60 minutes, and consistently remained the highest-releasing formulation at every sampling interval. Formulation F4 showed the slowest and least complete release, reaching only 72.63% at 60 minutes. Overall, the Carbopol-stabilised formulations (F1–F3) showed a concentration-dependent improvement in release rate with increasing Carbopol content, whereas the Ethyl-Cellulose-stabilised formulations (F4–F6), consistent with the hydrophobic, film-forming character of Ethyl Cellulose, showed comparatively slower release. The Na-CMC-stabilised formulations (F7–F9) showed intermediate release behaviour.
Table 11. Cumulative percentage in-vitro drug release from Ibrutinib nanosuspension formulations (F1–F9) in 0.1N HCl
|
Time (min) |
F1 |
F2 |
F3 |
F4 |
F5 |
F6 |
F7 |
F8 |
F9 |
|
0 |
0 |
0 |
0 |
0 |
0 |
0 |
0 |
0 |
0 |
|
5 |
22.10 |
30.10 |
54.12 |
20.15 |
34.15 |
45.93 |
18.43 |
23.14 |
27.41 |
|
10 |
26.51 |
38.08 |
70.66 |
32.25 |
49.36 |
56.20 |
26.96 |
30.94 |
33.75 |
|
15 |
42.36 |
50.92 |
74.25 |
40.76 |
53.02 |
62.09 |
33.09 |
48.37 |
51.14 |
|
20 |
45.95 |
56.36 |
80.36 |
48.91 |
56.20 |
70.34 |
42.14 |
55.19 |
58.43 |
|
25 |
53.02 |
62.14 |
87.44 |
57.24 |
70.14 |
76.66 |
58.27 |
62.24 |
65.18 |
|
30 |
56.96 |
67.61 |
92.03 |
63.86 |
75.66 |
80.25 |
63.19 |
68.83 |
71.27 |
|
45 |
61.02 |
79.20 |
97.12 |
67.34 |
78.93 |
85.11 |
79.34 |
70.14 |
75.54 |
|
60 |
73.95 |
89.66 |
98.98 |
72.63 |
84.75 |
88.39 |
80.15 |
85.72 |
83.78 |
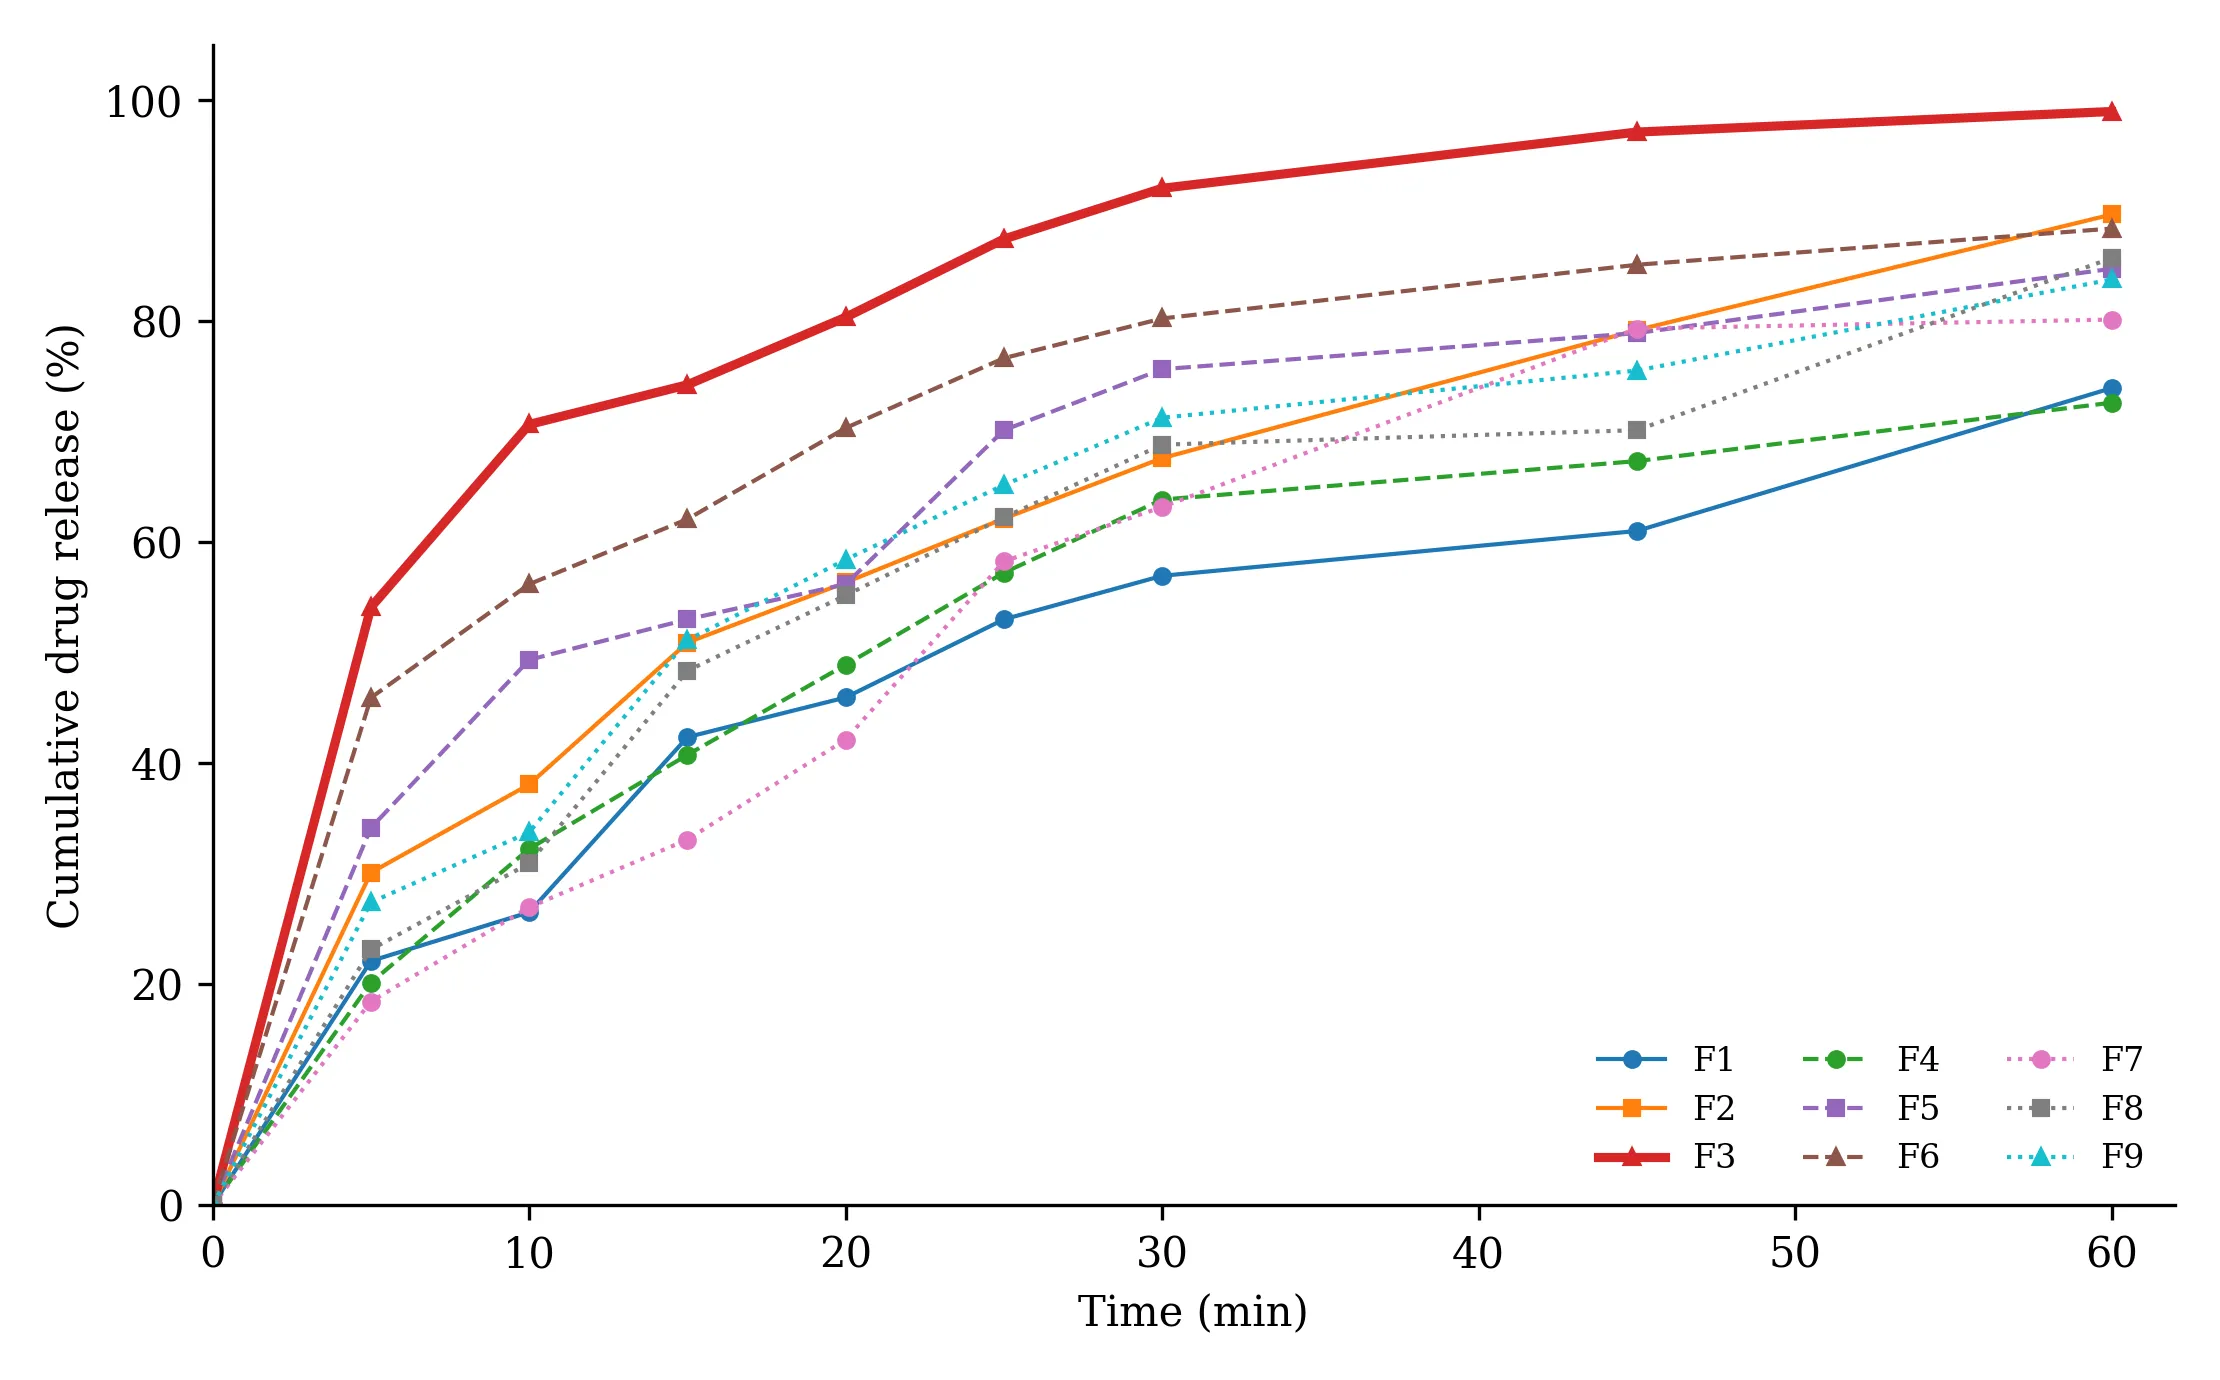
Figure 9. Cumulative in-vitro drug release profiles of formulations F1–F9 in 0.1N HCl (0–60 min)
3.8 Surface Morphology (SEM) and Selection of Optimised Formulation
Scanning electron microscopy of the optimised (F3) nanosuspension revealed discrete, predominantly spherical particles with a smooth surface, with individual particles in the SEM field measuring approximately 65–82 nm across the imaged region (Figure 10); the somewhat larger hydrodynamic diameter obtained by DLS (341.8 nm) relative to the individual particle dimensions observed by SEM is consistent with a degree of soft agglomeration or hydration-layer contribution in the dispersed state, a phenomenon commonly reported when comparing dry-state electron microscopy with solution-based dynamic light scattering for nanosuspensions.
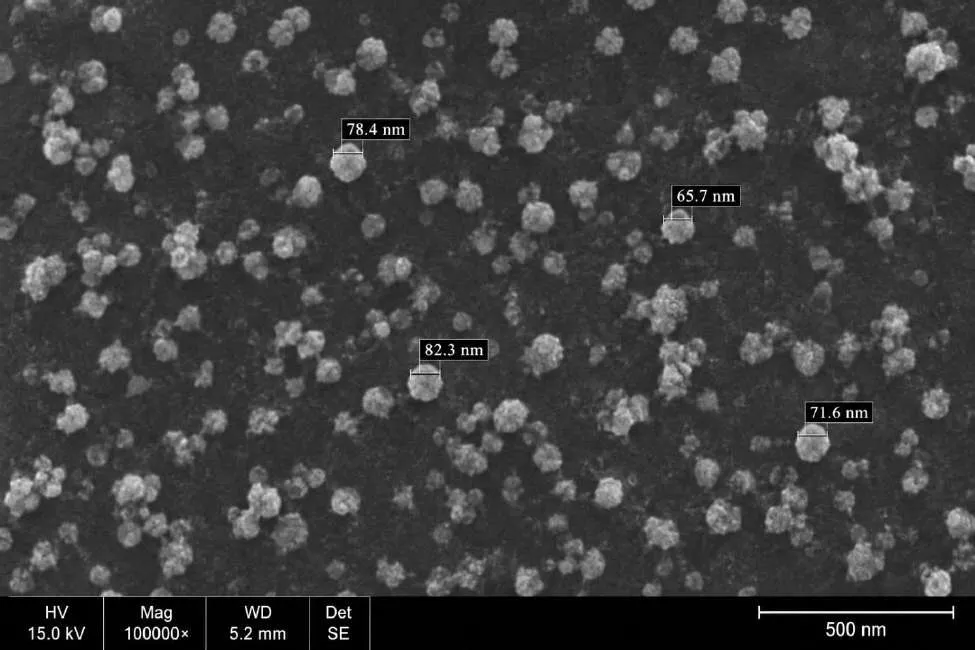
Figure 10. Scanning electron micrograph of the optimised (F3) Ibrutinib nanosuspension
Taking together particle size, PDI, zeta potential, drug content, entrapment efficiency, percentage yield, saturation solubility and in-vitro release performance, formulation F3 (Ibrutinib:Carbopol, 140:200 mg) was identified as the optimised Ibrutinib nanosuspension prepared by nanoprecipitation.
DISCUSSION
The present findings demonstrate that nanoprecipitation is a viable, low-energy technique for converting the poorly water-soluble BCS Class II drug Ibrutinib into a stable, sub-micron nanosuspension. The measured aqueous solubility of the pure drug (0.201–0.565 µg/mL depending on medium) confirms the severity of its dissolution-limited behaviour and supports the rationale, articulated in the Introduction, that particle-size reduction according to Noyes–Whitney principles should meaningfully increase the effective surface area and dissolution rate of the drug.
Comparison across the nine formulations shows that particle size alone is not a sufficient predictor of nanosuspension quality. Formulation F9 (Na CMC, 200 mg) produced the smallest mean particle size (260.4 nm), yet its PDI (1.31) and zeta potential (−21.22 mV) were both less favourable than those of F3, and its cumulative drug release (83.78% at 60 min) was correspondingly lower than that of F3. In contrast, F3, despite a somewhat larger mean particle size (341.8 nm), combined the narrowest size distribution (PDI 0.43), the highest-magnitude zeta potential (−34.44 mV) and the greatest cumulative release (98.98%) in the series. This pattern indicates that the uniformity of the particle population and the strength of the stabilising interfacial layer — rather than particle size in isolation — are the principal determinants of both physical stability and functional dissolution performance in this system, a conclusion broadly consistent with reports on nanosuspension formulation of other poorly soluble drugs, where a suitably charged and sterically stabilising polymer layer was similarly identified as critical to preventing Ostwald ripening and aggregation during and after precipitation.The concentration-dependent trend among the Carbopol-stabilised batches (F1 → F2 → F3, with increasing Carbopol from 100 to 200 mg) toward higher entrapment efficiency, drug content, yield, zeta potential and dissolution rate suggests that Carbopol, an anionic, high-molecular-weight polyacrylic acid polymer, provides progressively stronger electrosteric stabilisation of the precipitating drug nanoparticles as its concentration is increased, limiting particle growth and coalescence during the antisolvent precipitation step. This is consistent with earlier reports describing polymeric and amphiphilic stabilisers as effective agents for controlling nanocrystal growth and preventing agglomeration during nanoprecipitation and related bottom-up processes. By contrast, the Ethyl-Cellulose-stabilised formulations (F4–F6) showed comparatively larger particle sizes, lower zeta potential magnitudes, and slower dissolution, plausibly reflecting the more hydrophobic, film-forming nature of Ethyl Cellulose, which may retard both particle stabilisation during precipitation and subsequent wetting and dissolution of the drug in the aqueous medium. The Na-CMC-stabilised formulations (F7–F9) occupied an intermediate position, generally showing small particle sizes but relatively higher PDI values, indicating that, although Na CMC was capable of yielding fine particles, it was less effective at maintaining a narrow and reproducible size distribution than Carbopol under the conditions employed.The dissolution enhancement observed with the optimised formulation F3 (98.98% release at 60 min, compared with 72.63–89.66% for the remaining formulations) is consistent with the expected consequences of nanosisation: an increase in effective surface area available for solvation, improved wetting by the incorporated surfactant (SLS) and stabiliser, and a probable increase in apparent saturation solubility, in line with the higher measured saturation solubility of F3 (0.892 mg/mL) relative to the other batches. These observations parallel trends reported for other nanosuspensions prepared by nanoprecipitation or related bottom-up methods, in which optimised formulations bearing an appropriately selected polymer/surfactant combination consistently achieved cumulative release in excess of 90–99% within 30–60 minutes, together with comparable particle-size ranges (of the order of a few hundred nanometres) and moderate-to-high negative zeta potentials indicative of adequate colloidal stability.The FTIR and DSC data obtained for the optimised formulation provide complementary evidence that the dissolution enhancement observed is attributable to a physical (particle-size and surface-area) effect rather than to a chemical modification of the drug. The retention of all principal FTIR absorption bands of Ibrutinib in the optimised formulation, without shift or loss, indicates the absence of covalent interaction or degradation of the drug in the presence of the selected stabilisers, while the sharp DSC melting endotherm of the pure drug at approximately 151.4 °C, closely matching the observed capillary melting point (150.2 °C) and the pharmacopoeial range (149–158 °C), confirms that the starting material used in this study was crystalline and of acceptable purity. Taken together, these findings support the conclusion that the drug retained its molecular identity throughout the nanoprecipitation process and that the observed differences in dissolution behaviour arise principally from differences in particle size, size distribution and surface characteristics among the nine formulations.
From a formulation-design perspective, these results reinforce the importance of systematically screening stabiliser type and concentration when developing a nanoprecipitation-based nanosuspension, since the choice of polymer materially influenced not only the physical characteristics of the resulting particles but also their functional in-vitro release performance. The present study is, however, limited to in-vitro characterisation; no in-vivo pharmacokinetic data were generated, and although the observed increase in saturation solubility and dissolution rate is mechanistically expected to translate into improved oral absorption for a dissolution-rate-limited BCS Class II drug such as Ibrutinib, this expectation would need to be confirmed by subsequent in-vivo pharmacokinetic and pharmacodynamic studies. Likewise, although the present dataset establishes the immediate physicochemical and dissolution profile of the optimised formulation, longer-term physical and chemical stability under defined storage conditions was not evaluated in the present dataset and represents an important area for future work.
CONCLUSION
Ibrutinib nanosuspensions were successfully prepared by the nanoprecipitation technique using Carbopol, Ethyl Cellulose and Sodium CMC as stabilising polymers, in combination with PVP K-30 and sodium lauryl sulfate. All nine formulations yielded particles in the sub-micron (nanometre) range (260.4–453.2 nm), with satisfactory drug content and entrapment efficiency. Formulation F3 (Ibrutinib:Carbopol, 140:200 mg) was identified as the optimised batch on the basis of its favourable particle size (341.8 nm), the narrowest polydispersity index (0.43), the highest-magnitude zeta potential (−34.44 mV), the highest drug content (99.63%), entrapment efficiency (98.90%) and percentage yield (94.25%), and the greatest saturation solubility (0.892 mg/mL) and cumulative in-vitro drug release (98.98% at 60 minutes) among the formulations studied. FTIR and DSC studies confirmed the absence of significant drug–excipient interaction, and SEM confirmed the formation of discrete, spherical, nanometric particles. These findings indicate that nanoprecipitation using Carbopol as stabiliser is an effective and technically straightforward strategy for enhancing the dissolution characteristics of Ibrutinib, a poorly water-soluble BCS Class II anticancer agent. However, the improvement in oral bioavailability, therapeutic efficacy and patient compliance implied by these in-vitro results cannot be established from dissolution data alone and will require confirmation through further in-vivo pharmacokinetic and pharmacodynamic evaluation, together with formal stability studies, as the logical next steps in the development of this formulation.
ACKNOWLEDGEMENT
The author gratefully acknowledges the Department of Pharmaceutics, Sri Venkateswaraa College of Pharmacy (SVVCOP), Dharmapuri, for providing the laboratory facilities and instrumentation required to carry out this work. The author also thanks SURA LABS, Dilsukhnagar, Hyderabad, for providing the gift sample of Ibrutinib used in this study.
CONFLICT OF INTEREST
The author declares no conflict of interest associated with this work.
REFERENCES



Abirami P, Revanth Kumar.M.G, A.Vasanthan, S. Jeevanandham, Formulation, Physicochemical Characterization, and In-Vitro Dissolution Enhancement of Ibrutinib Nanosuspension Prepared by the Nanoprecipitation Technique, Int. J. of Pharm. Sci., 2026, Vol 4, Issue 10, 453-471, https://doi.org/10.5281/zenodo.23160432
 10.5281/zenodo.23160432