

We use cookies to ensure our website works properly and to personalise your experience. Cookies policy
Annasaheb Dange College of B Pharmacy, Ashta, Sangli, Walwa. 416301
This study aimed to develop and evaluate a herbal nanoemulgel containing curcumin and berberine hydrochloride for the topical management of psoriasis, a chronic autoimmune skin disorder characterized by inflammation and excessive keratinocyte proliferation. A nanoemulsion was prepared using oleic acid as the oil phase, Tween 80 as the surfactant, and PEG 400 as the co-surfactant, and was incorporated into a gel base to obtain the nanoemulgel. A 3² factorial design was used to optimize the surfactant and co-surfactant concentrations. The formulations were evaluated for particle size, zeta potential, FTIR compatibility, and physicochemical properties. The optimized formulation (R4) exhibited a particle size of 85.2 nm and a zeta potential of ?39.4 mV, indicating excellent stability. It also showed a suitable pH (5.7), good spreadability, and pseudoplastic rheological behavior, making it appropriate for topical application. Molecular docking studies demonstrated strong binding affinities of curcumin and berberine toward psoriasis-related targets, supporting their therapeutic potential. Overall, the developed herbal nanoemulgel demonstrated enhanced stability, favorable topical characteristics, and improved potential for skin delivery, suggesting its promise as an effective topical drug delivery system for psoriasis treatment.
Introduction to Psoriasis [1]
Psoriasis is a chronic autoimmune skin disorder characterized by excessive keratinocyte proliferation, erythematous scaly plaques, and persistent inflammation. The condition is frequently associated with metabolic syndrome, including hypertension, hypercholesterolemia, diabetes-related complications, and obesity, which collectively increase the risk of atherosclerosis and cardiovascular mortality in affected patients. Psoriasis may also be exacerbated by factors such as infections, skin injury, irritation caused by cuts, burns, rashes, or insect bites, and the presence of other autoimmune disorders, including rheumatoid arthritis. Clinically, psoriasis presents with diverse manifestations, commonly appearing as localized or widespread scaly erythematous plaques. Based on clinical characteristics, the disease is classified into vulgaris, arthropathic, pustular, and erythrodermic types. Psoriatic lesions are distinguished from other dermatological conditions by the presence of red plaques covered with silvery-white multilayered scales and a markedly thickened acanthotic epidermis. Patients frequently experience symptoms such as itching, pain, and bleeding.
Symptoms of Psoriasis
Pathophysiology of Psoriasis
The pathophysiology of psoriasis involves complex immune dysregulation mediated primarily by T lymphocytes, particularly T-helper 17 (Th17) and T-helper 1 (Th1) cells. These immune cells release pro-inflammatory cytokines, including interleukin-17 (IL-17), tumor necrosis factor-alpha (TNF-α), and interferon-gamma (IFN-γ), which stimulate keratinocytes to produce chemokines and adhesion molecules. This process promotes the recruitment of inflammatory cells, such as neutrophils and dendritic cells, into the skin, leading to chronic inflammation and plaque formation. Psoriatic plaques are characterized by thickened, erythematous, and scaly skin lesions. In addition to immune dysfunction, impairment of the skin barrier contributes significantly to disease progression by facilitating antigen penetration and enhancing inflammatory responses. Furthermore, dysregulation of epidermal differentiation and proliferation pathways results in abnormal keratinocyte differentiation and hyperkeratosis, which further contribute to plaque development. The disease is primarily associated with T-cell-mediated immune responses that induce excessive keratinocyte proliferation and inflammation.[2] Cytokines such as TNF-α, IL-17, and IL-23 play a critical role in the initiation and progression of psoriasis.[3]
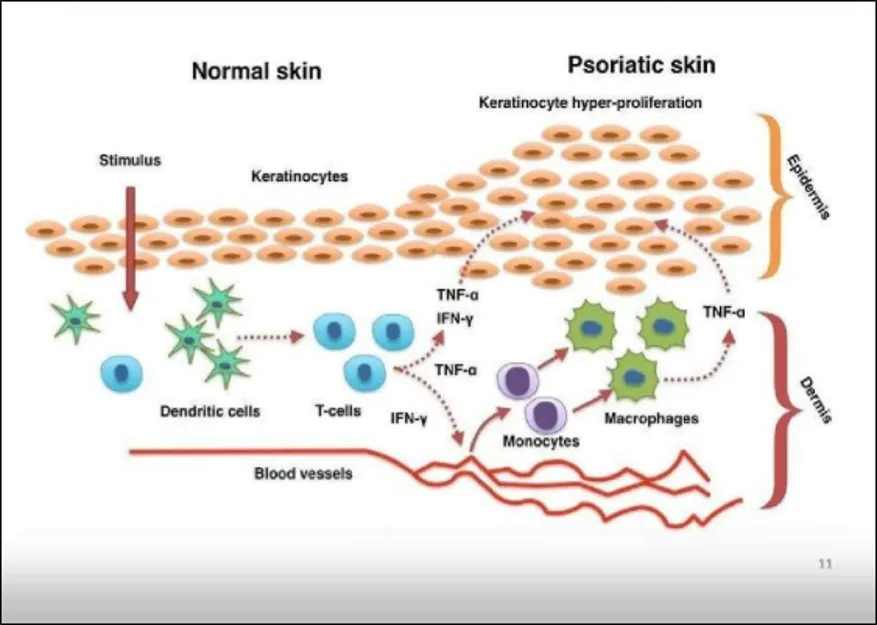
Fig 1.1: Pathophysiology of psoriasis
There has been a global transition from synthetic medications toward herbal and natural therapies, reflecting renewed interest in traditional medicinal systems. Herbal drugs contain bioactive phytochemical constituents that often exhibit synergistic effects, thereby enhancing therapeutic efficacy and overall treatment outcomes. The effectiveness of herbal therapies depends on the development of standardized formulations with consistent quality and well-defined constituents. Pharmacologically active phytochemicals present in herbal products play a significant role in disease management. Herbal medicines have gained considerable attention due to their ability to treat various disorders with minimal adverse effects. Since ancient times, herbal remedies have been extensively utilized worldwide for their therapeutic potential and comparatively lower toxicity than conventional synthetic drugs. However, limited scientific validation and formulation challenges restricted the development of advanced herbal formulations for an extended period.[4]
Nanoemulsion in Topical Application
Nanoemulsions are colloidal dispersions with droplet sizes generally ranging from 20–200 nm and are widely employed in drug delivery applications.[5] Due to their nanoscale droplet size and large surface area, nanoemulsions enhance drug permeation through the skin and improve topical drug delivery efficiency.[6] Nanoemulsions represent a promising approach for improving the delivery and targeting of poorly water-soluble drugs by increasing drug absorption, prolonging retention at the target site, and reducing systemic side effects. The advantages of nanoemulsions are primarily attributed to their nanosized globules, which significantly improve the bioavailability of therapeutic agents. Studies have demonstrated that the transdermal bioavailability of lacidipine was approximately 3.5-fold higher than that achieved through oral administration, mainly due to the avoidance of first-pass metabolism. Furthermore, nanoemulsions enhance skin permeation, thereby attracting significant interest in topical and transdermal drug delivery research. The reduced particle size allows greater drug incorporation into the formulation, resulting in an increased thermodynamic activity gradient toward the skin. Additionally, improved drug partitioning into the skin enhances permeation efficiency.[7]
Advantages of Nanoemulsion
Nanoemulgel
Nanoemulgels are advanced topical drug delivery systems extensively investigated for the treatment of various dermatological disorders, including skin infections. These systems are suitable for delivering hydrophilic and lipophilic drugs. A nanoemulgel consists of a nanoemulsion incorporated into a gel matrix, which acts as a drug reservoir, facilitating controlled drug release, enhanced absorption, and improved skin penetration.[9] Incorporation of nanoemulsion into a gel base improves the rheological properties, spreadability, and stability of the formulation while reducing surface tension. Upon application to the skin, the gel releases oil droplets containing the drug, which penetrate the stratum corneum and deliver the therapeutic agent to the target site. Nanoemulgels exhibit excellent adhesion properties, and the high solubilization capacity of the oil phase creates a greater concentration gradient across the skin, thereby enhancing drug permeation. In addition, nanoemulgels improve patient compliance because of their superior spreadability and lower greasiness compared to conventional creams and ointments.[10]
Advantages of Nanoemulgel
2. AIM AND OBJECTIVE
Aim
To develop and evaluate a nanoemulgel formulation containing curcumin and berberine hydrochloride for effective topical treatment of Psoriasis, with improved drug penetration, stability, and therapeutic efficacy.
Objectives
The binding affinities of curcumin and berberine were investigated using in silico molecular modeling and docking approaches. All docking simulations were performed using Biovia Discovery Studio, PyRx software, and ChemDraw. Molecular docking studies were conducted using [software, e.g., AutoDock Vina or Schrödinger Glide] to evaluate the binding interactions and affinities of curcumin and berberine against protein targets with PDB IDs 5ZTN (human DYRK2 kinase, resolution 2.2 Å) and 1GFK (fungal enzyme target). Protein structures were prepared by removing water molecules, adding hydrogen atoms, and performing energy minimization, while ligand structures were geometrically optimized prior to docking. Grid boxes were defined around the active sites, specifically the ATP-binding pocket for 5ZTN and the catalytic domain for 1GFK. Docking parameters, including binding energies (ΔG, kcal/mol), binding conformations, and molecular interactions such as hydrogen bonding and hydrophobic interactions, were analyzed and validated by comparison with known inhibitors.[12]
Table n 3.1: Molecular docking studies of curcumin and berberine HCl
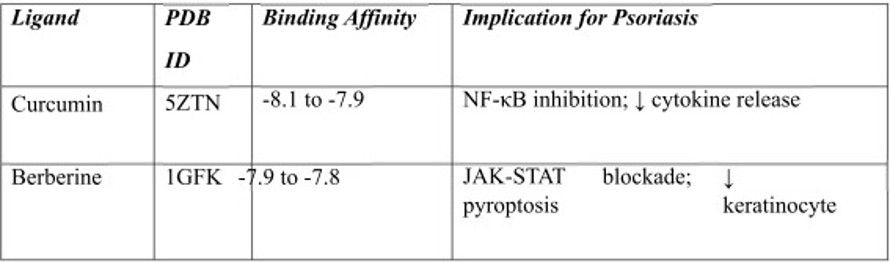
Molecular docking studies confirmed the potential of curcumin and berberine HCl as anti-psoriatic agents through their interactions with key inflammatory proteins. Curcumin showed strong binding affinity toward PDB ID 5ZTN (−8.1 to −7.9 kcal/mol), while berberine exhibited significant affinity for PDB ID 1GFK (−7.9 to −7.8 kcal/mol), suggesting possible inhibition of NF-κB and JAK-STAT signaling pathways involved in psoriasis. Curcumin may suppress pro-inflammatory signaling associated with keratinocyte hyperproliferation, whereas berberine may inhibit cytokine-mediated responses involving IL-17, IL-23, and Th17 pathways. The observed binding energies (ΔG < −7.8 kcal/mol) indicate stable ligand–protein interactions mediated by hydrogen bonding and hydrophobic interactions.
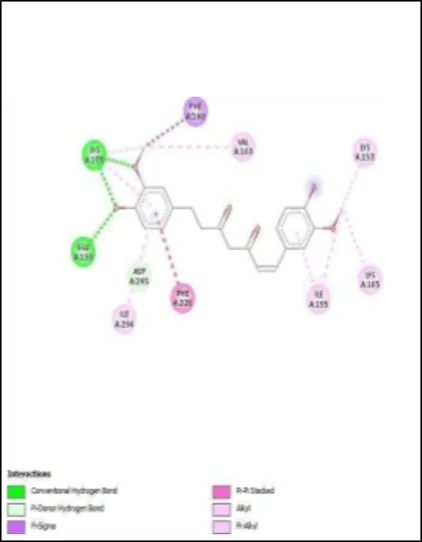
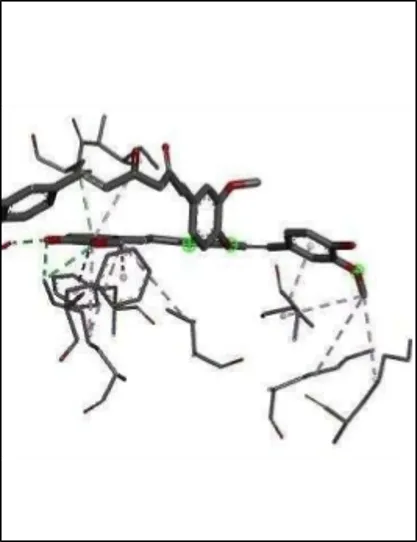
Fig 3.1 :- Docking interactions of Curcumin (A) 2D interactions; and (B) 3D interactions
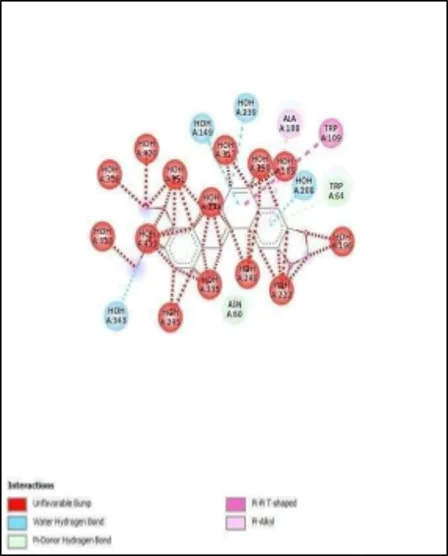
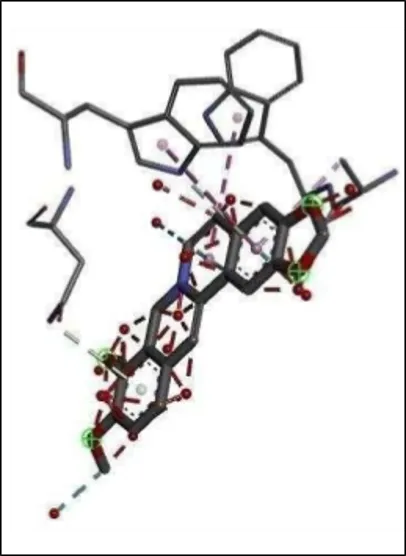
Fig 3.2 :- Docking interactions of Berberine (A) 2D interactions; and (B) 3D interactions
a. Drug Profile
i. Turmeric
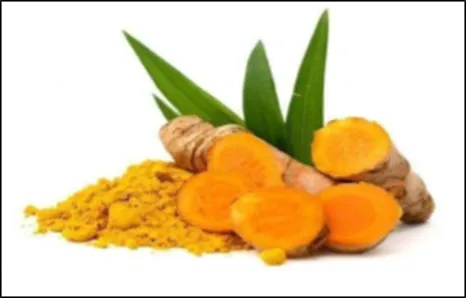
Fig 3.3: Turmeric
1. Common Name: Turmeric
2. Botanical Name: Curcuma longa
3. Family: Zingiberaceae
4. Active constituents: Curcuminoids, curcumin, turmerones, volatile oils
ii. Mahonia aquifolium
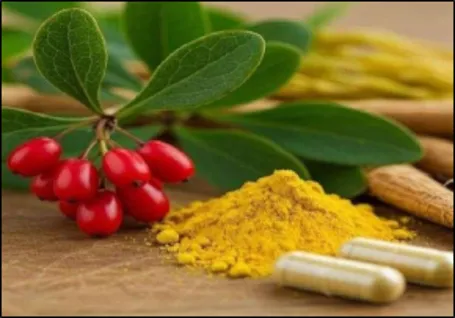
Fig 3.4: Berberine
1. Common Name: Mahonia aquifolium
2. Botanical Name: Oregon grape
3. Family: Berberidaceae
4. Active constituents : Berberine
4. PREFORMULATION STUDIES
1. Organoleptic Properties
The organoleptic characteristics, including colour and physical appearance of curcumin and berberine hydrochloride, were evaluated visually according to the standards specified in the British Pharmacopoeia.
2. Melting Point Determination
The melting points of curcumin and berberine hydrochloride were determined using the capillary tube method. A small quantity of the finely powdered sample was filled into a sealed capillary tube, attached to a thermometer, and placed in a melting point apparatus. The temperature was gradually increased, and the temperature range at which the sample began to melt and completely liquefied was recorded as the melting point.
3. Solubility Study
The solubility of curcumin and berberine hydrochloride was evaluated in Tween 80, PEG 400, oleic acid, and water. A small quantity of each drug was added separately to the respective solvents in test tubes, followed by thorough shaking and mild heating when necessary. Solubility was assessed visually based on the extent of dissolution.
4. Determination of Calibration Curve of Berberine Hydrochloride and Curcumin
Standard stock solutions of curcumin and berberine hydrochloride were prepared by accurately weighing and dissolving known quantities of each drug in suitable solvents to obtain specific concentrations. Serial dilutions were then prepared within the desired analytical range. The calibration curves were constructed by measuring the absorbance of the prepared solutions.
5. Compatibility Study
Compatibility studies of curcumin and berberine hydrochloride were carried out using Fourier Transform Infrared (FTIR) spectroscopy. The infrared spectra of the pure drugs and their physical mixtures with formulation excipients were recorded separately. The physical mixtures contained all formulation ingredients, and FTIR analysis was performed individually for each drug as well as for the combined drug formulation to evaluate possible interactions.
5. FORMULATION DEVELOPMENT
Selection of Excipients
Tween 80 was selected as the primary surfactant due to its non-ionic nature, high solubilization capacity, and suitability for stabilizing oil-in-water (O/W) nanoemulsions, attributed to its hydrophilic-lipophilic balance (HLB ~15). It effectively stabilizes the oil–water interface and contributes to the formation of stable nanoemulsion systems. PEG 400 was used as a co-surfactant to enhance surfactant efficiency, reduce interfacial tension, and expand the nanoemulsion region in phase diagrams, particularly at Smix ratios such as 1:1 and 2:1. Additionally, PEG 400 improves drug solubility and interfacial fluidity. Oleic acid was selected as the oil phase because of its excellent drug solubilization capacity and penetration- enhancing properties associated with its fatty acid structure.[13]
Tween 80 and PEG 400 have been widely employed in pharmaceutical nanoemulsion formulations due to their ability to produce stable droplets and improve formulation stability. Studies have reported that optimized combinations, such as 36% Tween 80 and 18.6% PEG 400, contribute to robust nanoemulsion systems. Oleic acid also provides ultra-low interfacial tension when combined with surfactants and co-surfactants, enabling efficient oil incorporation and enhanced drug delivery performance.[14]
Design of Experiment
Formulation Optimization Using 3² Full Factorial Design
A 3² full factorial design was employed for the optimization of the berberine nanoemulgel formulation. In this experimental design, two independent variables were evaluated at three levels: low (−1), medium (0), and high (+1), resulting in a total of nine experimental formulations (3² = 9). The factorial design facilitates the evaluation of both the individual and interaction effects of formulation variables on the selected responses. The independent variables selected were the concentration of the oil phase (X₁) and the concentration of the surfactant/co-surfactant mixture (X₂), as these factors significantly influence the physicochemical characteristics of the nanoemulsion system. The dependent variables studied included particle size, entrapment efficiency, and drug release. Particle size is a critical parameter affecting formulation stability and skin permeation, while entrapment efficiency reflects the drug-retaining capacity of the formulation. Drug release behavior is directly associated with therapeutic performance. The factorial design approach enabled systematic optimization of the formulation by establishing mathematical relationships between formulation variables and response parameters. Furthermore, it facilitated the identification of an optimized formulation with desirable physicochemical and drug delivery characteristic
Table no 5.1: Formulation Optimization 3 full Factorial Design
|
Run |
Tween 80 |
PEG 400 |
Oleic acid |
Water |
|
R1 |
3.2 |
0.8 |
2 |
Qs |
|
R2 |
2.4 |
0.8 |
2 |
Qs |
|
R3 |
1.6 |
1.2 |
2 |
Qs |
|
R4 |
1.6 |
0.8 |
2 |
Qs |
|
R5 |
2.4 |
1.6 |
2 |
Qs |
|
R6 |
3.2 |
1.6 |
2 |
Qs |
|
R7 |
2.4 |
1.2 |
2 |
Qs |
|
R8 |
3.2 |
1.2 |
2 |
Qs |
|
R9 |
1.6 |
1.6 |
2 |
Qs |
The combined image represents all nine batches of nanoemulsion formulations prepared using above 3² factorial design, illustrating the visual appearance, homogeneity, and comparative characteristics of each batch under identical experimental conditions.
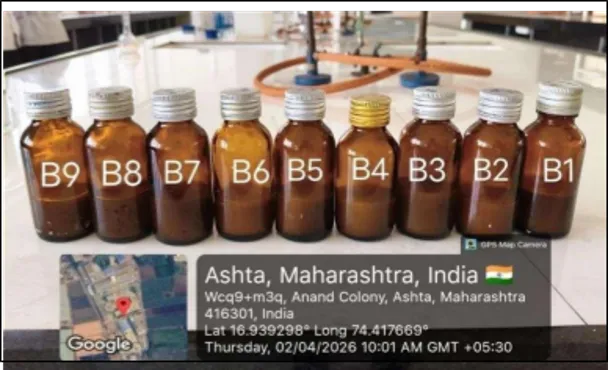
Fig 5.1: Nanoemulsion Batches
Preparation of Nanoemulsion
Pre-Emulsion Preparation
Magnetic stirring was employed as a low-energy technique for the preparation of a stable pre-emulsion by uniformly dispersing the oil phase (oleic acid), surfactant (Tween 80), co-surfactant (PEG 400), and aqueous phase prior to high-shear homogenization. This preliminary mixing step produced a coarse emulsion containing macro-sized droplets (1–10 µm), thereby ensuring phase compatibility and minimizing phase separation during subsequent Ultra Turrax homogenization.[15] Initially, Tween 80 and PEG 400 were dissolved in oleic acid to prepare the organic phase. Subsequently, water was added dropwise at a controlled rate (approximately 2 mL/min) into the mixture under continuous magnetic stirring at 400–1000 rpm for 10–30 min at a controlled temperature range of 25–70°C. This process resulted in the formation of a milky coarse emulsion containing macro-droplets. Continuous stirring using a Teflon-coated magnetic stir bar maintained system equilibrium, prevented creaming and phase separation, and promoted interfacial stabilization, consistent with spontaneous emulsification techniques used for homogeneous nanoemulsion preparation.[16]
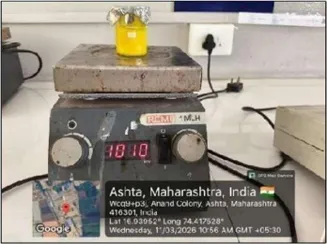
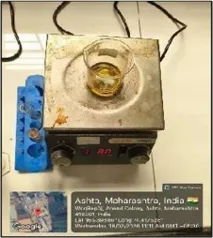
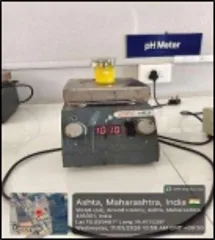
Fig 5.2: Magnetic Stirring of Nanoemulsion
High-Pressure Homogenization
High-shear homogenization using an Ultra Turrax was employed as a high-energy technique for the preparation of nanoemulsions. This method applies intense mechanical shear through rotor–stator disruption to reduce oil droplet size into the nanoscale range, typically between 20–200 nm.[17] The Ultra Turrax technique offers advantages such as simplicity, scalability, and effective control over droplet size by adjusting operational parameters including homogenization speed, processing time, and phase addition sequence. Initially, droplet sizes in the range of 100–500 nm can be achieved, which may be further refined with optimized processing conditions. Homogenization was carried out at speeds ranging from 11,000–20,000 rpm for 3–5 min, as higher speeds enhance droplet size reduction, although excessive speed may increase heat generation and viscosity. Owing to its efficiency and GRAS-compliant nature, the Ultra Turrax method is widely utilized for laboratory-scale nanoemulsion development and subsequent scale-up applications.[18]
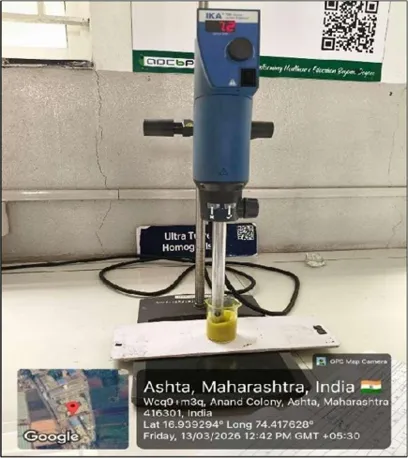
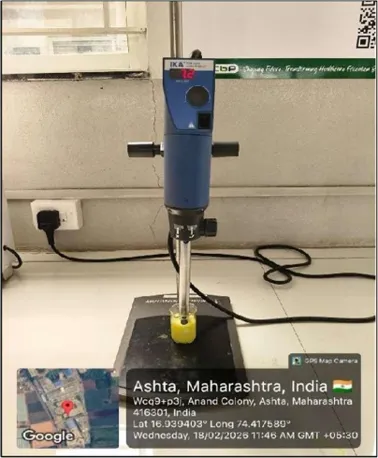
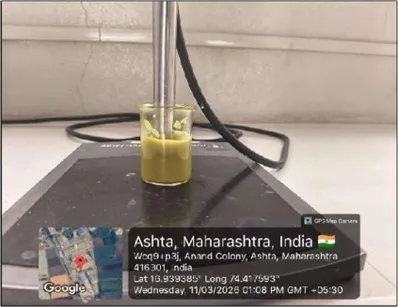
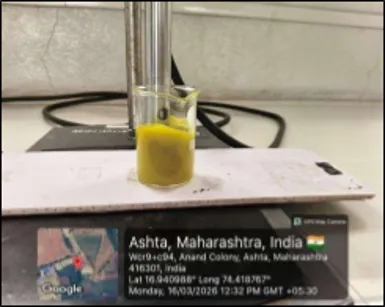
Fig 5.3: High-shear homogenization using an Ultra Turrax
Preparation of Nanoemulgel
Gel Base Formation
The gel base was prepared by dispersing Carbopol 940 in distilled water (e.g., 2 g in 80 mL) followed by magnetic stirring at 500 rpm for 24 h to ensure complete hydration and swelling, resulting in a clear dispersion. The optimized nanoemulsion was then incorporated slowly into the Carbopol dispersion under continuous stirring at 800–1000 rpm for 30–45 min to achieve uniform distribution without phase separation. The formulation temperature was maintained between 25–30°C during the process.[19]
Neutralization and Homogenization
Triethanolamine was added dropwise to the formulation until the pH reached 6.5–7.0, resulting in gel formation and an increase in viscosity due to neutralization of the Carbopol dispersion.[20]
6. RESULTS
Table no 6.1: Organoleptic Properties
|
Property |
Curcumin |
Berberine |
|
Colour |
Bright Yellow |
Bright Yellow |
|
Odour |
Slightly Characteristics |
Very Slightly Characteristics |
|
Taste |
Bitter |
Strongly bitter |
|
Appearance |
Crystalline powder |
Crystalline powder |
Table no 6.2: Solubility Study
|
Vehicle Type |
Vehicle Name |
Curcumin Solubility |
Berberine Solubility |
|
Oil |
Oleic Acid |
High |
Low |
|
Surfactant |
Tween80 |
High |
Moderate |
|
CO-Surfactant |
PEG400 |
High |
High |
|
Aqueous |
Dis. Water |
Very Low |
High |
Melting point of Curcumin and Berberine was determined and it found to be :
Table no 6.3: Melting Point
|
Sr.no |
Drug |
Melting point |
|
1 |
Curcumin |
183o C |
|
2 |
Berberine |
190oC |
Table no 6.4: Concentration and absorbance of curcumin and berberine
|
Concentration |
Absorbance |
Concentration |
Absorbance |
|
5 |
0.658 |
5 |
0.479 |
|
10 |
0.817 |
10 |
0.510 |
|
15 |
1.091 |
15 |
0.539 |
|
20 |
1.496 |
20 |
0.589 |
|
25 |
1.859 |
25 |
0.616 |
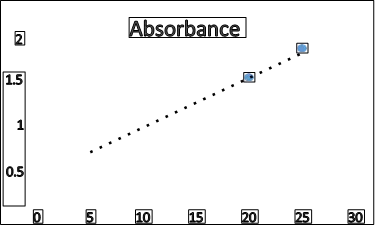
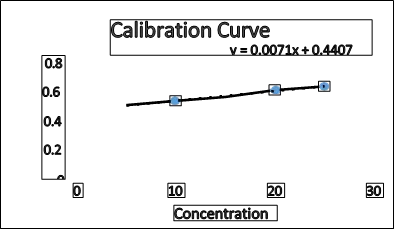
The calibration curve of berberine hydrochloride exhibited a linear relationship between concentration and absorbance, indicating compliance with Beer–Lambert’s law within the selected concentration range. The linear regression plot showed a strong correlation coefficient (R² close to 1), confirming the accuracy, precision, and reliability of the UV spectrophotometric method. Therefore, the developed calibration curve can be effectively utilized for the quantitative estimation of berberine hydrochloride in pharmaceutical formulations.
The successful development of a stable formulation depends on the appropriate selection of excipients that facilitate drug release while protecting the active pharmaceutical ingredient from degradation. Since drug and polymer components remain in close contact within the formulation, potential interactions may lead to instability of the drug. Therefore, preformulation studies evaluating drug–polymer compatibility are essential for the selection of suitable excipients. Fourier Transform Infrared (FT-IR) spectroscopy was employed to assess the compatibility between curcumin, berberine hydrochloride, and the selected polymers.[20]
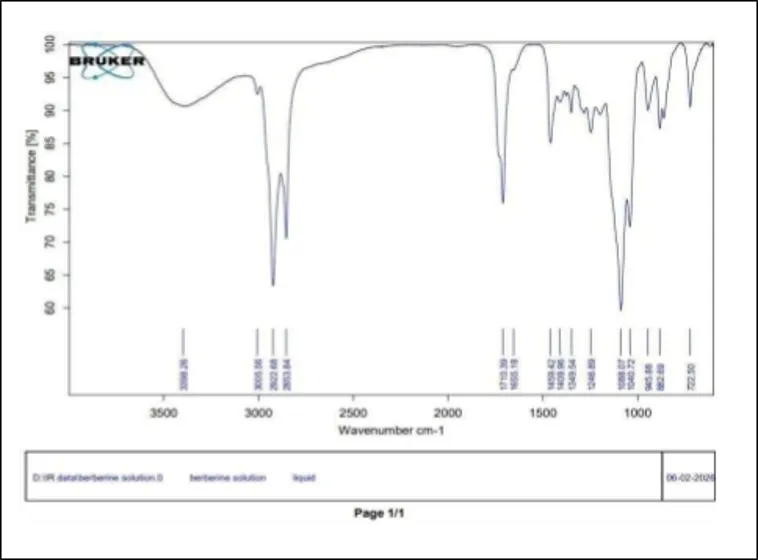
Fig 6.1:- FTIR Spectrum of Physical Mixture (Berberine)
The FTIR spectrum of oleic acid exhibited characteristic peaks corresponding to C=O stretching at 1740 cm⁻¹, C=C stretching around 1655 cm⁻¹, and long-chain hydrocarbon vibrations near 722 cm⁻¹. Berberine hydrochloride showed characteristic aromatic peaks in the regions of 1655 cm⁻¹ and 950–800 cm⁻¹, along with C–N stretching vibrations. The FTIR spectrum of the prepared formulation containing berberine hydrochloride, Tween 80, PEG 400, and oleic acid was analyzed to evaluate the presence of functional groups and assess the compatibility among formulation components. The obtained spectrum confirmed the retention of characteristic peaks of all individual components. No significant peak shifts, disappearance, or formation of new peaks were observed, indicating the absence of chemical interactions and demonstrating good compatibility between berberine hydrochloride and the selected excipients.
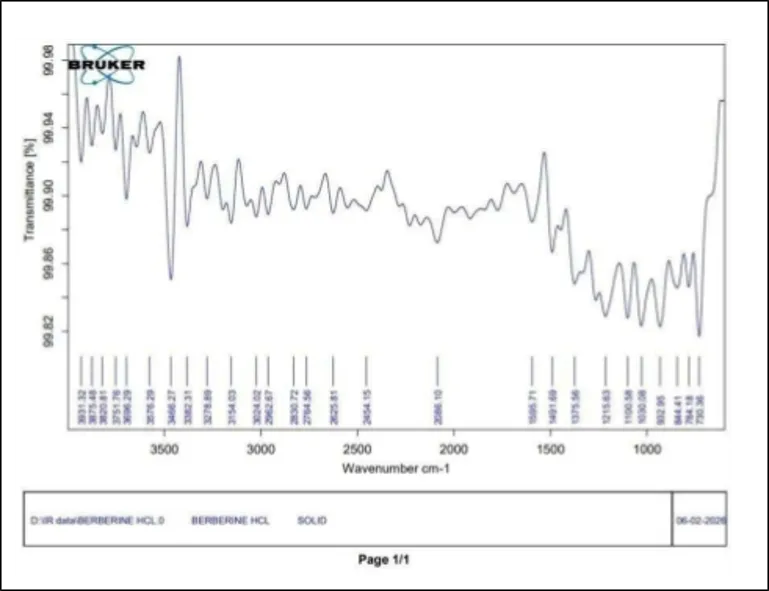
Fig 6.2 :- FTIR Spectrum of Pure Berberine
The FTIR spectrum of berberine hydrochloride exhibited a broad absorption peak at approximately 3466 cm⁻¹, corresponding to O–H/N–H stretching vibrations. Peaks observed in the range of 3154–3026 cm⁻¹ confirmed aromatic C–H stretching, while bands at 2926–2830 cm⁻¹ were attributed to aliphatic C–H stretching associated with methoxy groups. A prominent peak at 1595 cm⁻¹ indicated aromatic C=C stretching vibrations, whereas the peak at 1491 cm⁻¹ corresponded to aromatic ring vibrations. Peaks observed at 1375 cm⁻¹ were assigned to C–N stretching, and bands in the range of 1215–1030 cm⁻¹ .
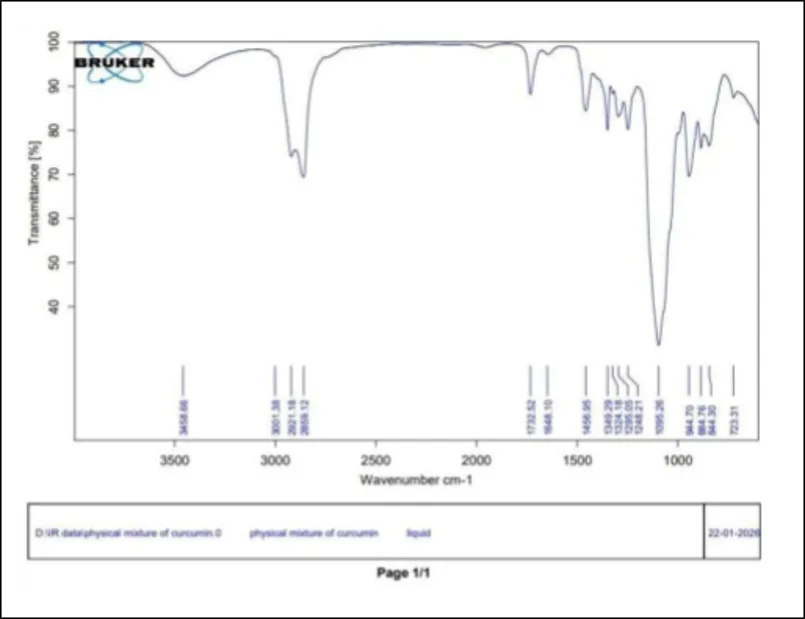
Fig 6.3 :- FTIR Spectrum of Physical Mixture (Curcumin)
The FTIR spectrum exhibited a broad absorption peak at 3458 cm⁻¹, corresponding to –OH stretching vibrations contributed by curcumin and PEG 400, indicating the presence of hydrogen bonding interactions. Peaks observed at 2921 cm⁻¹ and 2859 cm⁻¹ were attributed to aliphatic C–H stretching vibrations, confirming the presence of long hydrocarbon chains derived from Tween 80 and oleic acid.
A prominent peak at 1732 cm⁻¹ corresponded to ester carbonyl (C=O) stretching, characteristic of Tween 80 and oleic acid, thereby confirming their incorporation into the formulation. The peak at 1648 cm⁻¹ was assigned to C=C stretching vibrations, indicating retention of the aromatic and conjugated structure of curcumin. Furthermore, peaks within the range of 1349–1244 cm⁻¹ along with the peak at 1095 cm⁻¹ were associated with C–O and C–O–C stretching vibrations, confirming the presence of ether linkages from PEG 400 and the surfactant structure of Tween 80. The fingerprint region below 1000 cm⁻¹ displayed multiple peaks attributed to alkene bending vibrations, primarily associated with oleic acid.
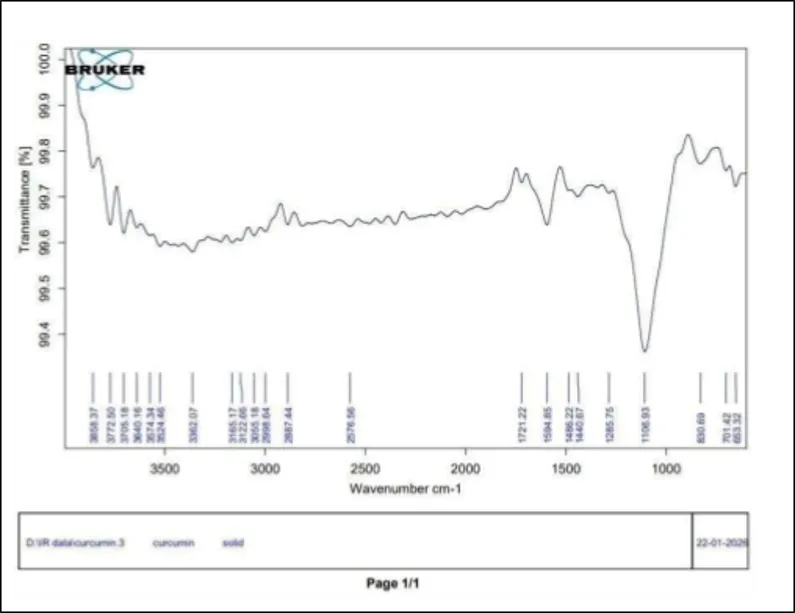
Fig 6.4 :- FTIR Spectrum of Pure Curcumin
The FTIR spectrum exhibited a broad absorption peak around 3400 cm⁻¹, corresponding to phenolic – OH stretching vibrations, which are associated with the antioxidant activity of curcumin. Peaks observed in the range of 2920–2850 cm⁻¹ were attributed to aliphatic C–H stretching vibrations, confirming the presence of hydrocarbon chains. A prominent peak near 1620 cm⁻¹ represented conjugated carbonyl (C=O) stretching, characteristic of the diketone structure of curcumin.
Additionally, the spectral region between 1600–1500 cm⁻¹ indicated aromatic C=C stretching vibrations, confirming the presence of benzene rings. Peaks in the range of 1270–1020 cm⁻¹ were assigned to C–O and ether (C–O–C) stretching vibrations associated with methoxy groups (–OCH₃).
Furthermore, a sharp peak near 960 cm⁻¹ corresponded to trans –CH=CH bending vibrations, confirming the presence of the conjugated double-bond structure of curcumin.
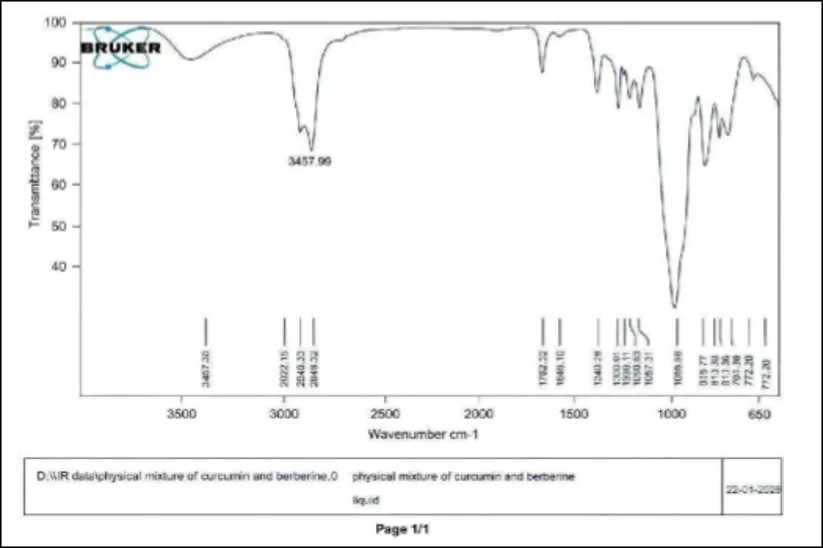
Fig 6.5 :- FTIR Spectrum of Physical mixture of Curcumin and Berberine
The FTIR spectrum of the physical mixture containing curcumin, berberine, Tween 80, PEG 400, and oleic acid exhibited characteristic peaks corresponding to the functional groups of both the drugs and excipients. A broad peak around 3450 cm⁻¹ was attributed to hydroxyl (–OH) stretching vibrations from curcumin and PEG 400, indicating possible hydrogen bonding interactions. Peaks observed at approximately 2920 cm⁻¹ and 2850 cm⁻¹ corresponded to aliphatic C–H stretching vibrations, confirming the presence of long hydrocarbon chains derived from Tween 80 and oleic acid. A prominent absorption peak in the range of 1730–1760 cm⁻¹ represented ester carbonyl (C=O) stretching vibrations characteristic of Tween 80 and oleic acid. The peak near 1645 cm⁻¹ was assigned to aromatic C=C stretching vibrations of curcumin along with C=N or conjugated system vibrations of berberine, confirming the presence of both drugs within the formulation. Furthermore, peaks in the range of 1240–1050 cm⁻¹ were attributed to C–O and C–O–C stretching vibrations associated with PEG 400 and surfactant structures. The fingerprint region below 1000 cm⁻¹ displayed multiple peaks corresponding to aromatic and alkene bending vibrations.
No significant peak shift, disappearance, or formation of new peaks was observed in the spectrum, indicating the absence of chemical interactions between the drugs and excipients. Therefore, the FTIR study confirmed the compatibility of curcumin and berberine with the selected formulation components, supporting their suitability for the development of nanoemulsion and nanoemulgel systems.
Summary of Design of Experiment
Table no 6.5: Summary of Design of Experiment
|
Run |
Tween 80 |
PEG 400 |
Oleic acid |
Water |
Particle Size (nm) |
Zeta (mv) |
|
R1 |
3.2 |
0.8 |
2 |
Qs |
106.8 |
-18.4 |
|
R2 |
2.4 |
0.8 |
2 |
Qs |
67.5 |
-23.4 |
|
R3 |
1.6 |
1.2 |
2 |
Qs |
88.9 |
-39.7 |
|
R4 |
1.6 |
0.8 |
2 |
Qs |
85.2 |
-39.4 |
|
R5 |
2.4 |
1.6 |
2 |
Qs |
118.9 |
-38.2 |
|
R6 |
3.2 |
1.6 |
2 |
Qs |
139.5 |
-35.5 |
|
R7 |
2.4 |
1.2 |
2 |
Qs |
93.3 |
-36.3 |
|
R8 |
3.2 |
1.2 |
2 |
Qs |
117.3 |
-27 |
|
R9 |
1.6 |
1.6 |
2 |
Qs |
127.2 |
-40.4 |
All formulations exhibited particle sizes within the nanometric range (67.5–139.5 nm), confirming the successful formation of nanoemulsions. Among the formulations, R2 demonstrated the smallest particle size (67.5 nm), indicating an optimal concentration of surfactant and co-surfactant for efficient emulsification. However, a further increase in the concentrations of Tween 80 and PEG 400 resulted in an increase in particle size. The zeta potential values ranged from −18.4 to −40.4 mV, indicating good formulation stability, primarily attributed to the presence of oleic acid. Formulations R3, R4, and R9 exhibited comparatively higher negative zeta potential values, suggesting enhanced physical stability. Overall, formulation R2 was identified as optimal with respect to minimum particle size, whereas formulations R3 and R4 demonstrated a more favorable balance between particle size and stability.
Fit Summary
Response 1: Particle size
Table no 6.6: Response 1: Particle size
|
Source |
Sequential p-value |
Lack of Fit p-value |
Adjusted R² |
Predicted R² |
|
|
Linear |
0.0106 |
|
0.7071 |
0.4633 |
Suggested |
|
2FI |
0.7439 |
|
0.6567 |
-0.2528 |
|
|
Quadratic |
0.0813 |
|
0.8927 |
0.5774 |
|
|
Cubic |
0.5968 |
|
0.8853 |
-1.6131 |
Aliased |
ANOVA for Linear model RESPONSE
1: PARTICLE SIZE
|
Source |
Sum of Squares |
df |
Mean Square |
F-value |
p-value |
|
|
Model |
3297.08 |
2 |
1648.54 |
10.66 |
0.0106 |
significant |
|
A-Tween 80 |
646.88 |
1 |
646.88 |
4.18 |
0.0868 |
|
|
B-PEG 400 |
2650.20 |
1 |
2650.20 |
17.13 |
0.0061 |
|
|
Residual |
928.12 |
6 |
154.69 |
|
|
|
|
Cor Total |
4225.20 |
8 |
|
|
|
|
ANOVA for Linear model
Factor coding Sum of squares is
The Model F-value of 10.66 implies the model is significant. There is only a 1.06% chance that an F-value this large could occur due to noise.
P-values less than 0.0500 indicate model terms are significant. In this case B is a significant model term. Values greater than 0.1000 indicate the model terms are not significant. If there are many insignificant model terms (not counting those required to support hierarchy), model reduction may improve your model.
Final Equation in Terms of Coded Factors
246.256 + 25.9583 * A + 52.5417 * B
1) Predicted vs Actual Plot :
The predicted versus actual plot for particle size demonstrated good agreement between the experimental and model-predicted values. Most data points were closely distributed along the diagonal line, indicating that the selected model provided an acceptable fit for the experimental data. Minor deviations observed for a few points suggest slight prediction errors under certain experimental conditions. The color gradient, ranging from blue to represented variations in particle size values, where blue indicated lower particle sizes and red indicated higher values. Overall, the close distribution of data points around the reference line confirmed the satisfactory predictive capability and moderate accuracy of the developed model.
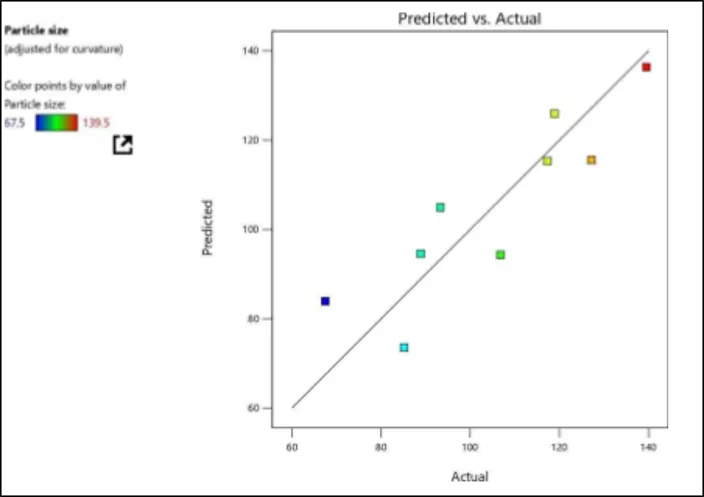
Fig 6.6: predicted vs. actual plot for particle size
2) Contour Plot:
The particle size of the formulations varied with changes in the concentrations of Tween 80 and PEG
400. At a PEG 400 concentration of 0.8 mL, particle sizes increased from 72.4 nm to 108.9 nm as the Tween 80 concentration increased from 1.6 mL to 6.4 mL. Similarly, at 1.6 mL PEG 400, particle sizes of 86.2 nm, 101.5 nm, 118.3 nm, and 132.6 nm were observed corresponding to Tween 80 concentrations of 1.6 mL, 3.2 mL, 4.8 mL, and 6.4 mL, respectively.
At a PEG 400 concentration of 2.4 mL, the particle sizes further increased to 99.8 nm, 119.7 nm,
139.5 nm, and 153.2 nm with increasing Tween 80 concentrations. Likewise, at 3.2 mL PEG 400, particle sizes of 114.6 nm, 134.1 nm, 154.8 nm, and 168.7 nm were recorded for the corresponding Tween 80 concentrations. Overall, the results indicated that increasing the concentrations of both Tween 80 and PEG 400 led to a progressive increase in particle size.
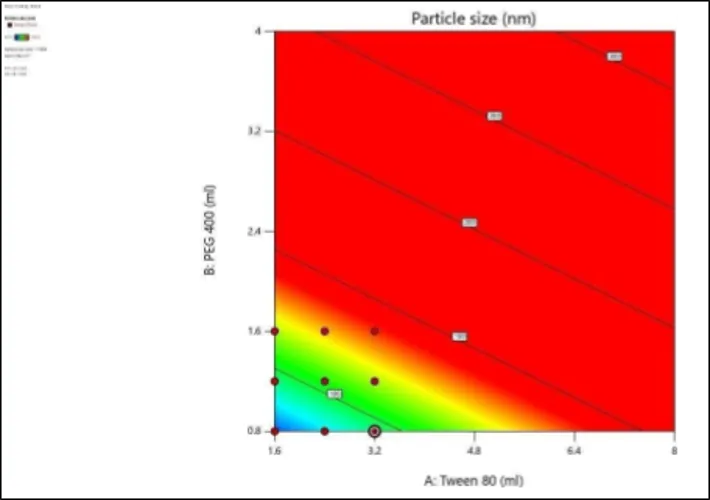
Fig 6.7: Contour Plot
3) 3D Surface Plot:
The particle size of the formulations was significantly influenced by the concentrations of Tween 80 and PEG 400. At a PEG 400 concentration of 0.8 mL, particle sizes increased from 72.4 nm to 108.9 nm as the Tween 80 concentration increased from 1.6 mL to 6.4 mL. Similarly, at 1.6 mL PEG 400, particle sizes of 86.2 nm, 101.5 nm, 118.3 nm, and 132.6 nm were obtained corresponding to Tween 80 concentrations of 1.6 mL, 3.2 mL, 4.8 mL, and 6.4 mL, respectively. Further increases in PEG 400 concentration resulted in a corresponding increase in particle size. At 2.4 mL PEG 400, particle sizes of 99.8 nm, 119.7 nm, 139.5 nm, and 153.2 nm were observed, while at 3.2 mL PEG 400, the particle sizes further increased to 114.6 nm, 134.1 nm, 154.8 nm, and 168.7 nm with increasing Tween 80 concentrations. The 3D surface plot further confirmed this trend by demonstrating a gradual increase in particle size with increasing concentrations of both Tween 80 and PEG 400. The inclined surface indicated a positive interaction between the two independent variables, where higher concentrations contributed to larger particle sizes. Additionally, the color transition from blue/green to red represented the increase in particle size values, with lower values observed at lower factor levels and higher values at elevated concentrations.
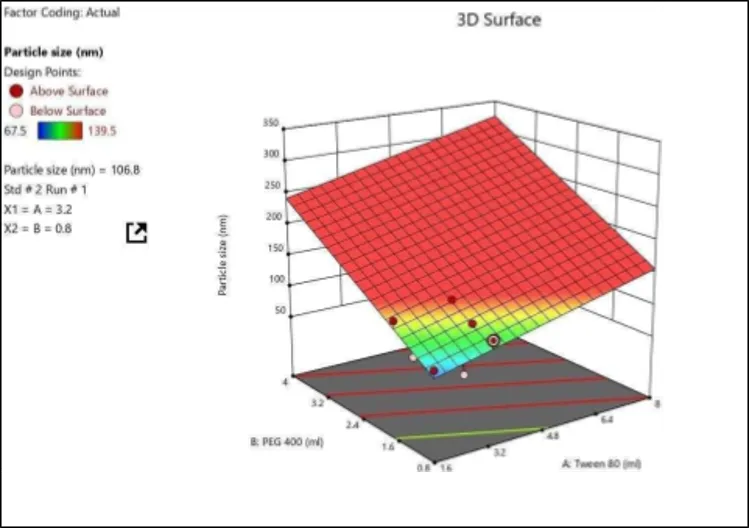
Fig 6.8: 3D Surface Plot
Fit Summary Response
2: Zeta
Table no 6.7: Response 2: Zeta
|
Source |
Sequential p-value |
Lack of Fit p-value |
Adjusted R² |
Predicted R² |
|
|
Linear |
0.0063 |
|
0.7536 |
0.4850 |
|
|
2FI |
0.0250 |
|
0.9015 |
0.8275 |
Suggested |
|
Quadratic |
0.6722 |
|
0.8740 |
0.5487 |
|
|
Cubic |
0.7455 |
|
0.7899 |
-3.7869 |
Aliased |
|
Source |
Sum of Squares |
df |
Mean Square |
F-value |
p-value |
|
|
Model |
493.53 |
3 |
164.51 |
25.39 |
0.0019 |
significant |
|
A-Tween 80 |
26.09 |
1 |
26.09 |
4.03 |
0.1011 |
|
|
B-PEG 400 |
106.47 |
1 |
106.47 |
16.44 |
0.0098 |
|
ANOVA for 2FI model
|
AB |
64.80 |
1 |
64.80 |
10.00 |
0.0250 |
|
Residual |
32.39 |
5 |
6.48 |
|
|
|
Cor Total |
525.92 |
8 |
|
|
|
Factor coding is Coded. Sum of squares is Type III - Partial
The Model F-value of 25.39 implies the model is significant. There is only a 0.19% chance that an F-value this large could occur due to noise.
P-values less than 0.0500 indicate model terms are significant. In this case B, AB are significant model terms. Values greater than 0.1000 indicate the model terms are not significant. If there are many insignificant model terms (not counting those required to support hierarchy), model reduction may improve your model.
Final Equation in Terms of Coded Factors
-110.376 + -29.1979 * A + -58.9896 * B + -25.1562 * AB
The equation in terms of coded factors can be used to make predictions about the response for given levels of each factor. By default, the high levels of the factors are coded as +1 and the low levels are coded as -1. The coded equation is useful for identifying the relative impact of the factors by comparing the factor coefficients.
1) Predicted vs Actual Plot:
The predicted versus actual plot for zeta potential demonstrated good agreement between the experimentally observed and model-predicted values. Most data points were located close to the diagonal reference line, indicating that the selected model provided an adequate fit and reliable prediction of zeta potential values. Minor deviations observed for a few data points may be attributed to experimental variability and small prediction errors.
The color gradient ranging from blue to red represented the variation in zeta potential values, where more negative values (approximately −40 mV) were indicated in blue and less negative values.
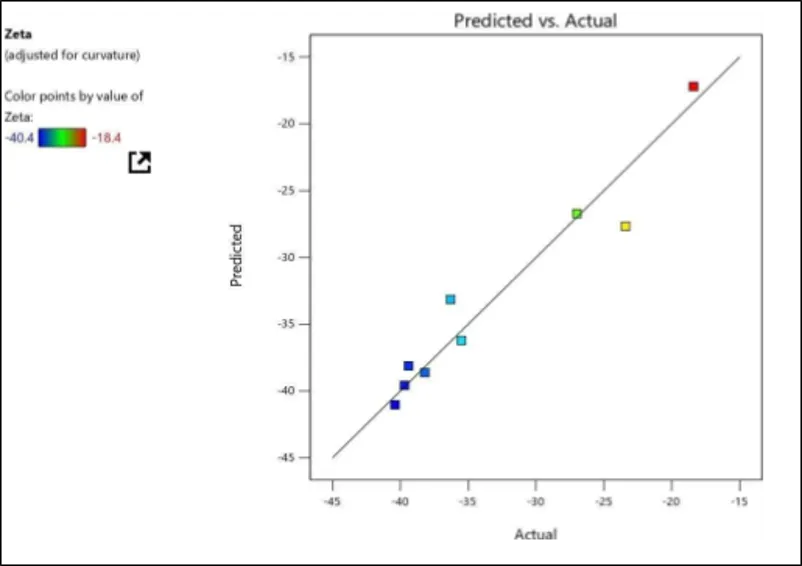
Fig 6.9: Predicted versus actual plot for zeta potential
2) Contour Plot
The contour plot indicated that zeta potential became less negative with an increase in Tween 80 concentration, particularly at lower levels of PEG 400, whereas higher concentrations of PEG 400 maintained the system in a comparatively more negative region. The most negative zeta potential region was observed in the upper and upper-left region of the contour plot, while the least negative region appeared at higher Tween 80 concentrations combined with lower PEG 400 levels.
Contour analysis demonstrated that the zeta potential values of the formulations ranged from approximately −40.4 to −18.4 mV. Under the experimental condition of Tween 80 = 3.2 mL and PEG 400 = 0.8 mL, a zeta potential value of −18.4 mV was obtained. Overall, the results indicated that increasing Tween 80 concentration shifted the zeta potential toward less negative values, whereas higher PEG 400 concentrations contributed to maintaining more negative zeta potential values.
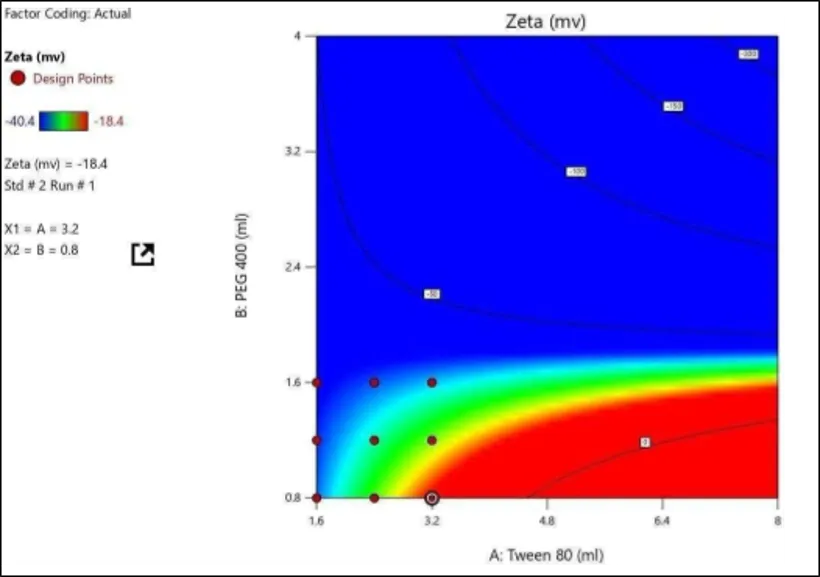
Fig 6.10: Contour plot
3) 3D Surface Plot:
The 3D surface plot illustrated the influence of Tween 80 and PEG 400 concentrations on the zeta potential of the formulation. A minimum zeta potential value of −40.4 mV was observed at higher concentrations of the co-surfactant/solvent, whereas the maximum value within the studied range was −18.4 mV. The curvature of the response surface indicated a significant interaction between the two formulation variables, suggesting that the surfactant-to-co-surfactant ratio plays a critical role in maintaining the electrical charge and stability of the nanoemulsion system. The optimization study demonstrated that higher concentrations of PEG 400 within the design space were favorable for achieving a stable formulation with zeta potential values exceeding −30 mV-30\ \mathrm{mV}−30 mV. The formulation exhibited maximum stability in the region represented by the blue zone on the 3D surface plot, which was therefore selected for further characterization and long-term stability studies.
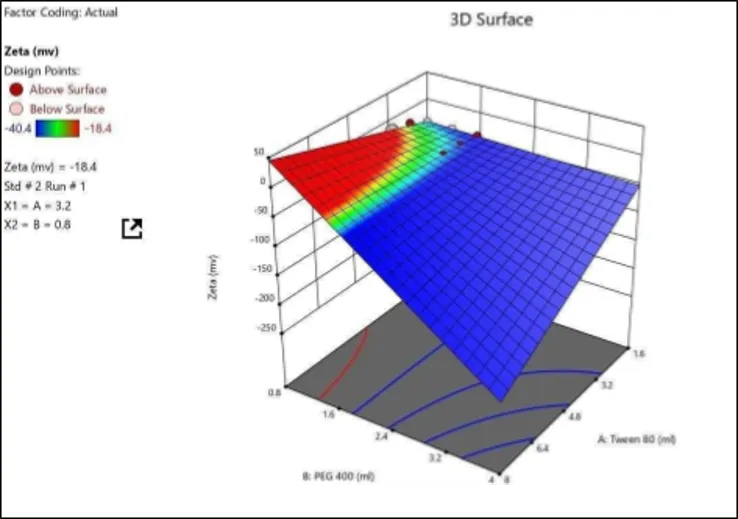
Fig 6.11: 3D surface plot demonstrates
Solutions
2 Solutions found
|
Number |
Tween 80 |
PEG 400 |
Particle size |
Zeta |
Desirability |
|
1 |
1.600 |
0.800 |
73.556 |
-38.119 |
0.906 |
|
2 |
1.600 |
0.840 |
75.657 |
-38.265 |
0.895 |
The equation in terms of coded factors can be used to make predictions about the response for given levels of each factor. By default, the high levels of the factors are coded as +1 and the low levels are coded as -1. The coded equation is useful for identifying the relative impact of the factors by comparing the factor coefficients.
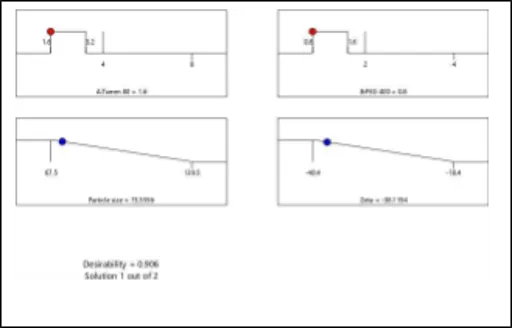
Fig 6.12: Desirability Ramp plot
Results of Particle Size and Zet
Table no 6.8: Results of Particle Size and Zeta
|
Run |
Particle Size (nm) |
Zeta (mv) |
|
R1 |
106.8 |
-18.4 |
|
R2 |
67.5 |
-23.4 |
|
R3 |
88.9 |
-39.7 |
|
R4 |
85.2 |
-39.4 |
|
R5 |
118.9 |
-38.2 |
|
R6 |
139.5 |
-35.5 |
|
R7 |
93.3 |
-36.3 |
|
R8 |
117.3 |
-27 |
|
R9 |
127.2 |
-40.4 |
Particle size Results of Optimized Batch (R4)
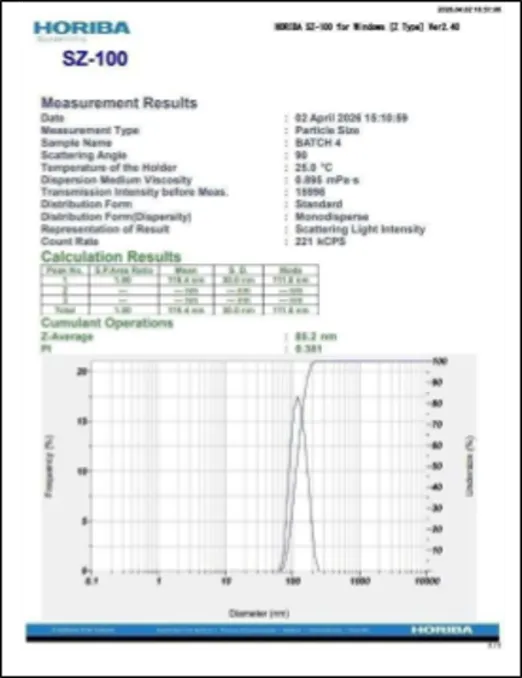
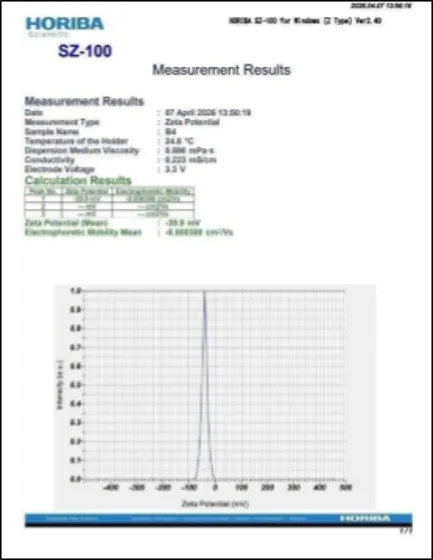
A: Particle Size of Optimized Batch (R4) B: Zeta Potential of Optimized Batch (R4)
Optimized Batch:
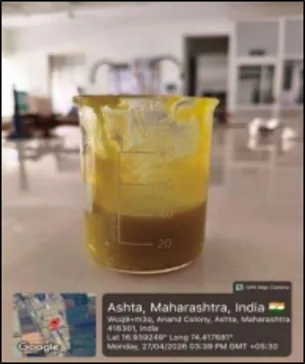
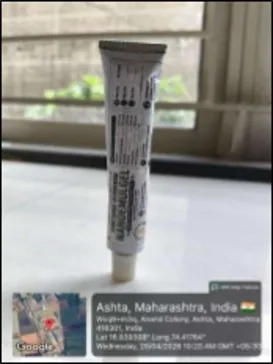
Fig 6.13: Optimized Batch of Nanoemulgel
Formulation R4 was identified as the optimized batch due to its desirable particle size (85.2 nm) and high zeta potential (−39.4 mV), indicating excellent stability of the nanoemulsion system. The optimized combination of Tween 80 and PEG 400 in this formulation provided a favorable balance between droplet size and surface charge. Therefore, formulation R4 was considered the most suitable candidate for further development of the nanoemulgel system.
Evaluation of Optimized batch (R4) of Nanoemulgel :
a) Physical Property
Table no 6.8: Physical Properties of Nanoemulgel
|
Sr. No |
Parameters Observation |
Observation |
|
1 |
Colour |
Yellow |
|
2 |
Odor |
Characteristic |
|
3 |
Texture |
Smooth |
b) pH Determination
The pH of the prepared nanoemulgel was found to be 5.7, which falls within the acceptable range for topical formulations and is compatible with the physiological pH of the skin. This indicates the suitability of the formulation for dermal application with minimal risk of skin irritation.
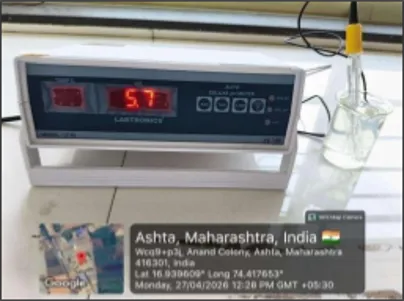
Fig 6.14: pH Determination
c) Spreadability Test:
The spreadability of the prepared nanoemulgel was determined to be 6.41 g·cm/sec, indicating satisfactory spreadability characteristics. This result suggests that the formulation can be easily applied and uniformly distributed over the skin surface, which is essential for effective topical drug delivery.
Formula= S= m × l/ t
S=100 × 6.5/60
S= 6.41 g·cm/sec
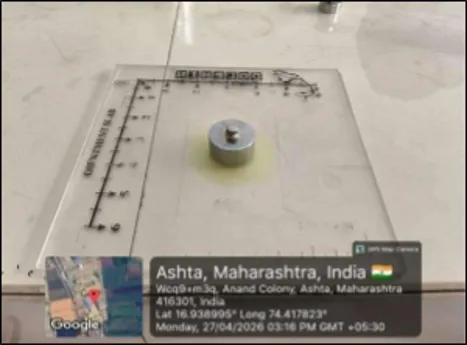
Fig 6.15: Spreadability Test
a) Rheological study:
Table no 6.9: Rheological study
|
Sr.no |
Speed (rpm) |
Viscosity (cP) |
|
1 |
10 |
46140 |
|
2 |
20 |
20850 |
|
3 |
30 |
14080 |
The viscosity of the prepared nanoemulgel was measured using a Brookfield Viscometer and found to be 46140 cP at 10 rpm, 20850 cP at 20 rpm, and 14080 cP at 30 rpm. The decrease in viscosity with increasing shear rate indicates pseudoplastic (shear-thinning) behavior, which is desirable for easy application and spreading of the gel on the skin.
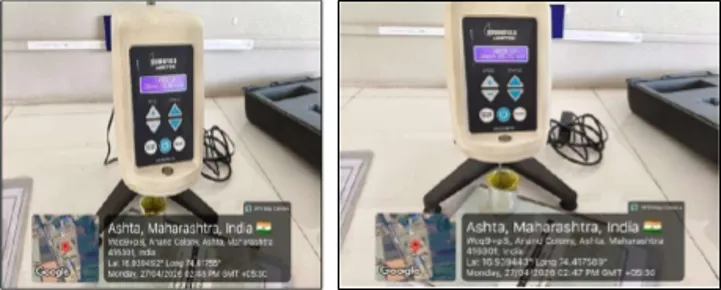
Fig 6.16: Viscosity of the prepared nanoemulgel
b) Weight of the nanoemulgel:
Weight of empty collapsible tube =3.66gm
Weight of collapsible tube with nanoemulgel = 23.61gm
Net weight of nanoemulgel= 23.61 - 3.66
= 19.93 gm
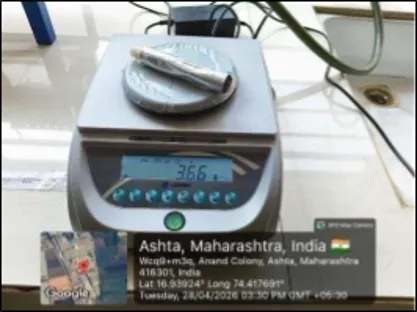
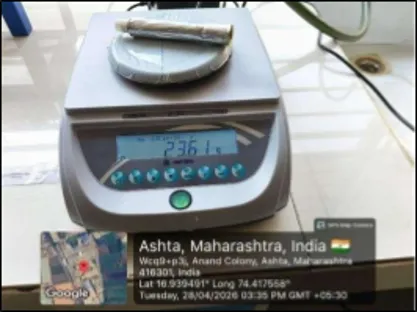
Fig 6.17: Weight of Nanoemulgel
7. CONCLUSION
The present study successfully developed and optimized a nanoemulgel formulation containing curcumin and berberine hydrochloride for the topical management of psoriasis. The incorporation of nanoemulsion technology significantly improved drug solubility, physicochemical stability, and transdermal permeation. Among the developed formulations, batch R4 was identified as the optimized formulation based on its desirable particle size and high zeta potential, indicating enhanced colloidal stability and potential therapeutic performance. The optimized formulation also exhibited suitable physicochemical characteristics, including acceptable pH, satisfactory spreadability, and pseudoplastic rheological behavior, confirming its suitability for topical application.
Fourier Transform Infrared (FTIR) spectroscopy confirmed the compatibility between the active pharmaceutical ingredients and the selected excipients, while molecular docking studies supported the potential anti-psoriatic activity of curcumin and berberine through inhibition of key pro-inflammatory signaling pathways. Overall, the developed herbal nanoemulgel represents a promising, safe, and effective topical delivery system for psoriasis management, with the added advantages of improved patient compliance and reduced adverse effects. However, further in vivo pharmacodynamic studies.
8. FUTURE PROSPECTS
1) Cell Line Studies (In-vitro Evaluation) Perform studies on human keratinocyte cell lines.
2) Scanning Electron Microscopy (SEM), Transmission Electron Microscopy (TEM).
3) In-vitro and Ex-vivo Studies.
4) In-vivo Studies (Animal Studies).
5) Drug Release Kinetics.
REFERENCES







Pranit Sabale, Samiksha Patil, Vaishnavi Mali, Srushti Gaikwad, Suraksha Shetty, Sakshi Mali, Gouri Mirje, Herbal Nanoemulgel: A Novel Herbal Topical Approach for the Management of Psoriasis, Int. J. of Pharm. Sci., 2026, Vol 4, Issue 7, 4721-4746. https://10.5281/zenodo.21508975
 10.5281/zenodo.21508975