
We use cookies to ensure our website works properly and to personalise your experience. Cookies policy
Loknete Shri Dadapatil Pharate College of Pharmacy, A/p-Mandavgan Pharata, Tal- Shirur, Dist-Pune, 412211.
Asthma is a chronic inflammatory respiratory disorder characterized by airway hyper responsiveness, bronchoconstriction, and recurrent episodes of wheezing and breathlessness. Natural phytoconstituents such as rutin and silymarin possess significant antioxidant and anti-inflammatory properties, making them promising candidates for asthma management. The present study aimed to develop and validate a simple, rapid, accurate, and precise reverse-phase high-performance liquid chromatography (RP-HPLC) method for the simultaneous estimation of rutin and silymarin in a Nano-formulation intended for asthma treatment.Chromatographic separation was achieved using a C18 column with an optimized mobile phase consisting of acetonitrile and aqueous buffer in an appropriate ratio under isocratic conditions. Detection was performed using a UV detector at the selected wavelength. The developed method was validated according to International Council for Harmonisation (ICH) guidelines with respect to specificity, linearity, accuracy, precision, robustness, limit of detection (LOD), and limit of quantification (LOQ). The calibration curves for both rutin and silymarin demonstrated excellent linearity within the selected concentration ranges, with correlation coefficients greater than 0.999. The method exhibited satisfactory accuracy and precision, with percentage recovery values within acceptable limits and relative standard deviation below 2%.A Nano-formulation containing rutin and silymarin was successfully prepared and characterized for particle size, polydispersity index, zeta potential, entrapment efficiency, and in vitro drug release. The optimized Nano-formulation showed enhanced drug encapsulation and sustained release behaviour, which may improve pulmonary bioavailability and therapeutic efficacy. The validated RP-HPLC method proved suitable for routine quality control analysis of rutin and silymarin in bulk drugs and Nano-formulations.The findings suggest that the developed analytical method is reliable and reproducible, while the rutin–silymarin Nano-formulation represents a promising phytopharmaceutical approach for the management of asthma through improved delivery and enhanced anti-inflammatory activity
Bronchial asthma is a chronic inflammatory condition of the airways characterized by airway hyper responsiveness and fluctuating airflow restriction in response to irritating stimuli, which is frequently reversible spontaneously or with therapy.1In bronchial asthma, airway blockage is reversible, however in COPD (Chronic Obstructive Pulmonary Disorder), the obstruction is either not reversible or only partially reversible with bronchodilators. Common symptoms include wheezing, coughing, tightness in the chest, and shortness of breath.1 Asthma is a complex disorder that is influenced by both genetic and environmental factors. Despite the fact that the etiology of airway inflammation is unknown, tremendous progress has been achieved in our fundamental understanding of asthma pathology.2 Since the late 1980s, the number of persons suffering from asthma has risen, as has the fatality rate.
Causes of Asthma
Allergies:
Allergies Animal proteins (mostly from cats and dogs), dust mites, cockroaches, and fungi are common indoor allergy sources.3 The desire for energy-efficient housing may have increased exposure to these causes of asthma.3 Allergic reactions caused by antibodies in the blood frequently result in the airway inflammation associated with asthma.
Genetics:
If your family has a history of asthma or allergic diseases, you have a higher risk of developing the disease.4
Allergies:
Having allergies increases the likelihood that you will experience asthma attacks.5
Environment :
Asthma can develop from exposure to airborne allergens and irritants. These substances include allergies, pollutants, vapors, and second- or third-hand smoke. Infants and early toddlers are especially vulnerable since their immune systems are still growing.5,6
Respiratory infections:
The developing lungs of young children can be harmed by some respiratory diseases, including respiratory syncytial virus (RSV).6
Pathophysiology
Normally, an allergic reaction to an allergen causes an asthma attack, which is then mediated by immunoglobulin E. When allergens such as pollen or animal dander are present, IgE is generated 7. Sensitization occurs following initial exposure, which results in the formation of IgE antibodies specific to allergens that stick to the surface of mast cells. When the allergen binds to the allergen- specific IgE antibodies on the surface of mast cells after repeated contact, inflammatory mediators such as leukotrienes, histamine, and prostaglandins are produced. These inflammatory mediators cause bronchospasm, which initiates an asthma episode. In an untreated attack, mast cells, T-helper cells, and eosinophils enter the airways4. In addition to heightened airway tone and hyper responsiveness, goblet cells' excessive mucus production
Diagnostic test for Asthma:
• Spirometry: Spirometry is a noninvasive test that involves inhaling deeply and pushing out air via a hose that is attached to a device known as a spirometer.
• Eczema (bumpy rashes caused by allergies)
• Chest X-ray
Nano-formulation
Nano-formulations typically range in size from 10 to 100 nm, with the drug dissolved, entrapped, encapsulated, or connected to the drug carrier. When developing nano-drugs, several important properties must be considered. The formulation must allow the medicine to reach the site of action from the point of delivery while also protecting it from the negative effects of environmental conditions such as pH, enzyme attack, and probable biochemical breakdown. Furthermore, the formulation should release the payload in its active state in and around the target region, allowing for smaller doses to produce a strong pharmacological impact 16
Relevance and Motivation
Asthma is a chronic respiratory illness affecting over 260 million individuals globally. According to the World Health Organization (WHO), it is one of the most frequent Non- communicable diseases, posing a considerable public health burden. Developing successful formulations is crucial to improving the quality of life for millions of patients who use inhalers, tablets, and other antiasthmatic medications. Inhaled treatment is the most common technique to treat asthma. However, achieving consistent and accurate drug administration to the lungs remains problematic, particularly in chronic care. Advanced formulations can enhance drug absorption and targeting, leading to fewer side effects and better therapeutic outcomes.17 The project provides an opportunity to employ High Performance Liquid Chromatography (HPLC) ideas, with a focus on ensuring formulations are strong. Nanoparticles, liposomal delivery methods, and dry powder inhalers (DPIs) can improve therapeutic efficacy while lowering systemic drug exposure. Current formulations may fail to address important issues such as patient compliance (due to the complexity of inhaler use), environmental concerns (CFC-free formulations),and drug.Innovative formulations that target severe asthma or address steroid resistance have the potential to close significant treatment gaps. Regulatory incentives for novel drugs, notably orphan drug classification for severe asthma variants, help to spur the development of new antiasthmatic formulations. The growing market for respiratory drugs, fueled by higher diagnostic rates, has great promise. Improved formulations can gain significant market share and regulatory approval, allowing for a faster launch. An anti-asthmatic formulation project is incredibly significant.19
High Performance Liquid Chromatography:
In analytical chemistry, high-performance liquid chromatography (HPLC), originally known as high- pressure liquid chromatography, is a method for separating, identifying, and quantifying each component in a mixture.21 It uses pumps to move a pressured liquid solvent that contains the sample combination through a solid adsorbent material-filled column. Every component in the sample has a slightly different interaction with the adsorbent material, which results in varying flow rates for the various components and ultimately leads to the separation of the components as they flow out of the column21.HPLC has been used for manufacturing i.e during the production process of pharmaceutical and biological products, legal such as performance enhancement drugs in urine, research like separating components of a complex biological samples, or of a similar synthetic chemicals from each other and medical purpose which means detecting vitamin D level in blood serum etc22.Chromatography is a mass transfer method that involves adsorption. HPLC uses pumps to transport a pressurized liquid and a sample mixture through an adsorbent-filled column, resulting in the separation of the sample components.23 The adsorbent, the column's active component, is commonly a granular material composed of solid particles (such as silica or polymers) ranging in size from 2 to 50 um. The sample mixture's components are separated by their varying degrees of contact with the adsorbent particles23.A "mobile phase" is the pressurised liquid, which is often a mixture of solvents (e.g., water, acetonitrile, and/or methano). Its composition and temperature have a significant impact on the separation process because they influence the interactions between sample components and adsorbent24. These interactions are physical in nature, such as hydrophobic (dispersive), dipole-dipole, and ionic, which are commonly combined26.HPLC differs from traditional ("low" chromatography in that operational pressures are significantly higher (50-350 bar), whereas ordinary liquid chromatography typically relies on gravity to pass the mobile phase through the column. Because of the tiny sample size pressure") liquid separated in analytical HPLC; the average column size is between 30 and 250 mm in length and between 2.1 and
4.6 mm in diameter28. Additionally, smaller adsorbent particles—with an average particle size of 2–50 um—are used to make HPLC columns. Because of this, HPLC is a widely used chromatographic technique because it has greater resolving power, or the capacity to discriminate between chemicals, when separating mixtures29.
Types of High-performance liquid chromatography:
Reversed-phase HPLC:
The chromatographic method known as RP-HPLC uses a polar, aqueous mobile phase and a non-polar, hydrophobic stationary phase28-29. Carbon chains, such as C8/C18, are often coated on the particles in the reversed-phase column. We employ about 70% of this procedure out of all the HPLC procedures because of its broad applicability and repeatability30.
Normal phase HPLC:
NP-HPLC is the traditional type of chromatography; unlike reversed-phase chromatography, it employs a polar stationary phase (hydrophilic) and a non-polar mobile phase30. Depending on the chosen stationary phase, this separation process is sometimes referred to as adsorption chromatography if it relies on adsorption32. To be more precise, this method uses only organic solvents in its mobile process. This indicates that chemicals are separated without the usage of water.
Size-exclusion HPLC:
For size exclusion or gel-filtration chromatography, porous stationary particles are necessary because they trap smaller particles inside and speed up the movement of larger molecules. The pore-size material is carefully regulated and filled into the size exclusion chromatography column. The longer the retention time of the analyte, the smaller it is30.
lon-exchange HPLC:
One kind of HPLC called ion-exchange chromatography is used to separate polar chemicals and late ions according to how well they bind to an ion exchanger31. One of the primary benefits of ion chromatography is that it is the most often used technique for purifying proteins and other charged molecules. In IE-HPLC, an electric charge on the surface of stationary phase particles attracts the particles33. The retention time of the eluted molecules are dependent on the concentration of salt ions in the solution as well as their intrinsic charge. There are two kinds of ion chromatography: anion- exchange and cation-exchange. Anion exchange particles are negatively charged, positively charged cation exchange particles that interact with positive ions33.
Instrumentation of HPLC:
The components of high-performance liquid chromatography (HPLC) include a solvent reservoir, degasser, pump, sample loop (injector), column, column oven, and detector. One of the most important components for HPLC separation is the HPLC column, where the component separation takes place32.
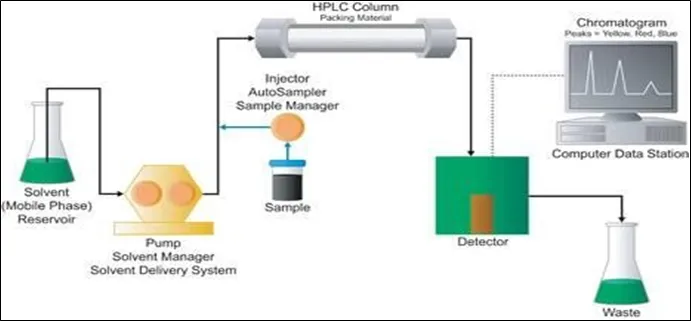
Figure 1.1: Components of HPLC
Solvent reservoir:
It is employed for storing solvents or the mobile phase. HPLC typically uses polar and non-polar liquid mobile phases, such as buffer, methanol, acetonitrile, and water, or an appropriate combination, whose precise concentration varies based on the sample's characteristics40.
Pump:
The HPLC pump provides high pressure, which results in a steady, pulseless, and repeatable flow of the mobile phase. Since a typical HPLC pump must be able to pump against pressures of up to 6,000 PSI, reciprocating piston pumps are typically utilised in HPLC. Syringe pumps and pneumatic pumps are utilised as isocratic and gradient modes, respectively, whereas reciprocating pumps are employed as isocratic and gradient modes. As needed, the various pump types are offered as single, binary, or quaternary41.
Degasser:
An in-line part called a vacuum degasser eliminates dissolved gases from solvents or the mobile phase. The solvent passes through tubing located in a vacuum chamber inside the vacuum degasser41. A vacuum pump that runs continually maintains the chamber's partial vacuum. In the coil, the solvent travels. A vacuum is used to pull the dissolved gases through the tube wall.44
Injector:
Rheodyne injectors, septum injectors, and stop flow injectors are examples of HPLC injectors, of
system; the injection volume of the sample usually uses between 5 and 100 microlitres45. The injectors should have high reproducibility and work on the high back pressure of HPLC (up to 4000 psi).45
Column:
The quantity of molecules in the sample, chromatographic applications, and attributes will all influence the HPLC column dimensions chosen for the analysis40. Modern columns are typically composed of stainless steel tubes, which are packed with spherical silica gels covered with a hydrophobic stationary phase that has molecules between 3 and 10 µm in size. Columns range in length from 50 to 300 mm, with a diameter of 2 to 5 mm40.
Column oven:
Nowadays, the column oven in LC is a crucial component for controlling column temperature. A suitable column temperature management is required for molecules separated at the marginal resolution of the critical peak pair. It is also advantageous when a viscous buffer solution is employed as the mobile phase46.
As the viscosity lowers, so does the backpressure of the system. In general, increasing the column temperature accelerates and improves the chromatographic separation process46.
Detector:
A detector is an instrument used to detect solutes eluted from an HPLC column. The detector turns wastewater into an electrical signal, which is recorded by the computerised system. The UV/VIS and PDA detectors are the most widely employed in HPLC, while other types of HPLC detectors include the mass detector (LC-MS), fluorescence detector, and infrared detector, among others47-46.
Data acquisition and control system:
Each system parameter is managed by a computer47. Mobile phase composition, flow rate, wavelength, run time, temperature, sample sequence, and injection volume are some of the HPLC parameters. Its purpose is to constantly monitor the system and verify the back pressure, as well as to integrate the gathered data48-47.
Applications of HPLC:
• Purification of water.
• Detection of contaminants in pharmaceutical industry.
• Chromatography using ligand exchange.
• Proteins are chromated using ion exchange.
• Carbohydrate and oligosaccharide chromatography using high-pH anion exchange.
Advantages of HPLC:
• High-performance liquid chromatography (HPLC) identifies specific chemical components in a sample quickly and precisely.
• High-performance liquid chromatography allows for quick and exact quantitative analysis.
• Some procedures can benefit from using a gradient solvent system.
• Reproducibility is high.
• HPLC can be improved to mass spectroscopy (MS). • HPLC is faster, more efficient, and provides higher resolution than other chromatographic techniques like TLC, column chromatography, and paper chromatography.
• Manages all analytical areas to boost production.
Disadvantages of HPLC:
• HPLC can be a costly procedure because it requires a lot of pricey organics, a power source, and frequent maintenance.
It can be challenging to solve issues or create new techniques.
• There is no all-purpose HPLC detector; the UV-Vis detector can only identify chromophoric chemicals.
• GC is more efficient than high-performance liquid chromatography in terms of separation efficiency; it is also more challenging for novices.
• The mobile phase, sample cleanliness, and system functionality are all necessary for the HPLC pump process to be reliable.
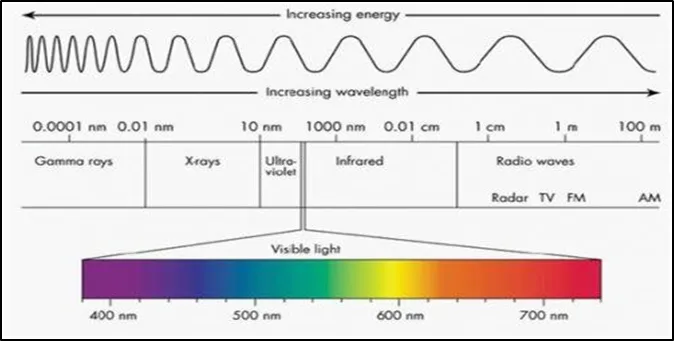
Figure 1.2: UV Radiations
Origin and Characteristics of UV-Visible Spectrum:
Electromagnetic radiation in the UV-visible area interacts with molecules, ions, or complexes to produce the UV-VIS spectrum48. It serves as the foundation for the investigation of various compounds, including organic, inorganic, and biomolecules. Applications for these conclusions can be found in clinical labs, industry, research, and the chemical examination of environmental samples. Thus, it is crucial to understand the UV-VIS spectrum's genesis and properties. UV-Vis spectroscopy is an analytical method that counts the number of distinct UV or visible light wavelengths that a sample absorbs or transmits when compared to a reference or blank sample47-48. This characteristic is affected by the makeup of the sample and may reveal information about the contents and concentration of the sample. Given that this spectroscopy method depends on light, let's start by talking about light's characteristics46.
The energy contained in light is inversely proportional to its wavelength. Therefore, the energy of light is higher at shorter wavelengths and lower at longer wavelengths. The promotion of electrons in a substance to a higher energy state, which we can detect as absorption, requires a certain amount of energy49. To advance to a higher energy state, electrons in various bonding conditions within a substance need varying amounts of energy. This explains why various compounds absorb light at different wavelengths. The visible light spectrum that humans can perceive ranges from around 380 nm, which is violet, to 780 nm, which is red.1 The wavelengths of UV light are about 100 nm shorter than those of visible light50. By identifying the precise wavelengths that correspond to maximal absorption, UV-Vis spectroscopy can be used to evaluate or identify various chemicals. This is because light can be defined by its wavelength (see the Applications of UV-Vis spectroscopy section).
Radiation and energy
One type of energy transmission is radiation. Due to the simultaneous oscillation of electric and magnetic fields in planes that are perpendicular to one another and to the direction of transmission through space, electromagnetic radiation gets its name. Due to its dual nature, electromagnetic radiation can be classified as either particle or wave50.
The nature of light
Light is an energy form. Either wave motion or particle motion can move energy from one place to another destination. Consequently, various ideas regarding the nature of light have been put forth52. Among the key theories are the following:
1. Somewhat similar to theory
2. Theory of electricity waves.
The nature of electromagnetic radiation and spectral regions:
The electromagnetic spectrum is made up of a wide variety of frequencies and wavelengths (energies). It ranges from radio waves with extremely low energy to gamma rays with extremely high energy52. It is usual to refer to the whole spectrum of radiation as the electromagnetic spectrum. According to the techniques needed to produce and detect different kinds of radiation, the primary spectral portions of the spectrum are depicted in the picture below50,51.
Absorption and Emission of Radiation:
Matter and electromagnetic radiation can interact in a variety of ways. The interaction is referred to as "absorption" if it causes energy to be transferred from a radiant energy beam to the matter29. Alternatively, "emission" refers to the process by which some of the internal energy of matter is transformed into radiant radiation. During the emission process, excited species might revert to ground states or lower energy states to release photons with distinctive energies29,52. Upon exiting the sample, some of the radiation that enters the material may be dispersed, reflected, or re-emitted at the same or a different wavelength rather than being absorbed. As it travels through the sample, radiation that is not absorbed nor scattered may experience polarization or orientation changes53.
Absorption of radiation:
Radiation always loses energy when it is absorbed by matter, and the atoms or molecules in the medium always acquire energy in return. Absorption of radiation energy manifests as increased internal energy or as increased rotational and irrational energy of the absorbing medium's atoms and molecules. In general, radiation absorption does not directly increase translational energy, but it can do so indirectly through the breakdown of electronic energy or the conversion of vibrational or rotational energy to translational energy through intermolecular collisions53.
Interaction of Matter with radiation:
Spectroscopy is the general term for the branch of science that studies how molecules, ions, atoms, or nuclei absorb, emit, or scatter electromagnetic energy. Spectroscopic techniques are among the most commonly utilised analytical methods in the world today. These methods are effective for determining the identity and concentration of unknown compounds in solution. There are various electromagnetic spectrum regions that can be employed to interact with matter, including visible, ultraviolet, infrared, and X-ray radiation. When radiation interacts with matter, it may be redirected or undergo changes in the energy levels of the atoms or molecules53.
Absorption: When energy is transferred from the radiation field to an absorber, atom, molecule, or solid, the level changes from lower to higher50.
Emission: An energy transfers from the emitter to the radiation field that causes a change in level from higher to lower. Nonradioactive decay is the change from higher to lower energy levels without any radiation being released. A spectrum is the term for the information derived by spectroscopy. The intensity of observed energy plotted against the energy's wavelength (or mass, velocity, frequency, etc.) is called a spectrum. Information on atomic and molecular energy levels, molecular geometries, chemical bonds, molecular interactions, and associated processes can all be found in a spectrum. Spectra are frequently employed in qualitative analysis to determine the components of a sample51-52.
Instrumentation:
Light source:
Since it is a light-based method, it requires a constant source of light with a broad spectrum of wavelengths. One xenon bulb is frequently utilised as a high-intensity light source for both thevisible and ultraviolet spectrums. However, as compared to tungsten and halogen lamps, xenon lamps are more expensive and possess less stability. The visible light in instruments with two lamps is often produced by a tungsten or halogen lamp, while the UV light is typically produced by a deuterium lamp. The instrument's light source needs to swap during measurement since it requires two distinct light sources to scan both the visible and UV wavelengths57.
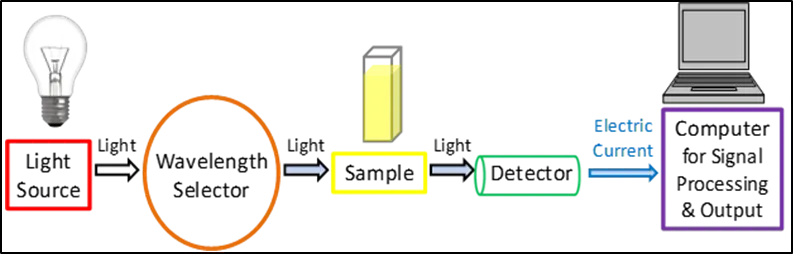
Figure 1.3: Components in a UV-Vis spectroscopy
The light source of the device must swap during measurement since two distinct light sources are required to scan the visible and UV wavelengths. In reality, this switchover usually takes place during the scan between 300 and 350 nm, when the transition may be done more smoothly and the light emission from both light sources is comparable58.
Wavelength selection:
The next step is to choose from the wide range of light wavelengths that the light source emits certain wavelengths that are appropriate for the type of sample and the analyte for detection in order to examine the sample29. Techniques for this include
Mono-chromators:
It divides light into a limited range of wavelengths using a monochromator. Its most common foundation is a rotating diffraction grating that allows one to select the appropriate light wavelength by adjusting the incoming and reflected angles. The groove frequency of the diffraction grating is frequently expressed as the number of grooves per millimetre. Although the useful wavelength range is reduced, a greater groove frequency offers superior optical resolution30. Although a lower groove frequency offers a wider range of useful wavelengths, the optical resolution is reduced. It is possible
to use 300 to 2000 grooves per mm for UV-Vis spectroscopy, while 1200 grooves per mm is the norm30-
31.
Absorption filters:
Typically, absorption filters are composed of coloured glass or plastic and are intended to block specific light wavelengths60.
Interference filters:
These widely utilised filters—also known as dichroic filters—are composed of several dielectric layers where interference arises between the thin material layers. By causing destructive interference, these filters can be utilised as a wavelength selector to exclude unwanted wavelengths59.
Cutoff filters:
Cutoff filters let through light that is either below (short pass) or above (long pass) a specific wavelength. Often, interference filters are used to implement this59.
Bandpass filters:
When short pass and long pass filters are combined, bandpass filters enable a variety of wavelengths to go through. Because monochromators are so versatile, they are most frequently employed for this technique58,59. Nonetheless, filters are frequently employed in conjunction with monochromators to enhance the signal-to-noise ratio and further reduce the light wavelengths chosen for more accurate measurements.
Sample analysis:
A reference sample, often known as the "blank sample," such as a cuvette filled with a similar solvent used to create the sample, must be measured for all analyses in order for the light to pass through a sample, regardless of the wavelength selection used in the spectrophotometer60. The aqueous buffered solution devoid of the material of interest is utilised as the reference if measurements are made using an aqueous buffered solution that contains the sample. The sterile culture media would serve as the reference when analysing bacterial cultures60. The equipment then automatically uses the signal from the reference sample to help determine the actual absorbance values of the analytes. It is critical to understand the materials and circumstances utilised in research involving UV Vis spectroscopy59. In UV absorption investigations, for instance, most plastic cuvettes are unsuitable since plastic typically absorbs UV radiation. It is possible for glass to function as a filter, letting some UVA (315 400 nm)light through while blocking most UVC (100 280 nm) and UVB (280 315 nm) light. Since most UV light can pass through quartz, sample containers made of quartz are necessary for UV inspection. Air can also be thought of as a filter since the molecular oxygen in the air absorbs light wavelengths shorter than around 200 nm. For wavelengths less than 200 nm, a specialised and more costly setup is needed, typically involving an optical system filled with pure argon gas. For the examination of very small sample quantities, such as in DNA or RNA investigations, cuvette-free devices are also available59,60.
Detection:
A detector transforms the light into a readable electronic signal once it has passed through the sample. Detectors typically rely on semiconductors or photoelectric coatings. In the presence of light, a photoelectric coating releases electrons that are negatively charged. An electric current that is proportionate to the intensity of the light is produced when electrons are expelled. One of the more widely used detectors in UV-visible spectroscopy is a photomultiplier tube (PMT)61. A PMT uses the photoelectric effect to first expel electrons when exposed to light, then multiply those ejected electrons one after the other to produce a greater electric current. For the detection of extremely low light levels, PMT detectors are particularly helpful. An electric current proportionate to the intensity of the light can flow through semiconductors when they are exposed to it. More precisely, two of the most widely used semiconductor-based detectors are photodiodes and charge coupled devices (CCDs)60. The signal is identified and sent to a computer or screen once the electric current has been produced by the detector that was employed. Simplified schematic schematics of UV-Vis spectrophotometer configurations are displayed in Figures 2 and 3.
Beer-Lambert law:
Prior to 1729, Pierre Bouguer was the first to develop the legislation. Bouguer's results were eventually credited to Johann Heinrich Lambert. One of the variables that influenced absorbance according to the law was path length. Beer later expanded the concept to cover solution concentration in 1852, which is how the law came to be known as Beer-Lambert concept61.
Because of the Beer-Lambert law, we can use the absorbancies to determine the concentration of a solution or plot a graph of different concentrations, align them to their correct absorbencies, and use a colorimeter to determine the concentration of an unknown solution. The law states that the amount of light absorbed by a substance dissolved in a fully transmitting solvent is directly proportional to the concentration of the substance and the path length of the light through the solution61.
According to the law, A(λ) = e(λ) l c.The absorptivity of the material at wavelength λ is the proportionality constant e (λ). If the concentration is expressed in moles/liter, e (λ) is known as the molar absorptivity.
• The absorbance is inversely proportional to the transmittance of the solution.
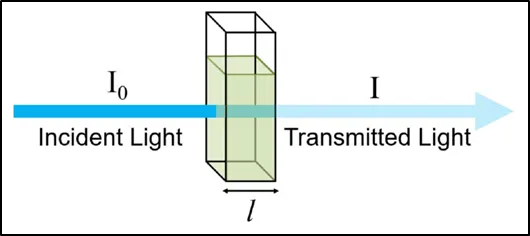
Figure 1.4: Transmittance and absorbance
Strengths and limitations of UV-Vis spectroscopy:
UV Vis spectroscopy is not an exception to the rule that no single approach is flawless. Nonetheless, the method is well-liked due to a few key advantages that are mentioned below.
1. The technique is non destructive, allowing the sample to be reused or proceed to further processing or analyses.
2. Measurements can be made quickly, allowing easy integration into experimental protocols.
3. Instruments are easy to use, requiring little user training prior to use.
4. Data analysis generally requires minimal processing, again meaning little user training is required.
5. The instrument is generally inexpensive to acquire and operate, making it accessible for many laboratories.
Applications of UV-Vis spectroscopy:
DNA and RNA analysis:
The 260 nm/280 nm absorbance (260/280) ratio, which is summarised in Table 2, can be used to identify potential contamination in nucleic acid samples. Pure DNA usually has a 260/280 ratio of 1.8, whereas pure RNA typically has a ratio of 2.0. The reason that pure DNA has a lower 260/280 ratio than RNA is that thymine, which is replaced by uracil in RNA, has a lower 260/280 ratio than
uracil. Protein-contaminated samples will have a lower 260/280 ratio because of higher absorbance at 280 nm23,25.
Pharmaceutical analysis:
The pharmaceutical sector is one of the most frequent users of UV-Vis spectroscopy. In example, overlapping absorbance peaks in the original spectra can be resolved to identify specific medicinal substances when UV-Vis spectra are processed using mathematical derivatives. For instance, by using the first mathematical derivative to the absorbance spectra, it is possible to simultaneously identify the antibiotic chlortetracycline and the local anaesthetic benzocaine in commercial veterinary powder formulations23,25. Through the development of a calibration function for each chemical, simultaneous quantification of both compounds was achievable on a concentration range of microgrammes per millilitre23.
Method Validation:
This procedure entails determining the method's limitations and performance qualities.
Method Performance Parameters are Determined using Equipment that is:
1. Within the parameters
2. Functioning properly
3. Properly adjusted
Method Validation is required when:
1. A new method is being developed
2. Revision of the established method
3. When established method are used in different laboratories and by different analysts etc.
4. Comparison of method
5. When quality control indicates method changes
Performance characteristics examined when carrying out method validation are:
1. Accuracy
2. Precision
3. Specificity
4. Selectivity
5. Sensitivity
6. Limit of detection.
7. Limit of quantification
8. Linearity and Range
9. Ruggedness
10. Robustness
11. System suitability
1. Accuracy
Accuracy is the degree to which the measured value closely resembles the sample's true value. In order to evaluate accuracy, the ICH publications suggested that at least nine determinations be made over a minimum of three concentration levels within the designated range (that is, three concentrations and three replicates of each concentration)32. At each level (80, 100, and 120 percent of label claim), it is advised to analyse samples at least three times in order to test accuracy (% Recovery and % RSD of individual measurements). Fresh samples were made for every determination, and the assay value was computed. The regression equation derived from the linearity analysis was used to compute recovery. A set of replicate analyses' mean relative error— that is, the difference between the measured and nominal concentrations for spiked samples—was used to calculate accuracy32,23.
2. Precision
The degree of agreement between a series of measurements taken from multiple samplings of the same homogenous sample under specified conditions is expressed as the precision of an analytical method. The standard deviation, relative standard deviation, or coefficient of variations of a set of observations are typically used to represent the precision of an analytical procedure. According to the ICH standards, a minimum of nine determinations spanning a specific range of procedures should be used to evaluate repeatability. Precision may be measure of either the degree of reproducibility or of repeatability of the analytical method under normal operating conditions34.
∑(𝒙 − 𝒙̅̅)̅𝟐
𝑺𝒕𝒂𝒏𝒂𝒅𝒂𝒓𝒅 𝑫𝒆𝒗𝒊𝒂𝒕𝒊𝒐𝒏 = √
𝒏 − 𝟏
Where,
𝑥 = 𝑠𝑎𝑚𝑝𝑙𝑒,
𝑥̅ = 𝑚𝑒𝑎𝑛 𝑣𝑎𝑙𝑢𝑒 𝑜𝑓 𝑠𝑎𝑚𝑝𝑙𝑒𝑠,
𝑛 = 𝑛𝑢𝑚𝑏𝑒𝑟 𝑜𝑓 𝑠𝑎𝑚𝑝𝑙𝑒𝑠
𝑹𝒆𝒍𝒂𝒕𝒊𝒗𝒆 𝑺𝒕𝒂𝒏𝒅𝒂𝒓𝒅 𝑫𝒆𝒗𝒊𝒂𝒕𝒊𝒐𝒏 =
𝑺𝒕𝒂𝒏𝒅𝒂𝒓𝒅 𝑫𝒆𝒗𝒊𝒂𝒕𝒊𝒐𝒏
× 𝟏𝟎𝟎
𝒙̅
Repeatability:
Repeatability is the ability to convey precision over a brief period of time under the same operational conditions. Another name for repeatability is intra-assay precision72.
Intermediate Precision:
Intermediate precision is expressed in laboratory variances such as different days, analysts, and equipment35.
Reproducibility:
When the operation is performed by various analysts in separate laboratories with varying equipment, regents, and laboratory settings. Reproducibility was assessed using repeatability and intermediate precision measurements. An inter laboratory trial is used to evaluate reproducibility71,70.
3. Specificity
Specificity should be investigated during identification test validation and impurity determination. An ICH publication defines specificity as the capacity to assess indisputably the analyte in the presence of substances that can be predicted to products and matrix components68,67. The definition implies the following:
Identification test:
Suitable identification tests should be able to distinguish between substances with nearly comparable structures that are likely to be present. To ensure the identity of an analyte, it should be free of interference from other extraneous components and well separated from them.
Purity Test:
To ensure that all the analytical procedures performed allow an accurate statement of the content of impurity of the content of impurity of an analyte i.e. related substances test, heavy metals, residual solvents etc.
Assay:
To provide an exact result, this allows an accurate statement on the content or potency of the analyte in a sample.
4. Selectivity:
It is a procedure to detect qualitatively the analyte in the presence of compounds that may be expected to be present in the sample matrix or the ability of a separative method to resolve different compounds. It is the measure of the relative method location or two peaks.
Determination of selectivity:
Comparing the test findings obtained on the analyte with or without the presence of potentially interfering material allows one to evaluate selectivity. Determining the recovery of a standard addition of pure analyte to a medium containing a consistent amount of the other compounds might provide a measure of selectivity in situations when such components are either unknown or unavailable.
5. Sensitivity
Sensitivity is the capacity of the test procedure to record small variation in concentration. It is the slope of the calibration curve.
6. Limit of detection (LOD)
It is the smallest concentration of analyte in a sample that can be found under the specified experimental circumstances, albeit it is not always quantified as an exact value. The analyte concentration (% parts per million) in the sample is typically used to express the detection limit.
Determination of detection limit
The study of samples with known analyte concentrations and the establishment of the lowest level at which the analyte can be consistently identified are the traditional approaches for determining the detection limit for both instrumental and non-instrumental procedures.
𝑳𝑶𝑫 = 𝟑. 𝟑 × 𝑺𝒕𝒂𝒏𝒅𝒂𝒓𝒅 𝑫𝒆𝒗𝒊𝒂𝒕𝒊𝒐𝒏
𝑺𝒍𝒐𝒑𝒆
7. Limit of quantification (LOQ)
Under the specified experimental conditions, it is the lowest concentration of analyte in a sample that can be identified with a reasonable level of precision and accuracy. The analyte concentration in the sample, such as the percentage ppm, is used to express the quantification limit.
Determination of quantification limit
In both instrumental and non-instrumental approaches, the quantitation limit is typically established by analyzing samples with known analyte concentrations and determining the lowest level at which the analyte can be identified with a satisfactory degree of accuracy and precision.
𝑳𝑶𝑫 = 𝟏𝟎 × 𝑺𝒕𝒂𝒏𝒅𝒂𝒓𝒅 𝑫𝒆𝒗𝒊𝒂𝒕𝒊𝒐𝒏
𝑺𝒍𝒐𝒑𝒆
8. Linearity and Range
The capacity to produce test results that are exactly proportionate to the analyte concentration in samples is known as linearity in analytical procedures. The intervals between the sample's higher and lower analyte concentrations for which it has been shown that the analytical process has an adequate degree of precision, accuracy, and linearity are known as the analytical range36,37.
𝒓𝟐 = 𝒏(∑ 𝒙𝒚) − (∑ 𝒙)(∑ 𝒚)
√(𝒏 ∑ 𝒙𝟐) − (∑ 𝒙)𝟐 (𝒏 ∑ 𝒚𝟐) − (∑ 𝒚)𝟐
Determination of linearity and range:
The technique is applied to a set of samples with analyte concentrations that fall within the stated procedure range in order to ascertain these features. When there is a nonlinear relationship between response and concentration, standardization can be achieved by the use of a calibration curve33.
The ICH advises using a minimum of five commonly used concentrations to establish linearity.
9. Ruggedness
The degree to which test results obtained by analyzing the same samples under various conditions— different laboratories, different analysts, different instruments, etc.—can be repeated is typically expressed as the degree to which operational and environmental variables of the analytical method have no effect on test results. Ruggedness is a metric used to quantify how reproducible test findings are under conditions that vary from lab to lab and amongst analysts33,34. The degree to which test results are representative is then ascertained in relation to the assay variable33.
Through the use of operational and environmental variables that may vary but remain within the designated range of the assay variable, aliquots from homogenous lots are analyzed by various analysts in various laboratories41.
∑(𝒙 − 𝒙̅̅)̅𝟐
𝑺𝒕𝒂𝒏𝒂𝒅𝒂𝒓𝒅 𝑫𝒆𝒗𝒊𝒂𝒕𝒊𝒐𝒏 = √
𝒏 − 𝟏
Where,
𝑥 = 𝑠𝑎𝑚𝑝𝑙𝑒,
𝑥̅ = 𝑚𝑒𝑎𝑛 𝑣𝑎𝑙𝑢𝑒 𝑜𝑓 𝑠𝑎𝑚𝑝𝑙𝑒𝑠,
𝑛 = 𝑛𝑢𝑚𝑏𝑒𝑟 𝑜𝑓 𝑠𝑎𝑚𝑝𝑙𝑒𝑠
𝑹𝒆𝒍𝒂𝒕𝒊𝒗𝒆 𝑺𝒕𝒂𝒏𝒅𝒂𝒓𝒅 𝑫𝒆𝒗𝒊𝒂𝒕𝒊𝒐𝒏 =
𝑺𝒕𝒂𝒏𝒅𝒂𝒓𝒅 𝑫𝒆𝒗𝒊𝒂𝒕𝒊𝒐𝒏
× 𝟏𝟎𝟎
𝒙̅
10. Robustness
Analytical methods' robustness is a measure of their ability to withstand minor but intentional changes in method parameters and gives an indicator of how reliable they are under typical operating conditions40. Testing with some or all of the conditions changed:
• Solvent
• Column temperature
• pH of buffer in mobile phase
• Flow rate
• Wave length
∑(𝒙 − 𝒙̅̅)̅𝟐
𝑺𝒕𝒂𝒏𝒂𝒅𝒂𝒓𝒅 𝑫𝒆𝒗𝒊𝒂𝒕𝒊𝒐𝒏 = √
𝒏 − 𝟏
Where,
𝑥 = 𝑠𝑎𝑚𝑝𝑙𝑒,
𝑥̅ = 𝑚𝑒𝑎𝑛 𝑣𝑎𝑙𝑢𝑒 𝑜𝑓 𝑠𝑎𝑚𝑝𝑙𝑒𝑠,
𝑛 = 𝑛𝑢𝑚𝑏𝑒𝑟 𝑜𝑓 𝑠𝑎𝑚𝑝𝑙𝑒𝑠
𝑹𝒆𝒍𝒂𝒕𝒊𝒗𝒆 𝑺𝒕𝒂𝒏𝒅𝒂𝒓𝒅 𝑫𝒆𝒗𝒊𝒂𝒕𝒊𝒐𝒏 =
𝑺𝒕𝒂𝒏𝒅𝒂𝒓𝒅 𝑫𝒆𝒗𝒊𝒂𝒕𝒊𝒐𝒏
× 𝟏𝟎
11. System Suitability
The foundation of system suitability tests is the idea that the apparatus, electronics, analytical processes, and samples make up a cohesive system that can be assessed as a whole. System appropriateness is an essential component of chromatographic procedures, according to USP59. These tests confirm that the system's repeatability and resolution are sufficient for carrying out the analysis. As a result of evaluating robustness and ruggedness, a set of system appropriateness parameters should be developed to guarantee that the analytical method's validity is upheld at all times62.
REFERENCES:
Literature Survey
1. T. Jančová et al. (2011) developed and validated an isocratic HPLC method for the estimation of rutin in tablets using a C18 column with a methanol–water (60:40) mobile phase. The method achieved good linearity and precision, making it reliable for routine analysis. It was validated for accuracy, precision, and specificity across different batches. The reproducibility of the retention time and simplicity of the method further supported its practical use. The study proved that this HPLC setup is efficient and consistent for tablet dosage forms. Additionally, the short run time and simple solvent system reduce operational costs and make it a viable choice for both small and large- scale laboratories77. The researchers also highlighted that this method can be extended to similar flavonoid compounds. Thus, it plays a crucial role in standardization and quality control processes in the pharmaceutical industry. The method's adaptability in pharmaceutical settings ensures its value across research, manufacturing, and post-marketing surveillance77.
2. S. Saha et al. (2012) formulated an RP-HPLC method with UV detection for estimating rutin in marketed formulations. The method showed excellent linearity between 5–100 µg/mL and maintained an RSD below 2%. Its accuracy and precision were confirmed through method validation as per regulatory standards78. Robustness was observed under slight changes in experimental conditions. The method proved to be cost-effective and appropriate for quality control labs. It was able to quantify rutin accurately even in the presence of excipients, ensuring high specificity. The simplicity of the protocol and use of standard reagents make it ideal for routine pharmaceutical applications. Furthermore, the study suggests the method's compatibility with automation for high-throughput testing. This enhances its applicability in commercial production environments. Overall, it is a highly practical analytical technique for herbal and pharmaceutical industries, enabling consistent quality monitoring of routine formulations78.
3. R. Devi et al. (2016) validated a robust and sensitive RP-HPLC method for the estimation of rutin in complex herbal matrices. They used an acetonitrile–buffer system with pH 3.5, allowing better separation in multi-component formulations. The method showed minimal interference from excipients79. It was validated for linearity, sensitivity, and reproducibility. The study established its suitability for herbal product analysis and routine QC. Moreover, the method was able to handle a wide variety of sample types, including tablets and powdered extracts. The mobile phase composition provided excellent peak symmetry and reduced baseline noise. Their approach enabledhigher throughput and better sensitivity for low-concentration samples. This research adds significant value to analytical protocols involving bioactive polyphenols. Its relevance in the herbal industry cannot be overstated. It contributes to the advancement of phytopharmaceutical analysis through improved sensitivity and selectivity79.
4. C. Kvasnička et al. (2003) investigated the determination of silymarin flavonolignans from Silybum marianum using gradient HPLC. They successfully separated and quantified silybin A & B, isosilybin, silydianin, and silychristin. The method delivered reproducible results and precise quantification. Gradient conditions improved peak resolution and reduced overlapping. Their findings supported the use of this method for standardizing plant extracts. The separation of structurally similar compounds demonstrated the method's high resolution capacity80,81. Validation parameters confirmed the technique's reliability and robustness under routine testing conditions. Moreover, the authors recommended this method for fingerprint analysis of Silymarin-rich samples. It aids in identifying adulteration and maintaining batch-to-batch consistency. This study laid the groundwork for standardized herbal product development. Its applications can also extend to quality assurance in nutraceuticals and botanical supplements80.
5. R. P. Pawar et al. (2014) developed and validated an HPLC method for the quantitative estimation of silymarin in capsules. The mobile phase consisted of methanol and 0.1% phosphoric acid, ensuring effective peak separation. The method exhibited a linear response in the range of 10– 100 µg/mL and had well-documented LOQ and LOD values, confirming its sensitivity. Validation covered key parameters such as precision, specificity, and robustness. This made it a reliable approach for analyzing commercial dosage forms. The method also showed strong reproducibility across batches, enhancing confidence in its accuracy. It was found suitable even in the presence of pharmaceutical excipients. Such features make it highly applicable in both research and industrial settings. The method stands out for its simplicity, efficiency, and regulatory compliance. It contributes to safer, more reliable herbal therapeutic products81.
6. A. K. Singh et al. (2017) developed a gradient RP-HPLC method for the simultaneous estimation of silymarin and curcumin. The method was successful in avoiding co-elution, providing efficient separation of both compounds with distinct retention times. The mobile phase was optimized using gradient elution, and the method was validated in accordance with ICH guidelines. Parameters suchas precision, accuracy, specificity, and robustness were thoroughly tested. The use of RP-HPLC enabled high sensitivity and reproducibility, even in the presence of complex herbal matrices. The study confirmed that the method could handle a variety of formulation types including capsules, tablets, and extracts. Its robustness under stress conditions supports its use in stability testing. The simultaneous quantification reduces analysis time and costs, which is especially beneficial in manufacturing environments. This method is an important advancement in multi-component herbal drug analysis and standardization81,82.
7. M. S. Patel et al. (2015) performed a simultaneous estimation of rutin and quercetin in a polyherbal formulation using an HPLC method with diode array detection (DAD). This approach enhanced the sensitivity of detection and improved spectral confirmation of peak identity. The mobile phase was optimized with pH control, providing sharper peak resolution and better separation of the flavonoids. The method demonstrated excellent linearity and precision, confirming its applicability for routine quality control. The presence of both rutin and quercetin in polyherbal formulations can complicate analysis, but the use of DAD allowed for confident peak assignment. Additionally, validation studies revealed good recovery rates and low relative standard deviation (RSD) values83. The protocol was robust under varying conditions of flow rate and temperature. This made the method suitable for multi-herb preparations, where ingredient overlap is common. It supports advanced standardization practices for complex botanical formulations. The study contributes valuable data for the development of high-fidelity phytochemical assays81,83.
8. R. Kumar et al. (2020) developed and validated a highly accurate RP-HPLC method for the determination of rutin in herbal tablet formulations. The method showed a low limit of detection (LOD) at 0.52 µg/mL and a limit of quantification (LOQ) of 1.57 µg/mL. These sensitivity levels made it especially effective for detecting rutin even in low-concentration formulations85. Validation of the method demonstrated high levels of accuracy and reproducibility. The retention time was consistent across multiple sample batches, reinforcing its reliability for quality control settings. The mobile phase and analytical conditions were optimized for minimal baseline drift and improved resolution. Its application in herbal tablets shows its utility in the phytopharmaceutical sector. The study also verified the method’s specificity in the presence of common excipients. The simplicity of its sample preparation method further improves operational efficiency. This method proves suitable for both raw material testing and final dosage form evaluation85.
9. S. M. M. Zahid et al. (2021) proposed an HPLC-DAD method for the simultaneous determination of rutin and silymarin in polyherbal extracts. The analytical protocol allowed simultaneous separation and quantification, saving time and reducing resource usage. The method showed excellent linearity and accuracy for both analytes across a wide concentration range. It also demonstrated reliable recovery rates and low RSDs, meeting the requirements for routine quality control applications. Use of DAD enabled accurate identification based on UV spectral data, enhancing specificity85,86. The developed method was validated as per ICH guidelines for parameters such as precision, repeatability, robustness, and system suitability. The authors successfully applied the method to several marketed polyherbal formulations. This confirmed its broad utility in herbal medicine analysis. Additionally, the system's ability to distinguish between structurally similar components supports its use in complex matrix conditions. The study highlights the need for efficient multi-analyte testing methods in the evolving herbal industry86.
10. N. R. Deshmukh et al. (2018) established a validated isocratic RP-HPLC method for the estimation of silymarin in both bulk and dosage form. The method used a simple yet effective mobile phase and achieved specific separation of the target analyte from formulation excipients. The approach provided robust analytical data with consistent retention times and reproducible results. Method validation demonstrated satisfactory accuracy, linearity, and precision, even in the presence of potential interferents. It was also tested for its specificity, confirming no co-elution with excipients or degradation products. The authors focused on making the method user-friendly and adaptable for industry-level analysis. Their findings support the use of this protocol in regular batch testing and stability studies. The cost-effective nature of the mobile phase and the short runtime added to its industrial relevance. Overall, this method enhances the capacity for routine monitoring of silymarin-based pharmaceuticals87.
11. Y. Zhang et al. (2013) developed a gradient HPLC method for the simultaneous determination of rutin and quercetin in plant extracts. They employed a mobile phase of acetonitrile and formic acid, which allowed for efficient separation and enhanced sensitivity. The method was validated for accuracy, linearity, and recovery, all of which fell within acceptable limits for quantitative analysis. A major strength of the method was its ability to handle complex botanical matrices without interference from other phytochemicals. Its gradient elution program was optimized to reduce analysis time while preserving resolution86. Recovery experiments indicated over 98% retrieval ofboth flavonoids, proving method reliability. Precision studies showed low variability across multiple runs and days. This method was suggested for use in research, pharmaceutical, and nutraceutical industries. Its high level of specificity ensures correct identification and quantification of bioactive compounds. The study supports modern phytochemical profiling in diverse botanical materials88.
12. B. T. Li et al. (2010) developed an RP-HPLC method for the quality control of silymarin in traditional Chinese medicine. The method utilized detection at 288 nm and provided good linearity across a relevant concentration range. The mobile phase system and operational parameters were optimized to improve peak resolution and reduce analysis time. Robustness was verified through deliberate variation of method conditions such as pH and flow rate. Linearity studies yielded correlation coefficients exceeding 0.999, while repeatability and intermediate precision were both within acceptable limits. The method was particularly useful for separating key flavonolignans including silybin and silydianin. The authors emphasized its value for standardization of herbal raw materials and finished products. It is adaptable for both research and commercial production settings. Its practical design enables widespread use in routine testing protocols. Ultimately, it advances the reliability and consistency of herbal medicine quality control88.
13. D. Gopi et al. (2019) validated an RP-HPLC method for the simultaneous estimation of rutin and other bioflavonoids in herbal formulations. The mobile phase was optimized with a buffer of pH 4, leading to improved peak symmetry and enhanced separation efficiency. The method followed ICH guidelines for validation, covering parameters such as linearity, accuracy, precision, specificity, robustness, and detection limits. Application of this method to tablets, capsules, and liquid herbal preparations demonstrated its versatility89. The analysis showed consistent retention times and reproducible results across different sample types. It also displayed strong recovery rates, exceeding 98% in most test runs. The method addressed common challenges in herbal formulation testing, such as matrix interference and overlapping peaks. The researchers demonstrated that their protocol was cost-effective, fast, and suitable for high-throughput testing environments. The work serves as a foundation for more efficient and reliable polyphenol profiling in herbal drug development and regulatory monitoring89.
14. P. V. Nair et al. (2015) focused on the quantification of silybin in Silybum marianum extracts using an HPLC method with a methanol–water mobile phase. The simplicity and speed of this method were highlighted as major advantages for practical applications. The authors validated the method in terms of precision, linearity, and repeatability, all of which were within acceptable limits. Retention time reproducibility was excellent, ensuring consistency in analytical outcomes. The method was also able to detect low levels of silybin, proving useful for batch-to-batch assessment90. Its application was tested on both raw plant extracts and commercial formulations. Additionally, minimal sample preparation requirements and compatibility with standard lab equipment made the method highly accessible. The authors suggested its suitability for integration into routine quality control practices in the herbal industry. Overall, the method supports fast, accurate, and economical quantification of active ingredients in botanical extracts90.
15. J. Singh and R. Kumar (2022) presented a stability-indicating HPLC method for the estimation of rutin in pharmaceutical dosage forms. The method was designed to monitor degradation under stress conditions such as heat, light, acid, base, and oxidation. It effectively separated rutin from its degradation products, demonstrating high specificity and robustness. Validation studies confirmed acceptable values for linearity, accuracy, and precision90,89. The method was applied to routine tablet analysis, where it provided reliable quantification even in the presence of excipients and degradation impurities. It also exhibited high sensitivity, with low detection and quantification limits. The mobile phase composition was chosen for minimal baseline drift and reproducible peak areas. The study emphasized the method’s importance in long-term stability studies and formulation development. It is a key tool for ensuring the shelf-life and therapeutic efficacy of rutin-based products. This protocol strengthens the safety assurance of pharmaceutical formulations during product lifecycle management91.
16. K. Shukla et al. (2018) developed an RP-HPLC method for estimating silymarin in bulk drug using a methanol–water mobile phase in the ratio of 70:30. The method had a retention time of approximately 7 minutes and achieved excellent peak resolution. Sensitivity of the method was demonstrated with a limit of detection (LOD) of 0.07 µg/mL and a limit of quantification (LOQ) of
0.22 µg/mL. Validation was carried out according to standard analytical guidelines and showed consistent results for accuracy and repeatability. The method was robust against small changes in flow rate and column temperature91. It proved capable of analyzing silymarin in both pure andformulated states. High reproducibility and ease of execution make it practical for industrial application. It can also serve as a reference method for comparative studies with other silymarin assays. This contributes significantly to the pharmaceutical standardization and commercialization of silymarin-based therapies91.
17. H. Wang et al. (2020) introduced a comprehensive HPLC-DAD method aimed at the separation and quantification of various components within the silymarin complex. The study emphasized the analytical benefits of diode array detection, which enabled precise spectral matching and identification of multiple flavonolignans, including silybin, silydianin, and isosilybin. This method was validated for linearity, accuracy, and precision and proved robust against changes in instrumental conditions. It also supported both qualitative and quantitative applications, making itsuitable for in-depth phytochemical profiling92. The research highlighted the method’s capacity to detect minor compounds, crucial for assessing silymarin's full pharmacological profile. Use in various samples confirmed its adaptability to different herbal matrices. The authors proposed its use for routine QC and advanced research applications alike. This method represents a significant advancement in the detailed analysis of multi-component botanical extracts. It contributes to improved quality control and regulatory compliance in herbal product development91,92.
18. S. Sharma et al. (2019) validated an HPLC method for the estimation of rutin in polyherbal formulations and biological samples. The method was assessed for both pharmaceutical tablets and plasma, showing excellent accuracy and recovery rates exceeding 95%. Validation covered a full range of analytical parameters, including linearity, specificity, and precision. The method was especially suitable for bioavailability and pharmacokinetic studies due to its robustness in biological matrices93,92. It employed a C18 column with optimized mobile phase conditions that resulted in high-resolution peaks and minimal interference. Reproducibility and sensitivity were confirmed through inter-day and intra-day assessments. Its application in human plasma analysis indicates potential for clinical trial monitoring and therapeutic drug evaluation. Furthermore, the simple sample preparation steps improved throughput and reduced cost. This versatile approach reinforces the importance of validated methods for both in vitro and in vivo analyses. It provides a bridge between pharmaceutical quality control and clinical pharmacology93.
19. Aaditya Ganeshpurkar (2017) explored the pharmacological effects of rutin, particularly its role in managing respiratory inflammation such as asthma and whooping cough. The study demonstrated that rutin reduced airway resistance in sensitized guinea pigs and lowered biomarkers like histamine, phospholipase A2, and eosinophil peroxidase. It also reduced neutrophil and eosinophil infiltration, confirming its anti-inflammatory and anti-allergic potential93. The work supports the combined use of rutin with vitamins C and K to enhance its therapeutic effect. Although not an analytical method study, the research provided essential pharmacodynamic insights. It emphasized the clinical relevance of rutin, underlining the need for reliable methods to quantify it in dosage forms. These findings can inform formulation strategies aimed at respiratory conditions. The study supports the integration of phytochemicals into evidence-based medicine. It builds the scientific rationale for routine rutin analysis in health supplements and drug products93.
20. Peter F. Surai (2024) described the anti-inflammatory mechanisms of silymarin, focusing on its ability to suppress the TLR4/NF-κB signaling pathway. The study reported significant reductions in inflammatory cytokines such as TNF-α, IL-1β, IL-6, IL-12, and IL-23, along with chemokines like CCL4 and CXCL10. These effects were validated through both in vitro and in vivo models, reinforcing the clinical relevance of silymarin in managing chronic inflammation94. Though analytical techniques were not the primary focus, the findings strongly justify the need for accurate quantification of silymarin components in pharmaceutical formulations. The study highlights silymarin’s potential as a therapeutic agent in chronic inflammatory diseases. It provides biochemical markers for monitoring therapeutic efficacy. These insights call for the development and use of validated HPLC methods to ensure proper dosing and formulation stability. This work establishes a strong link between phytochemistry and immunopharmacology94.
21. P. M. Deshmukhe and M. S. Charade (2021) presented a broad overview of HPLC method development and validation as it pertains to pharmaceutical applications. They emphasized the importance of optimizing sample preparation, selecting appropriate mobile phases, and choosing the right column and detector combinations. The paper discussed the critical role of method validation during drug development and regulatory approval processes. It identified accuracy, precision, specificity, linearity, robustness, and detection limits as key parameters94. The authorsunderlined the value of HPLC in handling complex multi-component systems, particularly in the analysis of herbal and polyherbal formulations. Their discussion included the evolution of HPLC techniques, including advancements in column technology and detection systems. This foundational work serves as a guideline for researchers and analysts developing quality control protocols. It provides the theoretical background needed to support practical method implementation. The paper strengthens HPLC’s status as the gold standard in pharmaceutical analysis95.
22. David Ong Cherk Yong et al. (2019) investigated the use of liquid crystalline nanoparticles (LCNs) for the targeted delivery of quercetin in asthma therapy. The study found that LCNs provided a sustained drug release profile and significantly improved the bioavailability of quercetin. They also observed a marked reduction in pro-inflammatory cytokines IL-1β, IL-6, and IL-8, demonstrating the therapeutic potential of the formulation95. While the focus was on drug delivery and pharmacodynamics, the research underscored the need for reliable analytical methods to assess quercetin content during formulation and release studies. Their findings support the use ofnanocarrier systems in pulmonary diseases such as asthma, COPD, and even lung cancer. The study contributes to the growing interest in nano-formulations of plant-based compounds. It bridges the gap between pharmaceutical technology and natural product therapeutics. Accurate HPLC analysis remains essential to track the stability and efficacy of such advanced formulations95.
23. Deepak Kaushik and Sarita Garg (2023) performed a flavonoid profiling of mulberry leaves using an RP-HPLC method. The method utilized UV detection at 259 nm and a C18 column (250 mm × 4.6 mm, 5 µm) for optimal separation of rutin, quercetin, and isoquercetin. The study validated the method for accuracy, precision, repeatability, and linearity. Results confirmed that mulberry leaves are rich in pharmacologically important flavonoids, reinforcing their traditional medicinal use95,96. Their findings provide a solid foundation for quality control and standardization of mulberry-based formulations. The method was efficient and reliable, with excellent recovery rates and reproducible peak shapes. It can be applied in both research and commercial product evaluation. The profiling supports the development of evidence-based herbal therapeutics and supplements. The study contributes to expanding the pharmacopoeial knowledge of plant-based bioactives96.
REFERENCES
3.AIM & OBJECTIVE
HPLC Method Development and Validation of Rutin-Sylimarin and Nano-formulation for Asthma Treatment
The objective of the work was
1. HPLC Method Development:
Develop a precise, accurate, and robust High-Performance Liquid Chromatography (HPLC) method for the simultaneous quantification of rutin and silymarin in their pure form and in combination.Optimize chromatographic parameters such as mobile phase composition, flow rate, detection wavelength, and column type to ensure reliable separation and quantification.Ensure the method is suitable for routine quality control analysis.
2. HPLC Method Validation:
Validate the developed HPLC method according to ICH (International Council for Harmonisation) guidelines, ensuring it meets parameters such as accuracy, precision, specificity, linearity, limit of detection (LOD), limit of quantification (LOQ), and robustness.Demonstrate that the method is reliable for different matrices, including formulations and biological samples.
3. Nanoformulation Analysis:
Characterize the nanoformulations of rutin and silymarin developed for asthma treatment.Evaluate the entrapment efficiency, drug release profile, and stability of the nanoformulations using the validated HPLC method.
4. Application to Asthma Treatment:
Investigate the therapeutic potential of rutin and Silymarin Nano formulations in managing asthma by analyzing key pharmacokinetic parameters and formulation efficacy. Ensure that the method enables monitoring of drug levels in biological samples, facilitating pharmacokinetic and pharmacodynamics studies.
5. Scientific Contribution:
Provide a validated analytical method that supports further research on rutin and Silymarin as potential therapeutic agents for asthma. Contribute to the development of advanced drug delivery systems for enhanced therapeutic outcomes in asthma management
4.PLAN OF WORK
1. Selection of Drugs
Online Journals, chemical and analytical abstracts were studied to find out drugs for which reported methods or the reported methods were observing, many methods were got costly and time consuming. Market survey was carried to check the availability of these drugs.
The criteria for selection of drugs are explained in individual drug profile.
2. Drug: Rutin-Silymarin
3. Selection of analytical techniques:
• HPLC method
4. Plan of Study:
a) Literature Review
• Study existing methods for Rutin-Silymarin estimation in bulk and pharmaceutical formulations.
• Review stability-indicating methods and HPLC method development principles.
• Identify research gaps to design a novel and reliable method.
b) Procurement of Materials
• Obtain Rutin-Silymarin bulk drug and pharmaceutical formulations.
• Procure required chemicals, reagents, solvents (HPLC grade), and reference standards.
• Arrange necessary laboratory consumables (columns, filters, etc.).
c) Optimization of Chromatographic Conditions
• Select appropriate stationary phase (column) based on drug characteristics.
• Optimize the mobile phase composition (e.g., organic solvents, pH, buffers).
• Determine ideal flow rate, detection wavelength, injection volume, and run time.
• Conduct preliminary trials to achieve sharp, symmetrical peaks with good resolution.
d) Forced Degradation Studies
• Expose Rutin-Silymarin to stress conditions as per ICH guidelines:
a. Acidic and basic hydrolysis.
b. Oxidative stress.
c. Thermal degradation.
d. Photolytic degradation.
• Collect and analyze degraded samples to identify and separate degradation products.
e) Method Validation
• Validate the developed method according to ICH Q2(R1) guidelines for:
a. Specificity: Evaluate the method's ability to separate Rutin-Silymarin from impurities and degradation products.
b. Linearity: Determine the concentration range showing a linear response.
c. Accuracy: Perform recovery studies at multiple levels.
d. Precision: Assess repeatability and reproducibility.
e. Sensitivity: Calculate LOD and LOQ.
f. Robustness: Analyze results under small variations in experimental conditions.
g. System Suitability: Verify resolution, peak shape, and other system parameters.
5. DRUG PROFILE
1. RUTIN
Chemical Structure:
• IUPAC Name: 5-[(2R,3R,4S,5S,6R)-3,4-dihydroxy-5-[(2R,3R,4R,5R,6S)-3,4,5-
trihydroxy-6-methyloxan-2-yl]oxy-6-(hydroxymethyl)oxan-2-yl]oxy-2-(3,4- dihydroxyphenyl)-3,5-dihydroxy-4H-chromen-4-one
• Molecular Formula: C27H30O16
• Molecular Weight: 610.52 g/mol
• Structure:
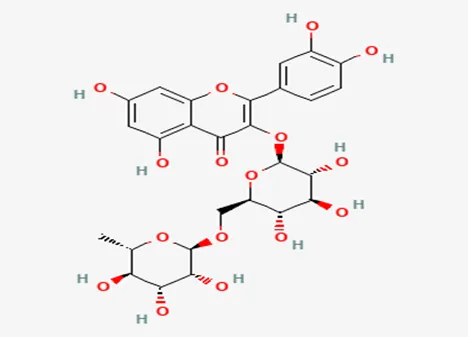
Classification:
• Flavonoid (a glycoside combining the flavonol quercetin and the disaccharide rutinose)
Pharmacological Properties:
• Antioxidant
• Anti-inflammatory
• Capillary stabilizer
• Vasoprotective
• Cytoprotective
• Neuroprotective Therapeutic Uses:
• Treatment of chronic venous insufficiency
• Management of varicose veins
• Hemorrhoids
• Anti-aging and skin repair
• Adjunctive therapy in hypertension and diabetes
Mechanism of Action:
• Scavenges reactive oxygen species (ROS)
• Inhibits lipid peroxidation
• Stabilizes capillary walls
• Modulates inflammatory cytokines
Drug Interactions:
Interacting Drug Effect
Anticoagulants (e.g., warfarin) Potential increase in bleeding risk
Antiplatelet drugs (aspirin, clopidogrel) Enhanced antiplatelet effects
Iron supplements May reduce absorption
Cytochrome P450 substrates Mild inhibition, may alter metabolism of other drugs
Adverse Effects:
• Rare: Allergic reactions, gastrointestinal disturbances
2. SILYMARIN
Chemical Structure:
• Major Component: Silybin (also known as Silibinin)
• IUPAC Name (Silybin): (2R,3R)-3,5,7-trihydroxy-2-[3-(4-hydroxy-3-methoxyphenyl)-2- (hydroxymethyl)-2,3-dihydrobenzofuran-7-yl]chroman-4-one
• Molecular Formula: C25H22O10
• Molecular Weight: 482.44 g/mol
Structure:
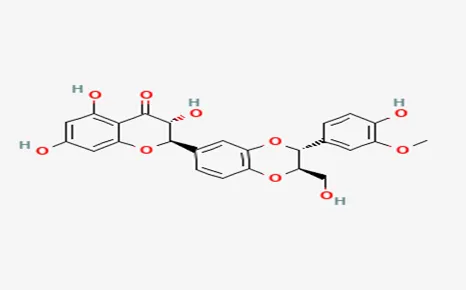
Classification:
• Flavonolignan (derived from milk thistle seeds - Silybum marianum)
Pharmacological Properties:
• Hepatoprotective
• Antioxidant
• Anti-inflammatory
• Antifibrotic
• Cholagogue (promotes bile flow) Therapeutic Uses:
• Treatment of liver diseases (hepatitis, cirrhosis, fatty liver)
• Antidote for mushroom poisoning (Amanita phalloides)
• Used in liver protection during chemotherapy
• Adjunctive therapy in diabetes and hyperlipidaemia
Mechanism of Action:
• Inhibits lipid peroxidation
• Scavenges free radicals
• Stimulates RNA polymerase I, increasing protein synthesis for liver regeneration
• Inhibits TGF-β1 in liver fibrosis
Drug Interactions:
Interacting Drug Effect
CYP450 substrates (especially CYP3A4, CYP2C9)
May inhibit or induce metabolism
Statins May increase serum concentration (due to CYP3A4 interaction)
Oral hypoglycemic May enhance hypoglycemic effects
Alcohol May reduce hepatotoxic effects of alcohol
Adverse Effects:
• Generally well-tolerated
• Mild gastrointestinal discomfort, allergic rash, headache (rare)
6 . MATERIALS AND METHODS
6.1. Materials :
Table 6.1.1. : List of Drug
|
Sr. No. |
Name |
Description |
|
1. |
Rutin |
|
|
2. |
Silymarin |
|
|
3. |
Rutinfloxacin |
|
Table 6.1.2 : List of Chemical
|
Sr.No. |
Name of Chemical |
Molecular Formula |
Properties |
Manufacturer |
|
1. |
Acetonitrile |
C2H3N |
Solvent
BP 76-81.60C |
Merck Life
Science |
|
2. |
Methanol |
CH3OH |
Flammable
Solvent |
Merck Life
Science |
|
3. |
Phosphate Buffer |
KH2PO4 |
White Crystalline
Powder |
S D Fine Chem.
Ltd ,Mumbai |
|
4. |
Ortho phosphoric
acid |
H3PO4 |
For Maintain pH |
Merck Life
Science |
|
5. |
Distilled Water |
H2O |
Universal Solvent, BP 1000C |
In House |
Table 6.1.3 : List of Instrument
|
Sr.No. |
Name of Equipment’s/Instruments |
Model/Specification |
Manufacturer |
|
1 |
HPLC |
Series LC-2030 |
Shimadzu
(Prominence Plus) |
|
Pump |
PU2030 |
||
|
Sample Injection |
Auto Sampler Injection |
||
|
UV Detector |
UV 2030 |
||
|
Software |
Lab Solution |
||
|
2 |
pH Meter |
FP20 |
Mettler Toledo |
|
3 |
Balance |
Digital XSR |
Mettler Toledo |
|
4 |
Sonicator |
UCB-40 |
Rolex |
METHODS:
6.2. Chromatographic condition:
Compounds were separated using Kromasil C8 (4.6mm x 250mm, 5µ particle size) column at 40°C temperature, flow rate 1.00mL/min with an isocratic mobile phase consisting of Buffer and Acetonitrile of ratio 55:30:15 and pH maintained till 4.0 using orthophosphoric acid. Rutinfloxacin and Silymarinetasone Furoate were evaluated by UV detection at 254nm with the injection volume of 30µL and the run time 5 min.
Table 6.2.: Optimized Chromatographic Condition
|
Optimized Chromatographic Condition |
||
|
Mobile Phase (V/V) |
Acetonitrile |
Water |
|
30 |
15 |
|
|
Acetonitrile : Water |
||
|
pH of Aqueous Phase |
4.00 |
|
|
Flow Rate (mL/min) |
1.00 |
|
|
Detection Wavelength (nm) |
254.00 |
|
6.3 Preparation of mobile phase:
Mixed 15 ml of buffer solution and 300 ml acetonitrile. Sonicated with stirring, maintaining the pH to 4.0 using orthophosphoric acid. Degas and filter through a 0.20-micron membrane filter.
0.20-micron membrane filter.
6.4 Preparation of standard solution:
Rutin 10 mg, Silymarin 10 mg, weighed and added in a 50 mL volumetric flask, where they were mixed in 30 mL of mobile phase, sonicated and diluted predetermined volume using mobile phase. Dilute 5 ml of this solution to 100 ml with mobile phase and mix. Further dilute
5 ml of this solution to 10 ml with mobile phase to get 10.0 mg/mL of Rutin 10.0 mg/mL of Silymarin
6.5 Preparation of sample solution:
Accurately weighed about 10 mg of powder (Rutin and Silymarin) was transferred to 100 ml of volumetric flask containing 60ml of Diluent. The sample was dissolved by sonication for 15 mins and volume was made up to the mark with Diluent. The resulting solution was filtered using membrane filter 0.22µ. The filtrate was further diluted appropriately with diluent to get 10 µg/ml of Rutin and 10.0 µg/ml of Silymarin. This diluted sample was then analyzed by HPLC

Figure 6.5: Typical chromatogram of Samples
Results and Trials:
Trial 1
• Mobile phase- 70 ml of Water solution and 30 ml Methanol. pH to 4 using orthophosphoric acid
• Column: Kromasil C18 (100mm x 2.1mm ID, Particle size: 1.7 µm)
• Flow rate- 1.00 ml/min
• Detection wavelength (λmax)- 254nm
• Injection Volume: 20 microliter
• Column temperature: Room temperature
• Retention time: Only one peak was observed.
• Runtime: 20.000 Minutes
• Observation and Conclusion:
Only one peak was observed, Peak properties not match in this chromatographic condition hence peak is rejected.
Trial 1

Fig. 6.6 Chromatogram of RUTIN and SILYMARIN in Methanol : Water (70:30 v/v)
Trial 2
• Mobile phase- 50 ml Water and 50 ml Acetonitrile. (50:50 v/v)
• Column: Kromasil C18 (100mm x 2.1mm ID, Particle size: 1.7 µm)
• Flow rate- 1.00 ml/min
• Detection wavelength (λmax)- 254nm
• Injection Volume: 20 microliter
• Column temperature: Room temperature
• Runtime: 5.00 Minutes
• Retention time (RT): Rutin 5.5 Minutes
• Observation and Conclusion:
Rutin peak observed However poor peak properties of Rutin this chromatographic condition, Poor peak shape and minimum theoretical plates. Poor baseline, Peak properties not match in this chromatographic condition hence peak is rejected.
Trial 2
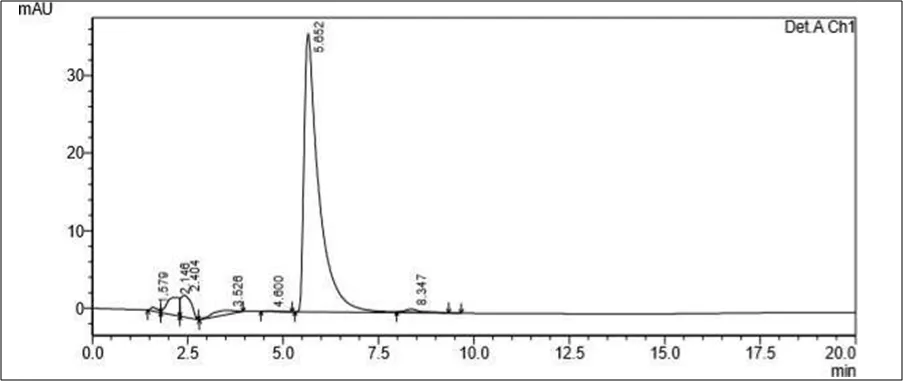
Fig 6.7 Chromatogram of RUTIN and SILYMARIN in Acetonitrile : Water (50:50 v/v)
Trial 3
• Mobile phase- 65 ml of Acetonitrile and 35 ml Water (65:35 v/v) pH was adjusted 4.0.
• Column: Kromasil C18 (100mm x 2.1mm ID, Particle size: 1.7 µm)
• Flow rate- 1.00 ml/min
• Detection wavelength (λmax)- 254nm
• Injection Volume: 20 microliter
• Column temperature: Room temperature
• Runtime: 5.000 Minutes
• Retention time (RT): Rutin- 3.356 Minutes
Silymarin- 5.681 Minutes
• Observation and Conclusion:
Both peak observed, Rutin and Silymarin peaks eluted this chromatographic condition, Poor peak shape and minimum theoretical plates, more retention time as expected,peak tailing and Peak splitting observed. Peak properties not match in this chromatographic condition hence peak is rejected.
Trial 3

Fig 6.8 Chromatogram of RUTIN and SILYMARIN in Acetonitrile: Water (65:35 v/v)
Trial 4
• Mobile phase- 90 ml of Acetonitrile and 10 ml water. Sonicated with stirring, maintaining the pH to 4 using orthophosphoric acid
• Column: Kromacil C18 (100mm x 2.1mm ID, Particle size: 1.7 µm)
• Flow rate- 1.00 ml/min
• Detection wavelength (λmax)- 254nm
• Injection Volume: 20microliter
• Column temperature: Room temperature
• Runtime: 20.000 Minutes
• Retention time (RT): Rutin- 6.50 Minutes
Silymarin-6.865 Minutes
• Observation and Conclusion:
Merge peaks with trailing. More retention time as expected Peak properties not match in this chromatographic condition hence peak is rejected.
Trial 4
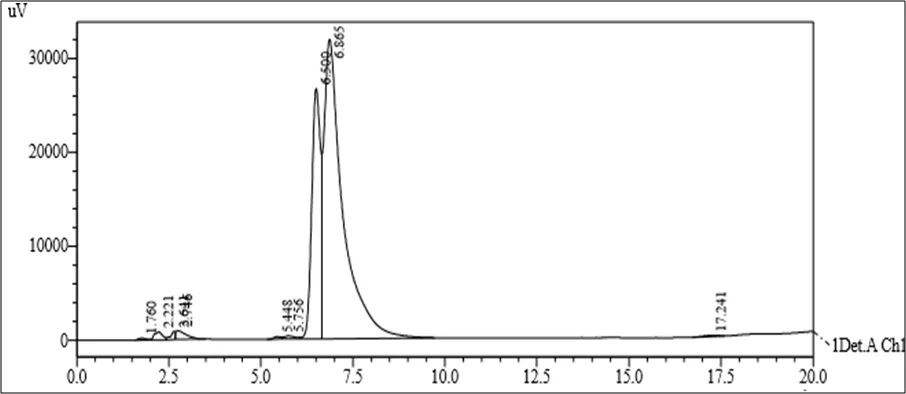
Fig 6.9 Chromatogram of RUTIN and SILYMARIN in Acetonitrile : Water (90:10 v/v)
Trial 5
• Mobile phase- 40 ml of methanol, 50 ml acetonitrile and 10 ml of water. Sonicated with stirring, maintaining the pH to 4.0 using orthophosphoric acid
• Column: Kromasil C18 (100mm x 2.1mm ID, Particle size: 1.7 µm)
• Flow rate- 1.00 ml/min
• Detection wavelength (λmax)- 254nm
• Injection Volume: 20 microliter
• Column temperature: Room temperature
• Runtime: 20.0 Minutes
• Retention time (RT): Rutin- 3.498 Minutes
Silymarin- 4.293 Minutes
• Observation and Conclusion:
Two peaks are observed , but no good resolution is found.
Trial 5
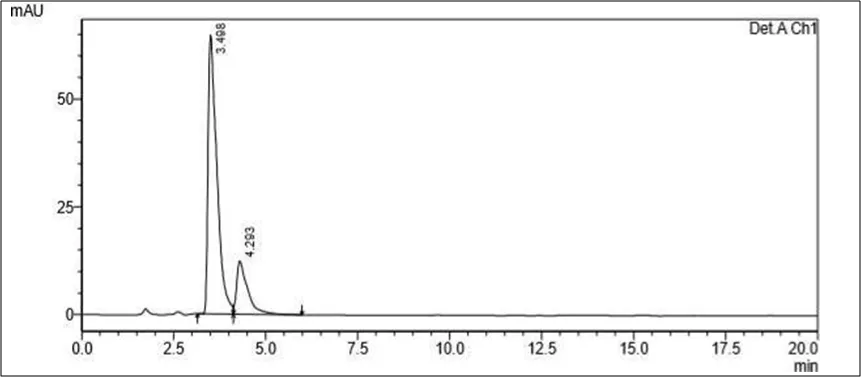
Fig 6.10 Chromatogram of RUTIN and SILYMARIN in Methanol: Acetonitrile:
Water (40:50:10 v/v)
Trial 6
• Mobile phase- 50 ml of methanol , 40 ml acetonitrile and 10 ml of water. Sonicated with stirring, maintaining the pH to 4.0 using orthophosphoric acid
• Column: Kromasil C18 (100mm x 2.1mm ID, Particle size: 1.7 µm)
• Flow rate- 1.00 ml/min
• Detection wavelength (λmax)- 254nm
• Injection Volume: 20 microliter
• Column temperature: Room temperature
• Runtime: 20.0 Minutes
• Retention time (RT): Rutin- 3.517 Minutes
Silymarin- 4.301 Minutes
• Observation and Conclusion:
Two peaks are observed, but no good resolution is found.
Trial 6

Fig 6.11 Chromatogram of RUTIN and SILYMARIN in Methanol : Acetonitrile : Water
(50:40:10 v/v)
Trial 7
• Mobile phase- 45ml of methanol, 25ml acetonitrile and 30 ml of water. Sonicated with stirring, maintaining the pH to 4.0 using orthophosphoric acid
• Column: Kromasil C18 (100mm x 2.1mm ID, Particle size: 1.7 µm)
• Flow rate- 1.00 ml/min
• Detection wavelength (λmax)- 254nm
• Injection Volume: 20 microliter
• Column temperature: Room temperature
• Runtime: 20.0 Minutes
• Retention time (RT): Rutin- 4.125 Minutes
Silymarin- 6.915 Minutes
• Observation and Conclusion:
Two Peak was Observed but tailing was 2.391 and 2.413
& RT was 4.126 and 6.916 so it doesn’t match the chromatographic conditions.
Trial 7
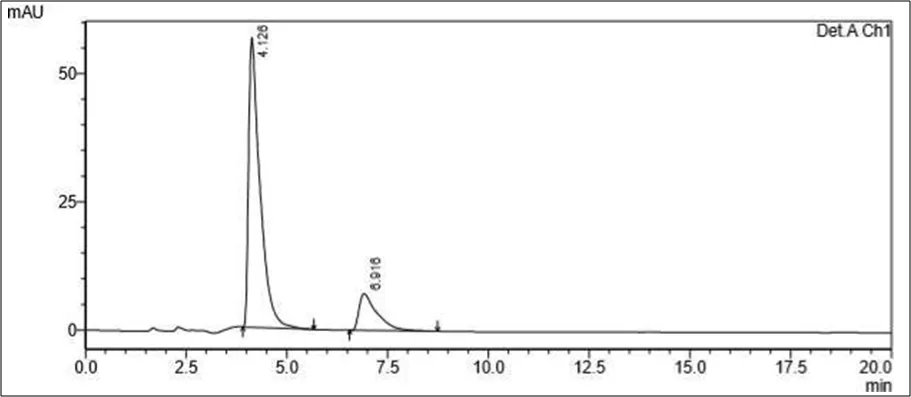
Fig 6.12 Chromatogram of RUTIN and SILYMARIN in Methanol : Acetonitrile : Water
Trial 8
• Mobile phase- 45ml of methanol , 35ml acetonitrile and 20 ml of water. Sonicated with stirring, maintaining the pH to 4.0 using orthophosphoric acid
• Column: Kromasil C18 (100mm x 2.1mm ID, Particle size: 1.7 µm)
• Flow rate- 1.00 ml/min
• Detection wavelength (λmax)- 254nm
• Injection Volume: 20 microliter
• Column temperature: Room temperature
• Runtime: 10.0 Minutes
• Retention time (RT): Rutin- 4.178 Minutes
Silymarin- 7.054 Minutes
• Observation and Conclusion:
Two Peak was Observed but tailing was 2.369 and 2.437
& RT was 4.178 and 7.054
Trial 8
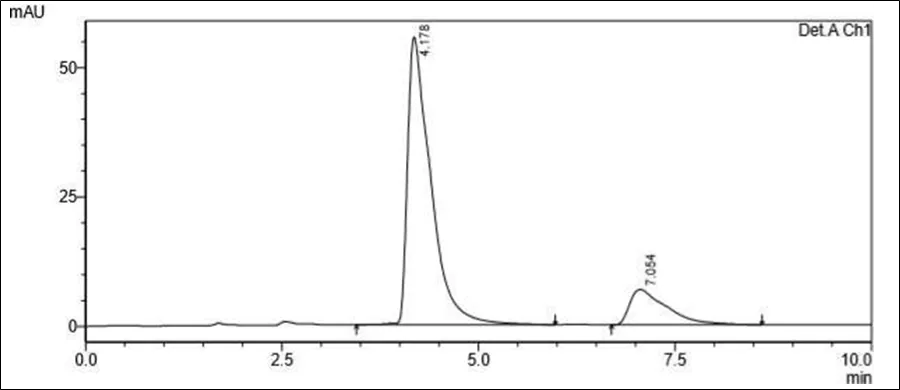
Fig 6.13 Chromatogram of RUTIN and SILYMARIN in Methanol Acetonitrile: Water (adjust to pH 4 with OPA) (45:35:20 v/v)
Trial 9
• Mobile phase- 55 ml of methanol, 30 ml acetonitrile and 15 ml of water. Sonicated with stirring, maintaining the pH to 4.0 using orthophosphoric acid
• Column: Kromasil C18 (100mm x 2.1mm ID, Particle size: 1.7 µm)
• Flow rate- 1.00 ml/min
• Detection wavelength (λmax)- 254nm
• Injection Volume: 20 microliter
• Column temperature: Room temperature
• Runtime: 10.0 Minutes
• Retention time (RT): Rutin- 3.845 Minutes
Silymarin- 5.375 Minutes
• Observation and Conclusion:
Two Peak was Observed but tailing was 2.364 and 2.491
& RT was 3.846 and 5.375
Trial 9

Fig 6.14 Chromatogram of RUTIN and SILYMARIN in Methanol: Acetonitrile : Water
(55:30:15 v/v)
Trial 10 (Optimised Chromatogram)
• Mobile phase- 55 ml of methanol, 30 ml acetonitrile and 15 ml of water. Sonicated with stirring, maintaining the pH to 4.0 using orthophosphoric acid
• Column: Kromasil C18 (100mm x 2.1mm ID, Particle size: 1.7 µm)
• Flow rate- 1.00 ml/min
• Detection wavelength (λmax)- 254nm
• Injection Volume: 20 microliter
• Column temperature: Room temperature
• Runtime: 10.0 Minutes
• Retention time (RT): Rutin- 3.870 Minutes
Silymarin- 5.377Minutes
• Observation and Conclusion:
Two Peak was Observed Tailing was 1.644 and 1.610
RT was 3.870 and 5.377
Trial 10
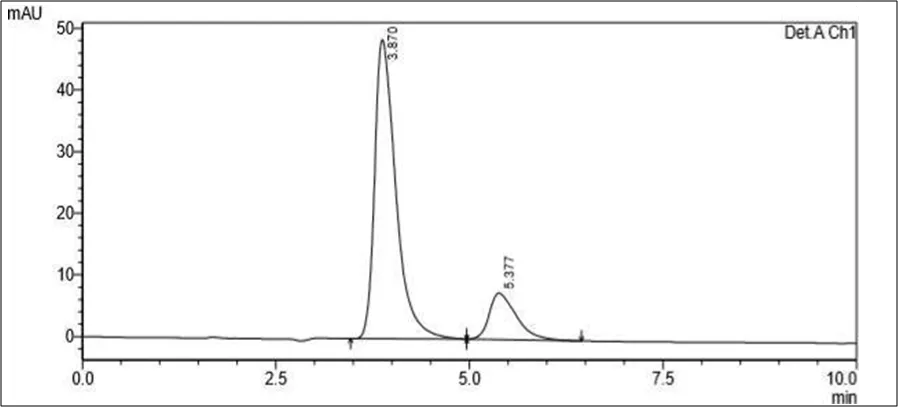
Fig 6.15 Chromatogram of RUTIN and SILYMARIN in Methanol: Acetonitrile: Water (adjust to pH 4 with OPA) (55:30:15 v/v)
Confirmation of Mobile Phase:
Confirmation-1 (RUTINFLOXACIN)

Fig 6.16 Chromatogram of Confirmation of RUTINFLOXACIN in Methanol: Acetonitrile: Water (pH 4 adjusted with OPA (55:30:15 v/v)
Confirmation-2 (SILYMARINETASONE FUROATE)
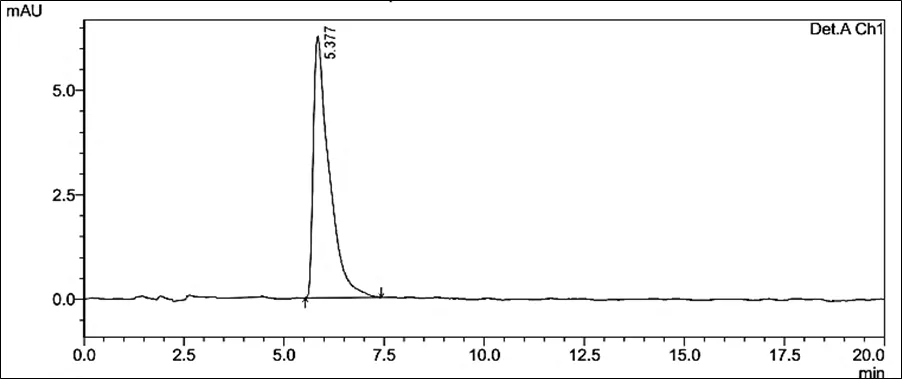
Fig 6.17 Chromatogram of Confirmation of SILYMARINETASONE FUROATE in Methanol: Acetonitrile : Water (pH 4 adjusted with OPA (55:30:15 v/v)
7. Method Validation
1. System Suitability Data
Table No. 7.1 System Suitability data for RUTIN and SILYMARIN
|
Drugs |
Parameters |
Mean ± S.D. (n=6) |
%R.S.D |
|
RUTIN |
Retention Time |
3.780 ± 0.0087 |
0.2468 |
|
Theoretical Plate |
6786.15 ± 89.671 |
0.2206 |
|
|
Tailing Factor |
1.644 ± 0.0115 |
0.9077 |
|
|
SILYM ARIN |
Retention Time |
5.175 ± 0.0052 |
0.1207 |
|
Theoretical Plate |
7395.49 ± 79.197 |
0.1574 |
|
|
Tailing Factor |
1.610 ± 0.0100 |
0.6783 |
|
|
|
Resolution |
2.550 ± 0.0045 |
0.1022 |
2. Specificity
The specificity of the method was determined by analyzing standard drugs and sample of RUTIN and SILYMARIN. The results suggested that proposed method is specific, the excipients present in the synthetic mixture does not affect the result. The chromatogram taken by running only with the mobile phase, placebo and after injection of the sample are given in figures below.
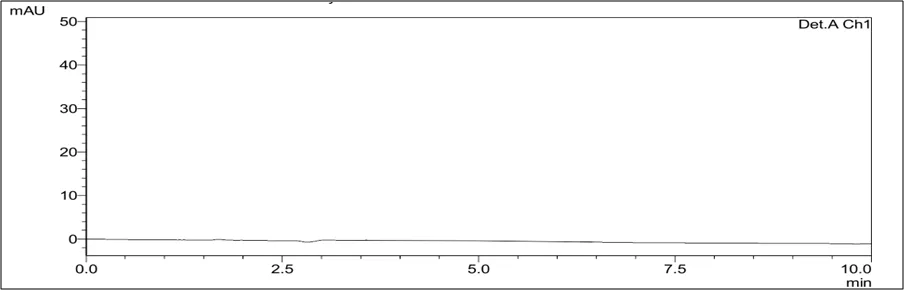
Fig. 7.11 Chromatogram of Placebo
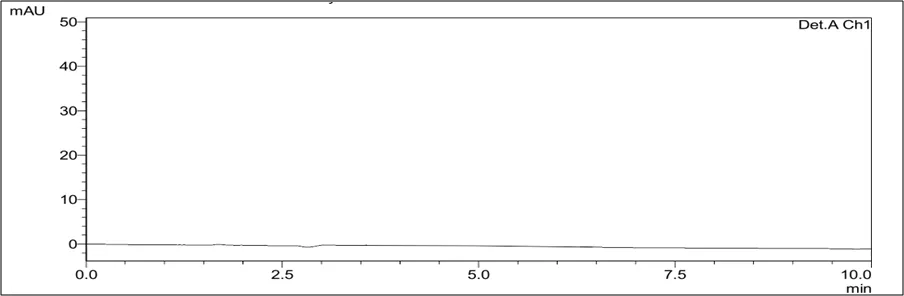
Fig. 7.12 Chromatogram of Mobile Phase
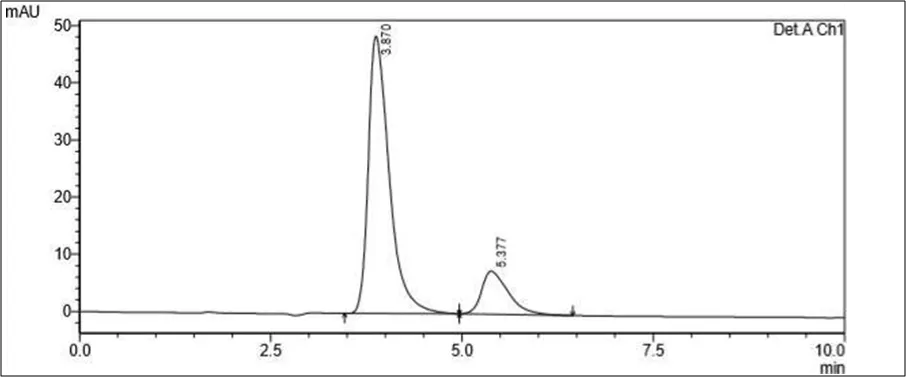
Fig. 7.13 Chromatogram of sample
3. Linearity
The linearity study was carried out for both drugs at five different concentration levels. The linearity of RUTIN and SILYMARIN was in the range of 50 - 130 µg/ml and 5 - 13 µg/ml are depicted in table no. 7.5 and 7.6
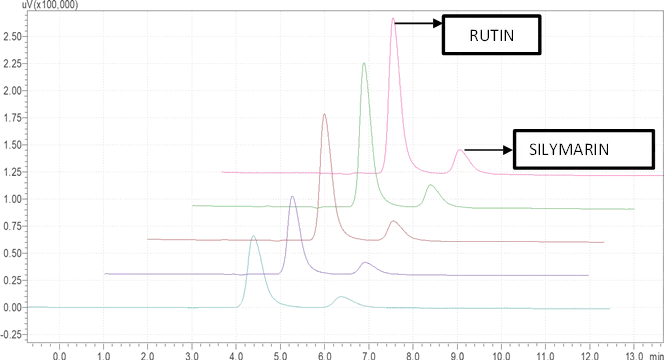
Fig. 7.14 Overlain Chromatogram of RUTIN (50-130 µg/ml) and SILYMARIN (5-13 µg/ml)
Table No. 7.2 Linearity data of RUTIN
|
Sr. No. |
Concentration (µg/ml) |
Mean Peak Area ± S.D. (n=5) |
% R.S.D. |
|
1. |
50 |
378643 ± 2488.40 |
0.6571 |
|
2. |
70 |
711128 ± 1414.53 |
0.1989 |
|
3. |
90 |
986759 ± 5166.08 |
0.5235 |
|
4. |
110 |
1306805 ± 2048.95 |
0.1567 |
|
5. |
130 |
1592443 ± 3716.39 |
0.2333 |
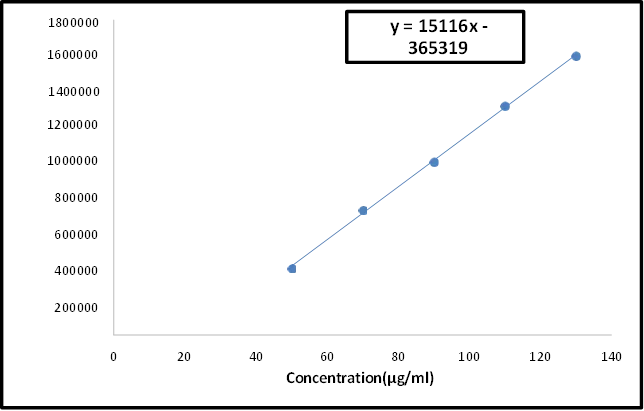
Fig 7.15 Calibration curve of RUTIN
Table No. 7.3 Linearity data of SILYMARIN
|
Sr. No. |
Concentration (µg/ml) |
Mean Peak Area ± S.D. (n=5) |
% R.S.D. |
|
1. |
5 |
77455 ± 392.45 |
0.5066 |
|
2. |
7 |
184730 ± 1683.09 |
0.9111 |
|
3. |
9 |
298224 ± 1367.49 |
0.4585 |
|
4. |
11 |
391202 ± 2664.45 |
0.6810 |
|
5. |
13 |
501897 ± 601.11 |
0.1197 |
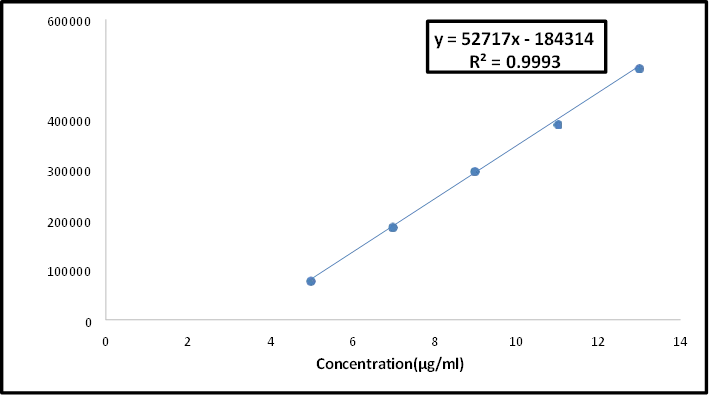
Fig 7.16 Calibration curve of SILYMARIN
4. Precision
a) Repeatability
The data of repeatability for RUTIN and SILYMARIN are depicted in table no. 7.7
Table No. 7.4 Repeatability data for RUTIN and SILYMARIN
|
Drugs |
Concentration (µg/ml) |
Mean Peak Area ± S.D. (n=6) |
% R.S.D. |
|
RUTIN |
90 |
986169 ± 4894.63 |
0.4963 |
|
SILYMARIN |
90 |
296424 ± 3963.30 |
1.3279 |
b) Intraday Precision
The data for intraday precision for RUTIN and SILYMARIN are depicted in the table no. 7.8
Table No. 7.5 Intraday precision for RUTIN and SILYMARIN
|
Drugs |
Concentration (µg/ml) |
Mean Peak Area ± S.D. (n=3) |
%R.S.D. |
|
RUTIN |
70 |
735348 ± 2377.23 |
0.3232 |
|
90 |
985468 ± 6784.12 |
0.6884 |
|
|
110 |
1315436 ± 1825.69 |
0.1387 |
|
|
SILYMA RIN |
7 |
184323 ± 1528.50 |
0.8293 |
|
9 |
298192 ± 1651.40 |
0.5538 |
|
|
11 |
387698 ± 2730.10 |
0.7042 |
c) Interday Precision
The data for interday precision for RUTIN and SILYMARIN are depicted in the table no. 7.9
Table No. 7.6 Interday precision for RUTIN and SILYMARIN
|
Drugs |
Concentration (µg/ml) |
Mean Peak Area ± S.D. (n=3) |
%R.S.D. |
|
RUTIN |
70 |
715985 ± 3576.63 |
0.4995 |
|
|
90 |
984512.3 ± 7875.14 |
0.7999 |
|
|
110 |
1313460 ± 7171.47 |
0.5459 |
|
SILYMARIN |
7 |
77078.7 ± 867.53 |
1.1255 |
|
|
9 |
295933 ± 5472.16 |
1.8491 |
|
|
11 |
391930 ± 3688.27 |
0.9410 |
5. Accuracy
The % Recovery study was performed by the Standard Addition Method. Known amounts of standard solutions of RUTIN and SILYMARIN were added at 80%, 100% and 120% level to pre-quantified sample solutions of RUTIN (50 µg/ml) and SILYMARIN (5 µg/ml). The amounts of RUTIN and SILYMARIN were estimated by using regression equation of the calibration curve. The low value of standard deviation indicates that the proposed method is accurate. Results of recovery studies are shown in table no. 7.10
Table No. 7.7 Accuracy data for RUTIN and SILYMARIN
|
Drug |
Level |
Amount of sample (µg/ml) |
Amount of std spiked (µg/ml) |
Total amount |
Mean Peak Area ± S.D. (n=3) |
Amount of sample found (µg/ml) |
Mean % Recovery ± S.D. (n=3) |
|
RUTIN |
0 |
50 |
0 |
50 |
398760 ±1731.06 |
49.66 |
99.32 |
|
80 |
50 |
40 |
90 |
988244 ±1661.80 |
89.14 |
99.04 |
|
|
100 |
50 |
50 |
100 |
1186142±3151.60 |
100.45 |
100.45 |
|
|
120 |
50 |
60 |
110 |
1317490 1028.99 |
111.19 |
101.08 |
|
|
SILYM ARIN |
0 |
5 |
0 |
5 |
77608 ± 385.27 |
4.96 |
99.20 |
|
80 |
5 |
4 |
9 |
298040 ±1900.14 |
9.15 |
101.66 |
|
|
100 |
5 |
5 |
10 |
347063 ±3910.81 |
10.08 |
100.80 |
|
|
120 |
5 |
6 |
11 |
392038 ±2894.58 |
10.93 |
99.36 |
6. LOD and LOQ
The LOD for RUTIN and SILYMARIN was found to be 5.1686 µg/ml and 0.1053 µg/ml respectively.
The LOQ for RUTIN and SILYMARIN was found to be 15.6626 µg/ml and 0.3191 µg/ml respectively.
7. Robustness
The robustness of the method was established by making deliberate minor variations in the following method parameters.
• Flow rate: ± 0.2 units
• Mobile Phase Ratio: ± 2.0
Table No. 7.8 Robustness data for RUTIN
|
Parameters |
Level |
Mean Peak Area ± S.D. (n=3) |
%R.S.D. |
Rt ± S.D. (n=3) |
%R.S.D. |
|
Mobile Phase (50:35:15 v/v) |
52:33:15 v/v |
416243 ± 2564.30 |
0.3625 |
2.780 ± 0.0090 |
0.3257 |
|
48:37:15 v/v |
349658 ± 2588.90 |
0.4022 |
3.997 ± 0.0156 |
0.4049 |
|
|
Flow rate (1.0 ml/min) |
0.8 ml/min |
396834 ± 533.88 |
0.1812 |
4.247 ± 0.0100 |
0.2359 |
|
|
1.2 ml/min |
359656 ± 496.94 |
0.1954 |
3.316 ± 0.0060 |
0.1820 |
Table No. 7.9 Robustness data for SILYMARIN
|
Parameters |
Level |
Mean Peak Area ± S.D. (n=3) |
%R.S.D. |
Rt ± S.D. (n=3) |
%R.S.D. |
|
Mobile Phase (50:35:15 v/v) |
52:33:15 v/v |
79495 ± 499.63 |
0.3696 |
5.420 ± 0.0087 |
0.4560 |
|
48:37:15 v/v |
75235 ± 384.26 |
0.4126 |
5.195 ± 0.0139 |
0.3985 |
|
|
Flow rate (1.0 ml/min) |
0.8 ml/min |
78655 ± 429.63 |
0.2559 |
5.424 ± 0.0065 |
0.2650 |
|
1.2 ml/min |
76854 ± 533.69 |
0.2986 |
5.490 ± 0.0050 |
0.1985 |
8. Applicability of proposed method
Table No. 7.10 Determination of Assay of RUTIN and SILYMARIN
|
RUTINREST-M CREAM |
Amount taken (µg/ml) |
Amount Obtained (µg/ml) |
% RUTIN ± S.D. (n=3) |
% SILYMARIN ± S.D. (n=3) |
||
|
90 |
9 |
89.19 |
8.98 |
99.12 ± 1423.30 |
99.77± 1956.45 |
|
RESULT AND DISCUSSION
8.1 SELECTION OF ELUTION MODE
Reverse phase chromatography was chosen because of the recommended use for ionic and moderate to non-polar compound. Reverse phase chromatography is not only simple, convenient but also better in terms of efficiency, stability and reproducibility. C18 column was selected because it is least polar compound to C4 and C8 column. C18 column allows elution of polar compound. In addition to this, UV detector is used, which allows easy detection of the compounds in UV transparent organic solvents. A 250mm × 4.6mm column packed with 5µm particles was preferred as a starting point for method development. Isocratic mode was chosen due to simplicity in application and robustness with respect to longer column stability. This configuration provides a large value for the number of theoretical plates giving better separation.
8.2 SELECTION OF WAVELENGTH
Both the drugs showed good absorbance at 254nm so it was selected for estimation of
RUTIN and SILYMARIN.
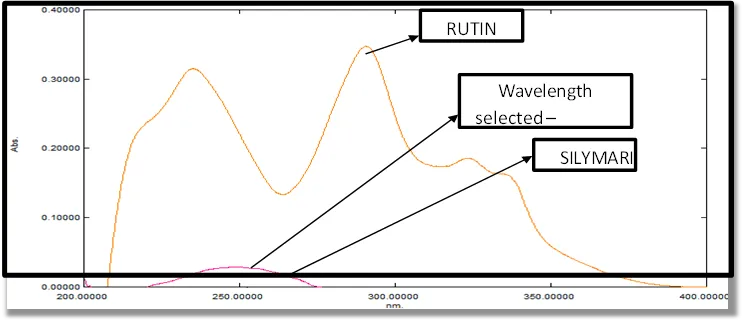
Fig. 8.1 Overlay UV spectrum of RUTIN and SILYMARIN showing selection of wavelength
detection
8.3 SELECTION OF MOBILE PHASE
The mobile phase should be sufficiently transparent at the detection of wavelength. Methanol, acetonitrile and water (pH4 adjusted with orthophosphoric acid) are the solvent used for mobile phase provided optimum polarity for proper separation and resolution for Rutinfloxacin and Silymarinetasone Furoate.
The ratio selected is Methanol: Acetonitrile and water (pH4 adjusted with orthophosphoric acid) 55:30:15 v/v/v.
8.4 HPLC Trials for selection of mobile phase
Table No. 8.4 HPLC Trials for selection of mobile phase:
|
No of Trials |
Mobile Phase |
Observation |
|
Trial 1 |
Methanol : water (70:30 v/v) |
Only one peak was observed |
|
Trial 2 |
Acetonitrile : water (50:50 v/v) |
Two peak was observed But not satisfactory |
|
Trial 3 |
Acetonitrile : water (65:35 v/v) |
Two peak was observed But not satisfactory |
|
Trial 4 |
Acetonitrile : Water (90:10 v/v) |
Merge peaks with tailing |
|
Trial 5 |
Methanol : Acetonitrile : Water (40:50:10 v/v) |
Two peak was observed But no good resolution |
|
Trial 6 |
Methanol : Acetonitrile : Water (50:40:10 v/v) |
Two peak was observed But no good resolution |
|
Trial 7 |
Methanol : Acetonitrile : Water (45:35:20 v/v) |
Two Peak was Observed but tailing was 2.391 and 2.413 & RT was 4.126 and 6.916 |
|
Trial 8 |
Methanol : Acetonitrile : Water(pH 4 adjusted with OPA (45:35:20 v/v) |
Two Peak was Observed but tailing was 2.369 and 2.437 & RT was 4.178 and 7.054 |
|
Trial 9 |
Methanol : Acetonitrile : Water (55:30:15 v/v) |
Two Peak was Observed but tailing was 2.364 and 2.491 & RT was 3.846 and 5.375 |
|
Trial 10 |
Methanol : Acetonitrile : Water(pH 4 adjusted with OPA (55:30:15 v/v) |
Two Peak was Observed Tailing was 1.644 and 1.610 RT was 3.870 and 5.377 |
Trial 1
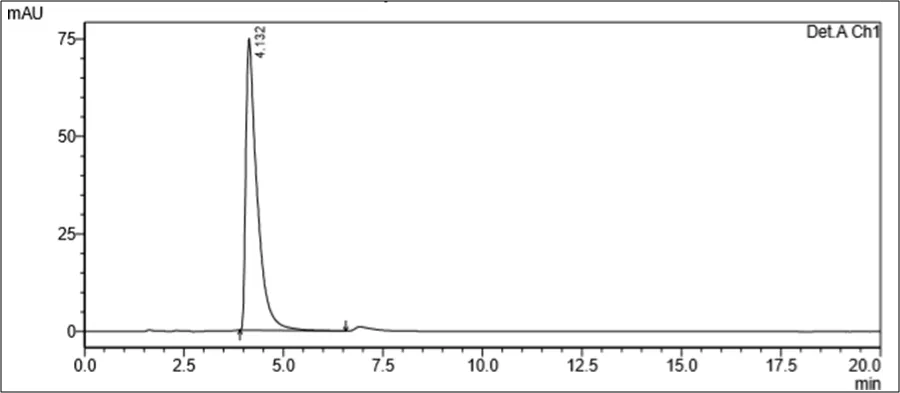
Fig. 8.2 Chromatogram of RUTIN and SILYMARIN in Methanol : Water (70:30 v/v)
Trial 2

Fig 8.3 Chromatogram of RUTIN and SILYMARIN in Acetonitrile : Water (50:50 v/v)
Trial 3
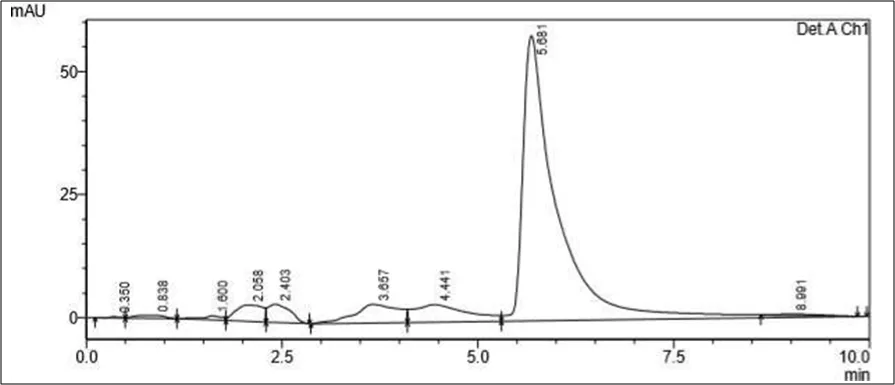
Fig 8.4 Chromatogram of RUTIN and SILYMARIN in Acetonitrile : Water (65:35 v/v)
Trial 4
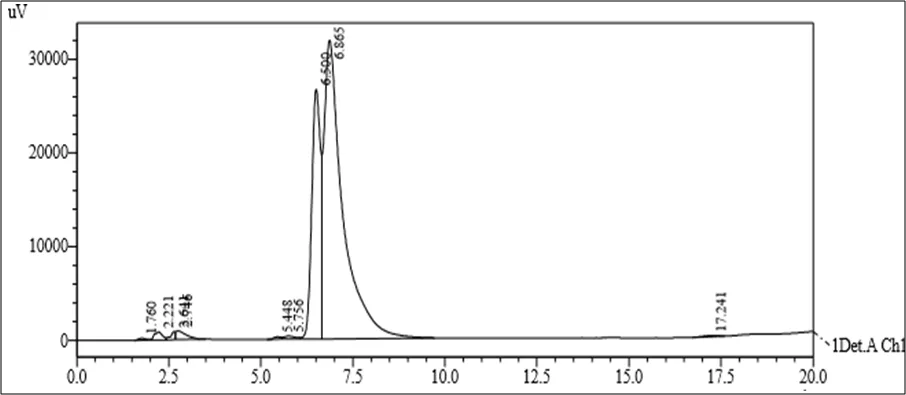
Fig 8.5 Chromatogram of RUTIN and SILYMARIN in Acetonitrile : Water (90:10 v/v)
Trial 5
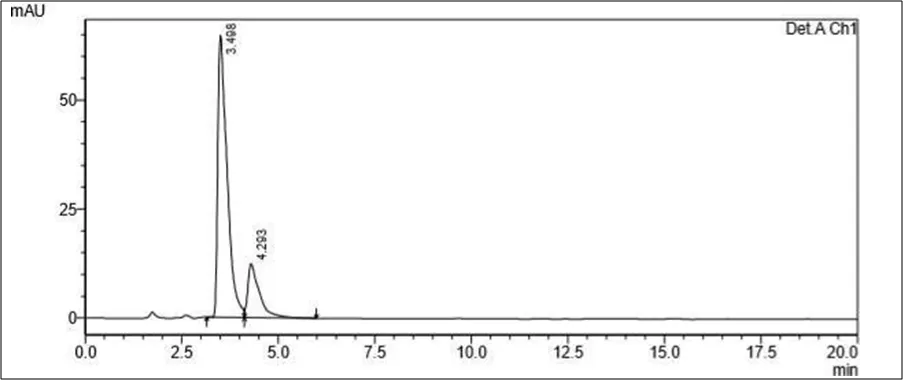
Fig 8.6 Chromatogram of RUTIN and SILYMARIN in Methanol : Acetonitrile : Water
(40:50:10 v/v)
Trial 6
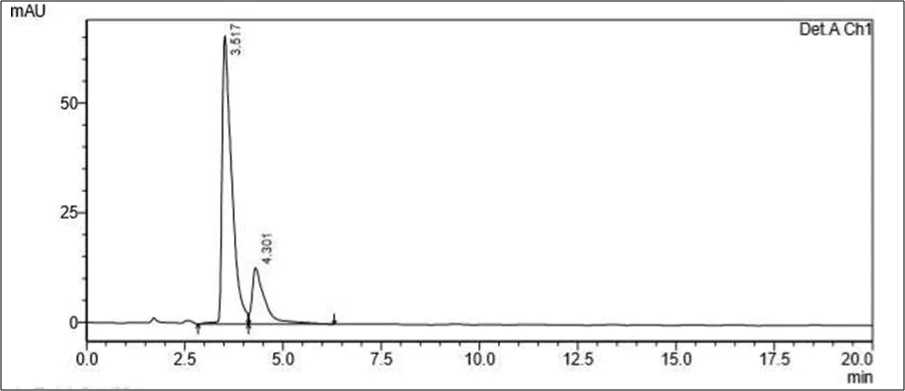
Fig 8.7 Chromatogram of RUTIN and SILYMARIN in Methanol : Acetonitrile : Water
(50:40:10 v/v)
Trial 7
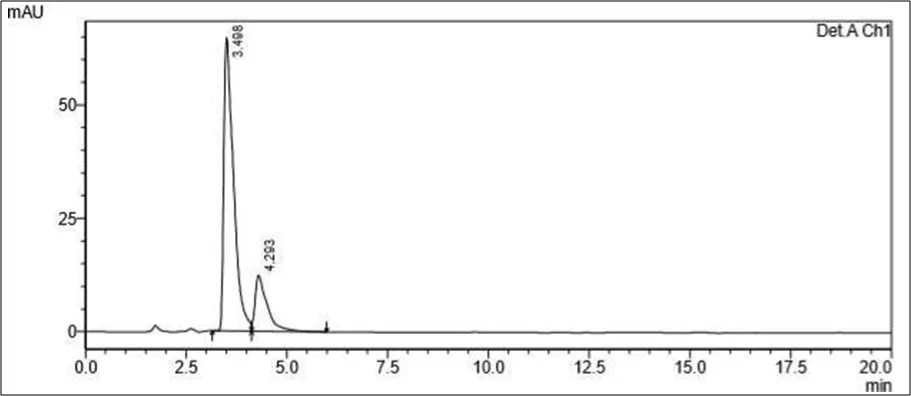
Fig 8.8 Chromatogram of RUTIN and SILYMARIN in Methanol : Acetonitrile :
Water (45:35:20 v/v)
Trial 8
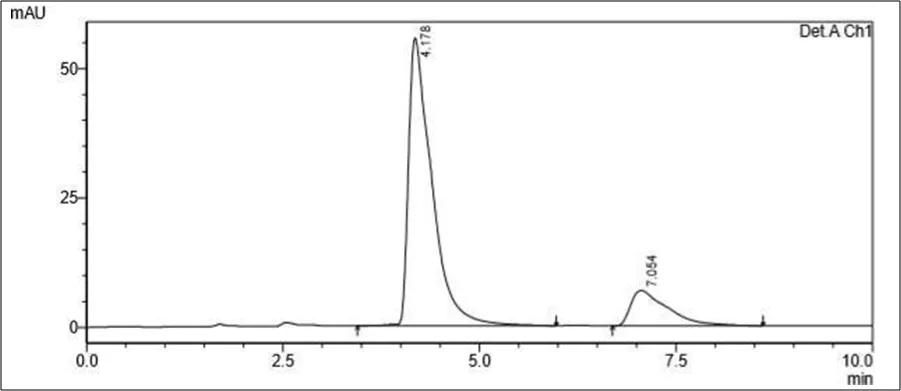
Fig 8.9 Chromatogram of RUTIN and SILYMARIN in Methanol : Acetonitrile : Water (adjust to pH 4 with OPA) (45:35:20 v/v)
Trial 9
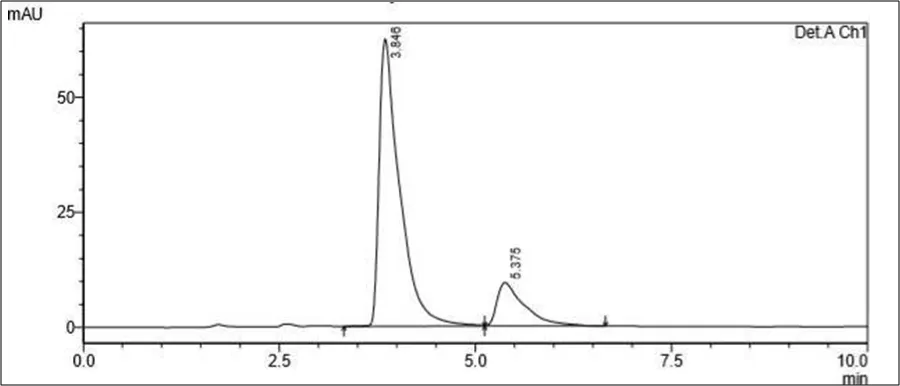
Fig 8.10 Chromatogram of RUTIN and SILYMARIN in Methanol : Acetonitrile :
Water (55:30:15 v/v)
Trial 10

Fig 8.11 Chromatogram of RUTIN and SILYMARIN in Methanol : Acetonitrile : Water (adjust to pH 4 with OPA) (55:30:15 v/v)
Confirmation-1 (RUTINFLOXACIN)
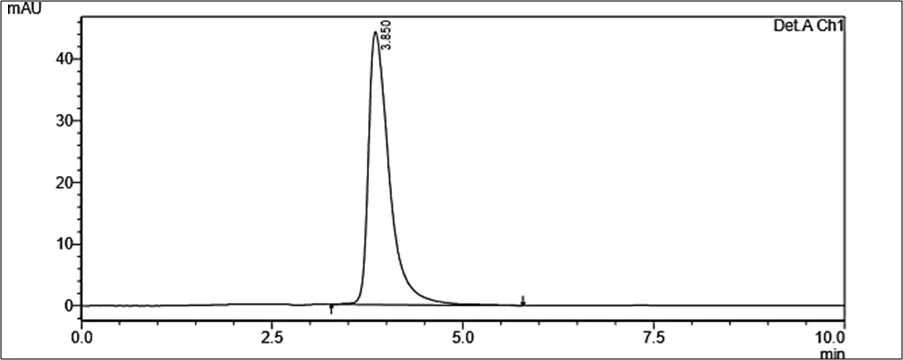
Fig 8.12 Chromatogram of Confirmation of RUTINFLOXACIN in Methanol : Acetonitrile: Water (pH 4 adjusted with OPA (55:30:15 v/v)
Confirmation-2 (SILYMARINETASONE FUROATE)
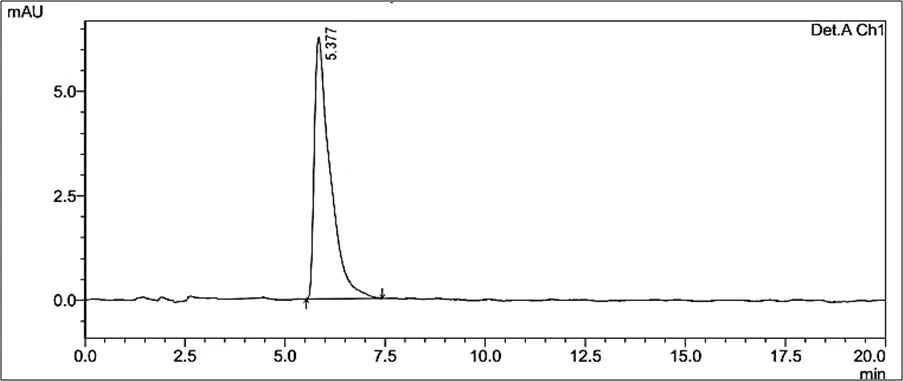
Fig 8.13 Chromatogram of Confirmation of SILYMARINETASONE FUROATE in Methanol : Acetonitrile : Water (pH 4 adjusted with OPA (55:30:15 v/v)
Marketed formulation (RUTINREST-M CREAM)
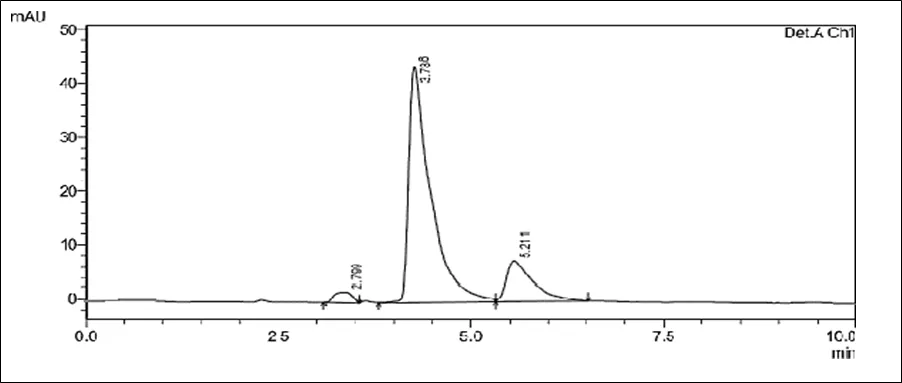
Fig 8.14 Chromatogram of Marketed formulation (Cream) in Methanol: Acetonitrile: Water (adjust to pH 4 with OPA) (55:30:15 v/
DISCUSSION
9. SUMMARY
Table No. 9.1 Summary of RP-HPLC method
|
Parameters |
RUTIN |
SILYMARIN |
|
Linearity (µg/ml) (n=5) |
50-130 µg/ml |
5-13 µg/ml |
|
Regression Equation |
y = 15116x - 365319 |
y = 52717x – 184314 |
|
Regression coefficient (R2) |
0.9992 |
0.9993 |
|
Correlation coefficient (r) |
0.9995 |
0.9996 |
|
Repeatability (%R.S.D.) (n=6) |
0.4963 |
1.3279 |
|
Intraday precision (%R.S.D.) (n=3) |
0.1387-0.6884 |
0.5538-0.82933 |
|
Interday precision (%R.S.D.) (n=3) |
0.4995-0.7999 |
0.9410-1.8491 |
|
LOD (µg/ml) (n=5) |
5.1686 µg/ml |
0.1053 µg/ml |
|
LOQ (µg/ml) (n=5) |
15.6626 µg/ml |
0.3191 µg/ml |
|
% Recovery (n=3) |
99.04-101.08 |
99.20-101.66 |
SUMMARY:
The content of thesis have been divided into nine chapters and appropriate references have been placed after the 9th chapter.
Analytical method was developed and validated by RP-HPLC for the simultaneous estimation of Rutin And Silymarin in Pharmaceutical Formulation.
• Optimized and Developed method for Chromatography.
• Chromatographic method was Validated for Linearity, Accuracy, Interday and Intraday Precision , Specificity and Sensitivity and Robustness.
• All the developed methods were successfully applied to determine the drugs in Pharmaceutical Preparation.
CONCLUSION
In present research work separation of Rutin and Silymarin was carried out in less than 20.00 min to 10.00min run time by using simple chromatographic conditions at ambient temperature using two component mobile phase Sodium Phosphate Buffer : Methanol: Acetonitrile: Water (55:30:15 v/v/v) pH adjusted to 4 with orthophosphoric acid at 254 nm. System Suitability parameters showed that the method is appropriate and found to be satisfactory the estimation of Rutin and Silymarin in Syrup dosage form. The HPLC method was validated as per ICH guidelines for Specificity, Linearity, Precision, Accuracy, Robustness, Ruggedness, LOQ and LOD . All the validation parameters were found to be well within the acceptable limit. The assessment of robustness and ruggedness of the method indicates that the method remains unaffected by slight changes in chromatographic conditions. Hence, method can be used for the routine analysis of Rutin and Silymarin in bulk and may in type of dosage form.
REFERENCES
Cherk Yong, D. O., Saker, S. R., Wadhwa, R., Chellappan, D. K., Madheswaran, T., Panneerselvam, J., Tambuwala, M. M., Bakshi, H. A., Kumar, P., Pillay, V., Gupta, G., Oliver, B. G., Wark, P., Hsu, A., Hansbro, P. M., Dua, K., & Zeeshan, F. (2019). Preparation,haracterization and in-vitro efficacy of quercetin loaded liquid crystalline nanoparticles for the treatment of asthma. Journal of Drug Delivery Science and Technology, 54.
10969888c, 2008, 7, Downloaded from
(2010).

Pharate Snehal, M. Mohite, P. Kale HPLC Method Development and Validation of Rutin-Sylimarin and Nano-Formulation for Asthma Treatment, Int. J. of Pharm. Sci., 2026, Vol 4, Issue 6, 4583-4634, https://doi.org/10.5281/zenodo.20747977
 10.5281/zenodo.20747977