
We use cookies to ensure our website works properly and to personalise your experience. Cookies policy
Nimra College of Pharmacy, Jupudi, Ibrahimpatnam, NTR-521456.
The first reversed-phase high-performance liquid chromatographic method for simultaneous determination of canagliflozin and metformin has been developed and validated to be a simple, sensitive, rapid, specific, precise, and accurate method. Chromatographic separation was achieved on a C18 column (250×4.6 mm-5 ?m p.s.). 0.01 M ammonium acetate buffer (pH adjusted to 3.5 with orthophosphoric acid) and acetonitrile (65:35, v/v) as a mobile phase at a flow rate of 1 mL/min. UV detection was operated at 254 nm, and injection volume was 20 ?l. The proposed method showed good linearity, accuracy, and precision and was successfully applied for the determination of the drugs in laboratory-prepared pharmaceutical dosage forms.The current method has been statistically validated according to the ICH guidelines, and this method has been subsequently developed and applied successfully to determine the levels of metformin hydrochloride and canagliflozin in a combined formulation and in the routine quality control analysis with good accuracy and sensitivity.
On March 29, 2013, the FDA authorized canagliflozin, making it the country's first sodium glucose co-transportor 2 (SGLT2) inhibitor. For individuals with type 2 diabetes mellitus, canagliflozin is recommended as a supplement to diet and exercise to improve glycemic control. Canagliflozin should not be used to treat diabetic ketoacidosis or in people with type 1 diabetes mellitus. In 1950, French physician Jean Sterne started studying metformin in humans after it was discovered in 1922. Metformin is mostly used to treat type-2 diabetes, however its usage in polycystic ovarian syndrome is growing. Diarrhea, nausea, and abdominal pain are common adverse effects of metformin, which is normally well tolerated. The first-line treatment for type-2 diabetes is metformin, which is sold under the trade name Glucophage. By specifically blocking renal sodium-glucose transporter 2 (SGLT2), canagliflozin increases the excretion of glucose in the urine. This mode of action is independent of insulin and may be used in conjunction with other oral antidiabetic medications.
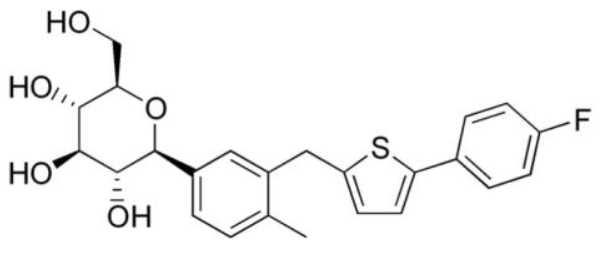
Fig 1: Structure of Canagliflozin.
SGLT2, which is responsible for over 90% of renal glucose reabsorption, is inhibited by canagliflozin. As a result, the amount of glucose that is filtered through the glomeruli and enters the tubular lumen determines how effective this medication is. As a result, it works best in individuals with uncontrolled type 2 diabetes. In addition to lowering blood glucose, it has numerous additional positive effects, such as lowering glycosylated hemoglobin levels as a result of improved blood glucose regulation. Additionally, it increased the liver's sensitivity to insulin by lowering blood glucose levels, which in turn decreased the liver's synthesis of glucose. In T2DM patients, this lowers the body's overall gluco-toxic condition and aids in lowering serum insulin levels. Patients using this medication have a negative energy balance and weight loss as a result of the calories being expelled from their bodies in the form of glucose in their urine, which is advantageous for T2DM patients once more. Because of its diuretic impact and slight weight loss, this medication also lowers blood pressure. Because it causes minor weight reduction, it also has a favorable effect on blood lipids.
A collection of metabolic disorders characterized by elevated blood glucose levels is referred to as diabetes mellitus. The bigunaide class of oral antihyperglycemic medications includes the anti-diabetic medication metformin hydrochloride. 6.2-hour half-life. The activity lasts for eight to twelve hours. Metformin lowers blood glucose levels via reducing intestinal glucose absorption and hepatic glucose synthesis. Different concentrations of polymers of different grades of HPMC, carboxymethyl cellulose, calcium phosphate dibasic anhydrous, micro crystalline cellulose, PVP, and lactose monohydrate were used to make metformin hydrochloride and gliclazide. Different pellet forms, such as disintegrating pellets, coated pellets, and metformin pellets, were found to have separate effects on the formulation. An HPMC/PVA-based TDS-patch was created to assess the impact of pH on transdermal medication delivery. Floating Metformin HCl tablets are intended to extend the stomach residence time following oral delivery and have demonstrated sustained release through appropriate duration of action at a specific region. Metformin HCl's chemical formula is -1-carbamimidamido-N, N-dimethymethanimidamide. C4H11N5 is the molecular formula.HCL has a molecular weight of 165.63 and a melting point of 165.63. The solubility is nearly insoluble in acetone, ether, and chloroform but freely soluble in water and methanol.
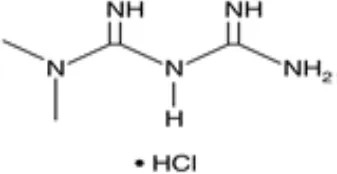
Fig 2: Structure of Metformin HCl
Compared to other classes of oral antihyperglycemic medications, metformin has a different mode of action. Metformin lowers blood glucose levels by reducing intestinal glucose absorption and hepatic glucose synthesis. It also improves insulin sensitivity by enhancing peripheral glucose uptake and utilization. Metformin's early activation of AMP-activated protein kinase (AMPK), a liver enzyme crucial to insulin signaling, the body's overall energy balance, and the metabolism of lipids and carbohydrates, mediates these effects. Improved insulin binding to insulin receptors may be the cause of increased peripheral glucose consumption.
In skeletal muscle, metformin treatment also raises AMPK activation. Insulin-independent glucose absorption is known to occur when GLUT4 is deployed to the plasma membrane by AMPK.
MATERIAL AND METHOD:
An isocratic RP-HPLC method was performed on a Waters Alliance e2695 HPLC system with 515 HPLC pump, equipped with 2998 Photo Diode Array (PDA) detector and Empower 2 software for processing and data collecting. Kromasil particle size) is used as a stationary phase. An ultrasonic bath sonicator (Frontline FS 4, Mumbai, India), semi-micro analytical balance (India) and Whatman filter paper No. 41 is used in the study.
Preparation of mobile phase
An accurately weighed quantity of 0.77 g of Ammonium acetate was taken into a 1000 mL beaker and diluted to 1000 mL with HPLC grade water and degassed in ultrasonic water bath and filtered through 0.45 μm nylon membrane filter using vacuum filtration gives required buffer concentration of 0.01 M Ammonium acetate buffer and the pH was adjusted to 3.5 with orthophosphoric acid. 0.01 M Ammonium acetate buffer with pH adjusted to 3.5 with orthophosphoric acid were mixed with HPLC grade Acetonitrile in the proportion of 65:35, v/v and it was filtered through 0.45 μm nylon membrane filter and degassed by ultrasonication.
Preparation of MET and CAN mixed standard drug stock solutions
The mixed standard drug stock solutions of Metformin Hydrochloride and Canagliflozin were prepared by dissolving 500 mg of Metformin Hydrochloride and 50 mg of Canagliflozin in 100 mL of mobile phase into a 100 mL of volumetric flask and then sonicated to dissolve it completely to get the concentration of 5000 μg/mL of Metformin Hydrochloride and 500 μg/mL of Canagliflozin.
Chromatographic Parameters:
Equipment: Waters Alliance e2695 HPLC system with 2998 PDA detector
Mobile Phase : 0.01 M Ammonium acetate buffer (pH adjusted to 3.5 with orthophosphoric acid) and Acetonitrile (65:35, v/v)
Flow rate : 1 mL/min
Detection Wavelength: 254 nm
Column temperature: Ambient
Run time : 8 minutes
Method validation for bio-analytical studies consist of procedures that shows a suitable method for quantitative analysis of drug analytes present in the biological fluids such as blood, plasma, serum and urine was reproducible and reliable for the future purpose. The essential factors for bio-analytical method validation consist of: (1) Accuracy (2) Precision (3) Selectivity (4) Sensitivity (5) Reproducibility and (6) Stability.
RESULTS AND DISCUSSION:
Method optimization
For the optimisation of RP-HPLC method several parameters and mobile phase compositions were tried. A satisfactory separation and good peak symmetry for Metformin Hydrochloride and Canagliflozin were obtained with Kromasil C18 column (250 mm×4.6 mm, 5 m particle size) and mobile phase containing a mixture of 0.01 M Ammonium acetate buffer (pH adjusted to 3.5 with orthophosphoric acid) and Acetonitrile (65:35, v/v) was delivered at a flow rate of 1 mL/min to get better reproducibility and repeatability. Both Metformin Hydrochloride and Canagliflozin were scanned in the wavelength region of 200-400 nm by using photo diode array (PDA) detector. Quantitation was attained with a PDA detector at 254 nm depends on peak area. Therefore 254 nm was selected as detection wavelength in the present study. The retention time of Metformin Hydrochloride and Canagliflozin was found to be 2.440 min and 3.713 min respectively. A typical chromatogram of blank, standard and sample solution of Metformin Hydrochloride and Canagliflozin is shown in Figure 3.
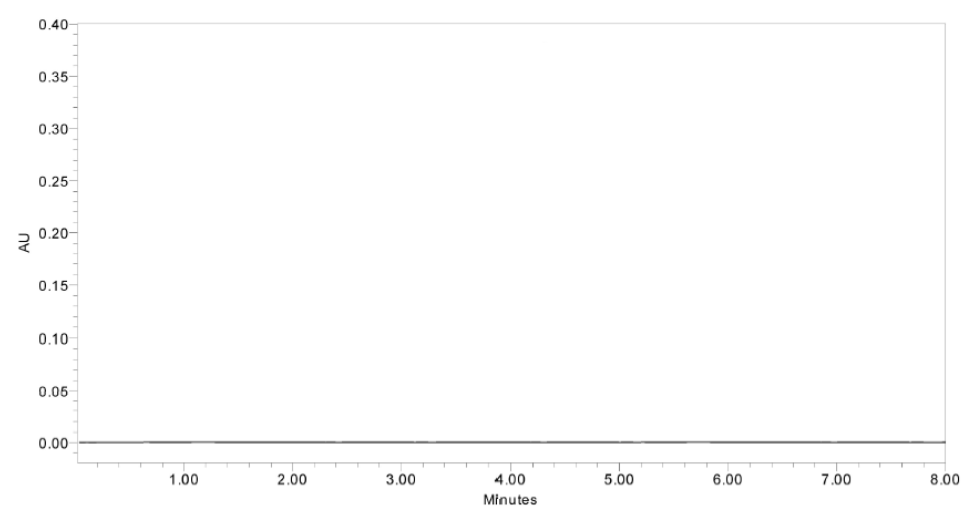
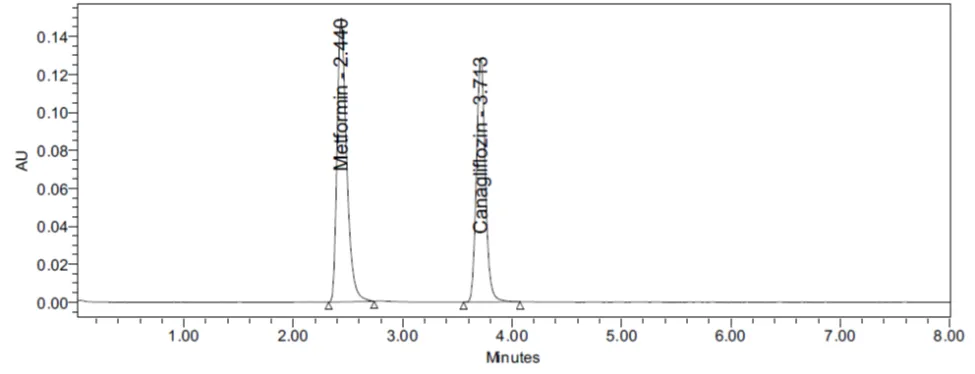
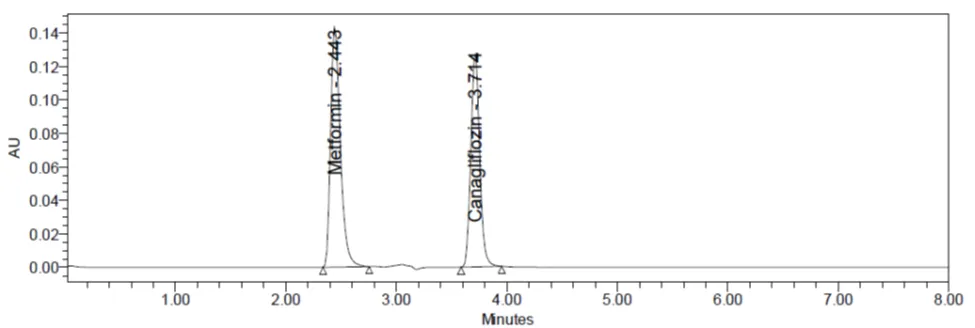
Figure 3 Chromatogram of blank, standard and sample solution of Metformin Hydrochloride and Canagliflozin
Specificity
The effect of excipients and other additives usually present in the combined dosage form of MET and CAN in the determination under optimum conditions was investigated and confirms that there is no interference. The specificity of the RP-HPLC method was established by injecting the placebo solution into the HPLC system.
Table no:1 Performance calculations and system suitability parameters of MET and CAN
|
Parameters |
MET |
CAN |
Acceptance limits |
|
Retention time (min) |
2.440 |
3.713 |
----- |
|
Theoretical plates (N) |
4216 |
12854 |
Not less than 2000 |
|
Asymmetry factor |
1.36 |
1.16 |
Not more than 2 |
|
Resolution |
8.95 |
More than 2 |
|
|
Linearity range (µg/mL) |
50-300 |
5-30 |
----- |
|
Limit of detection (LOD) (µg/mL) |
0.27 |
0.01 |
----- |
|
Limit of quantification (LOQ) (µg/mL) |
0.83 |
0.04 |
----- |
Linearity
An aliquots of 0.1, 0.2, 0.3, 0.4, 0.5 and 0.6 mL from the mixed standard drug stock solutions of 5000 μg/mL of Metformin Hydrochloride and 500 μg/mL of Canagliflozin was pippetted out and then transferred into the series of 10 mL of volumetric flask and volume make upto 10 mL with
the mobile phase to get a concentration of 50, 100, 150, 200, 250 and 300 μg/mL of Metformin Hydrochloride and 5, 10, 15, 20, 25 and 30μg/mL of Canagliflozin respectively. All the above solutions were filtered through 0.45 μm nylon membrane filter and then 20 L of each solution
was injected three times into the HPLC system. Least square regression analysis was carried out for the slope, intercept and correlation coefficient. Calibration curve were constructed by plotting peak area versus concentration (μg/mL) is shown in Figure 4.
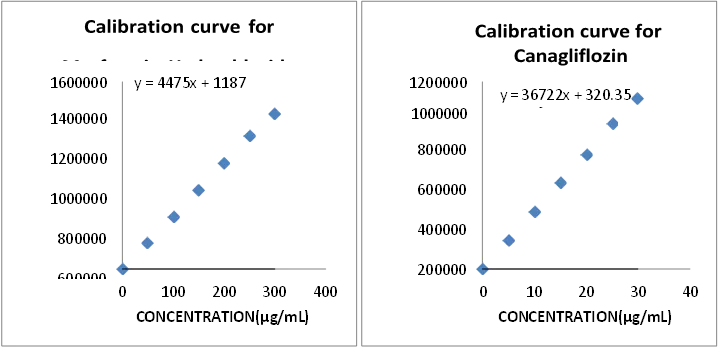
Figure 4 Standard calibration curves of MET and CAN
Accuracy
The accuracy of the proposed method was determined by calculating the recoveries of MET and CAN by standard addition method. Recovery studies were carried out by adding concentration level of 50 %, 100 % and 150 % of standard drug solution of MET and CAN to the preanalysed sample solution of Invokamet® tablet powder and the mixtures were re-analysed by the proposed method. Three replicates were prepared for each concentration level and was injected into the HPLC system and the results were obtained by using following formula and also confirm the accuracy of the proposed method were reported in Table 2.
Table no: 2 Results of accuracy studies of MET
|
Concentration Level in % |
Amount added (µg/mL) |
Amount recovered (µg/mL) |
% Recovery |
% Mean Recovery |
RSD % |
|
S1:50% |
100 |
100.04 |
100.04 |
99.84 |
0.68 |
|
S2:50% |
100 |
100.40 |
100.40 |
||
|
S3:50% |
100 |
99.08 |
99.08 |
||
|
S4:100% |
200 |
199.50 |
99.75 |
100.65 |
0.78 |
|
S5:100% |
200 |
202.42 |
101.21 |
||
|
S6:100% |
200 |
202 |
101.00 |
||
|
S7:150% |
300 |
298.01 |
99.34 |
99.45 |
0.29 |
|
S8:150% |
300 |
299.33 |
99.78 |
||
|
S9 :150% |
300 |
297.70 |
99.23 |
Table no: 3 Results of accuracy studies of CAN
|
Concentration Level in % |
Amount added (µg/mL) |
Amount recovered (µg/mL) |
% Recovery |
% Mean Recovery |
RSD % |
|
S1:50% |
10 |
10.01 |
100.11 |
100.74 |
0.85 |
|
S2:50% |
10 |
10.03 |
100.39 |
||
|
S3:50% |
10 |
10.17 |
101.73 |
||
|
S4:100% |
20 |
20.04 |
100.20 |
100.06 |
0.36 |
|
S5:100% |
20 |
20.06 |
100.35 |
||
|
S6:100% |
20 |
19.93 |
99.65 |
||
|
S7:150% |
30 |
30.09 |
100.33 |
99.95 |
0.5 |
|
S8:150% |
30 |
30.04 |
100.16 |
||
|
S9 :150% |
30 |
29.81 |
99.39 |
Precision
The precision of the proposed method was performed to express the closeness of agreement between a series of measurements obtained from multiple sampling of the same homogeneous sample under the optimized conditions. Precision are of three levels they are repeatability, intermediate precision and reproducibility. Repeatability was carried out by calculating method and system precision. Method precision was performed by injecting six times of a homogenous sample preparation of 200 μg/mL of Metformin Hydrochloride and 20 μg/mL of Canagliflozin of a single batch sample solution of Invokamet® tablet powder into the HPLC system to ensure that the analytical method is working properly. The results of method precision of Metformin Hydrochloride and Canagliflozin were reported in Table 4 and Table 5.
Table 4 Method precision of Metformin Hydrochloride
|
Injection No. |
Name of the drug |
Concentration (μg/mL) |
Retention time (min) |
Peak Area |
Assay % |
|
1 |
MET |
200 |
2.438 |
896027 |
99.35 |
|
2 |
MET |
200 |
2.438 |
898822 |
99.66 |
|
3 |
MET |
200 |
2.439 |
897108 |
99.47 |
|
4 |
MET |
200 |
2.439 |
901800 |
100.00 |
|
5 |
MET |
200 |
2.440 |
903334 |
100.17 |
|
6 |
MET |
200 |
2.443 |
898203 |
99.60 |
|
Average |
2.439 |
899215.7 |
99.71 |
||
|
SD |
0.001871 |
2808.194 |
0.311 |
||
|
RSD % |
0.076 |
0.31 |
0.31 |
||
Table 5 Method precision of Canagliflozin
|
Injection No. |
Name of the drug |
Concentration (μg/mL) |
Retention time (min) |
Peak Area |
Assay % |
|
1 |
CAN |
20 |
3.713 |
734744 |
99.73 |
|
2 |
CAN |
20 |
3.714 |
739030 |
100.31 |
|
3 |
CAN |
20 |
3.717 |
730041 |
99.09 |
|
4 |
CAN |
20 |
3.717 |
732051 |
99.37 |
|
5 |
CAN |
20 |
3.718 |
733069 |
99.50 |
|
6 |
CAN |
20 |
3.732 |
731465 |
99.29 |
|
Average |
3.718 |
733400 |
99.55 |
||
|
SD |
0.006892 |
3176.8 |
0.43 |
||
|
RSD % |
0.18 |
0.43 |
0.43 |
||
Limit of detection and Limit of quantitation
Limit of detection is a smallest concentration of an analyte which gives a measurable response. Limit of quantitation is a smallest concentration of an analyte that gives a measurable response which can be quantified accurately. LOD and LOQ are calculated by using following formula and the results of LOD and LOQ of Metformin Hydrochloride and Canagliflozin were reported in Table. Robustness of the method was carried out by deliberately changing the composition of mobile phase by altering the proportion of organic phase by ±10 % and column temperature by ± 2°C. There are no marked variations were observed in the system suitability parameters and the results of robustness were reported in Table 6 and 7.
Table 6. Robustness data of Metformin Hydrochloride
|
Variations in method parameters |
Retention Time (mins) |
Average peak area* |
RSD % |
System suitability parameters |
|
|
Theoretical Plates |
Asymmetry |
||||
|
Buffer : ACN (68:32,v/v) |
2.426 |
912558 |
1.4 |
3861 |
1.48 |
|
Buffer : ACN (62:38,v/v) |
2.431 |
886527 |
0.41 |
3887 |
1.47 |
|
28°C Column temperature |
2.426 |
911899 |
1.3 |
3861 |
1.48 |
|
32°C Column temperature |
2.196 |
802965 |
0.32 |
3525 |
1.44 |
Table 7 Robustness data of Canagliflozin
|
Variations in method parameters |
Retention Time (mins) |
Average peak area* |
RSD % |
System suitability parameters |
|
|
Theoretical Plates |
Asymmetry |
||||
|
Buffer : ACN (68:32,v/v) |
3.626 |
724007 |
0.58 |
11949 |
1.19 |
|
Buffer : ACN (62:38,v/v) |
3.689 |
716425 |
0.61 |
11538 |
1.19 |
|
28°C Column temperature |
3.626 |
720694 |
0.74 |
11963 |
1.18 |
|
32°C Column temperature |
3.335 |
636649 |
0.59 |
11017 |
1.19 |
Solution stability study
Solution stability was carried out to ensure that the sample solutions of 200 μg/mL of Metformin Hydrochloride and 20 μg/mL of Canagliflozin were found to be stable upto 48 hrs at room temperature. Solution stability was performed by injecting six times of a homogenous sample preparation of 200 μg/mL of Metformin Hydrochloride and 20 μg/mL of Canagliflozin of a single batch sample solution of Invokamet® tablet powder in different time intervals i.e. 0, 8, 16, 24, 32 and 48 hrs at room temperature into the HPLC system. The RSD % of the assay of Metformin Hydrochloride and Canagliflozin during solution stability studies was within 2 % and it was found that the sample solutions of 200 μg/mL of Metformin Hydrochloride and 20 μg/mL of Canagliflozin are stable upto 48 hrs at room temperature. The results of solution stability of
Metformin Hydrochloride and Canagliflozin upto 48 hrs at room temperature were reported in Table 8 and Table 9.
Table 8 Solution stability of MET upto 48 hrs at room temperature
|
Time intervals (hrs) |
Concentration (μg/mL) |
Retention time (min) |
Peak Area |
Assay % |
Theoretical Plates |
Asymmetry |
|
0 |
200 |
2.438 |
898066 |
99.58 |
4214 |
1.35 |
|
8 |
200 |
2.438 |
897132 |
99.48 |
4124 |
1.36 |
|
16 |
200 |
2.438 |
895511 |
99.30 |
4146 |
1.37 |
|
24 |
200 |
2.440 |
900003 |
99.80 |
4146 |
1.37 |
|
32 |
200 |
2.440 |
896525 |
99.41 |
4183 |
1.36 |
|
48 |
200 |
2.444 |
902170 |
100.04 |
4185 |
1.37 |
|
Average |
2.439 |
898234 |
99.60 |
4166 |
1.36 |
|
|
SD |
0.002338 |
2457.62 |
0.274 |
33.218 |
0.0082 |
|
|
RSD % |
0.09 |
0.27 |
0.27 |
0.7 |
0.59 |
|
Table 9 Solution stability of ACN upto 48 hrs at room temperature
|
Time intervals (hrs) |
Concentration (μg/mL) |
Retention time (min) |
Peak Area |
Assay % |
Theoretical Plates |
Asymmetry |
|
0 |
20 |
3.709 |
728817 |
99.61 |
12204 |
1.14 |
|
8 |
20 |
3.710 |
729244 |
99.66 |
12260 |
1.16 |
|
16 |
20 |
3.713 |
730140 |
99.79 |
12254 |
1.15 |
|
24 |
20 |
3.715 |
727898 |
99.48 |
12219 |
1.15 |
|
32 |
20 |
3.718 |
728235 |
99.53 |
12255 |
1.16 |
|
48 |
20 |
3.727 |
727799 |
99.47 |
12266 |
1.14 |
|
Average |
3.715 |
728688 |
99.59 |
12243 |
1.15 |
|
|
SD |
0.006593 |
900.412 |
0.12 |
25.219 |
0.00894 |
|
|
RSD % |
0.17 |
0.12 |
0.12 |
0.20 |
0.77 |
|
CONCLUSION:
A simple, rapid, accurate, precise, sensitive, and robust RP-HPLC method was successfully developed and validated for the simultaneous estimation of Metformin Hydrochloride (MET) and Canagliflozin (CAN) in bulk and pharmaceutical dosage forms in accordance with ICH guidelines. The method demonstrated excellent linearity, accuracy, precision, specificity, and robustness, with satisfactory recovery and low detection and quantification limits. Stability and forced degradation studies confirmed that the method is stability-indicating and capable of effectively separating degradation products from the analytes. Therefore, the developed RP-HPLC method is reliable and suitable for routine quality control, stability testing, and pharmaceutical analysis of MET and CAN in combined dosage formulations.
REFERENCES


Kantubothu Karuna, M. Ramakrishna Reddy, Chandra Sekhar Naik, Method Development and Validation of Metformin Hydrochloride and Canagliflozin in Bulk and Tablet Dosage Forms by RP-HPLC, Int. J. of Pharm. Sci., 2026, Vol 4, Issue 6, 3191-3200. https://doi.org/10.5281/zenodo.20662227
 10.5281/zenodo.20662227