

We use cookies to ensure our website works properly and to personalise your experience. Cookies policy
Department of Pharmaceutical Chemistry, Maharaja Agrasen School of Pharmacy, Maharaja Agrasen University, Baddi, 174103, Himachal Pradesh, India
Nyctanthes arbortristis is an important medicinal plant that has been used in the treatment of several ailments such as skin diseases, liver diseases, ulcers, hair fall, piles, rheumatism and malarial fever. Alkaloids, tannins, flavonoids, sterols, triterpenes, saponins and glycosides are the bioactive components found in this plant. This study was aimed to use ultrasound assisted extraction technique for extracting bioactive compounds from the leaves of N. arbortristis and to stepwise optimize the extraction conditions like time duration, solvent concentration, and operating temperature. A three-factor-five level central composite rotatable design (CCRD) was used to build the response surface methodology (RSM) model and to find the optimum extraction conditions. All the independent variables showed a significant effect on all the responses which indicated that all extraction parameters employed in this study were important in the optimization process. The antioxidant activity of N. arbortristis using 1,1-diphenyl-2-picrylhydrazyl (DPPH) assay method was also measured in vitro. The plant extract demonstrated a considerable dose dependent inhibition of DPPH activity. The hydroalcoholic extract of N. arbortristis was shown to have a higher IC50 value of 57.52 ?g/mL for DPPH radical scavenging activity than that of ascorbic acid (38.98 ?g/mL). The result of the DPPH assay demonstrate that this leaf extract may be a significant natural source of antioxidants that may have a beneficial effect on preventing oxidative stress-related diseases. The optimum conditions generated from RSM could be used for future upscale extractions of N. arbortristis leaves for economical evaluation.
To ensure consumers and environmental health in the new future of “one health,” it is preferable to use a green chemistry approach. The shift of chemistry toward the use of sustainable tools provides new challenges for a rational combination of eco-friendly and less energy-consuming and cheaper methodologies in analytics.[1,2] In fact, the techniques used to extract natural substances and botanicals are advanced extraction methods such as Microwave assisted extraction (MAE), Ultrasound assisted extraction (UAE), Supercritical fluid extraction (SFE) and Pressurized liquid extraction (PLE) that are proven to extract bioactive substances from plant-based matrices and products effectively for use in products for human use and are relevant in the context of climate emergency.[3] The mentioned advanced extraction methods are not green themselves; however, for innovation in the technological progress, the control and optimization of several parameters is required to increase the extraction yield of selected compounds while minimizing the time of extraction, health hazardousness, and environmental impact. The main variable to be set in these extraction methods are solvent selection, operating temperature and pressure, time duration, and flow rates of the extraction processes. Many studies have been conducted on optimizing extraction parameters but the best extraction method is yet to be found. There is no one universal method of extraction that is ideal, and each extraction procedure is customized to the specific characteristics of the plants.[4]
In general, 2 approaches to optimize the condition are carried out. A “one variable at a time” method is a sound and experimental method and it takes a long time to set each parameter. The other approach may be employed as a Design of Experiments (DoE), which was find out to be more structured and a faster approach to design experiments for the study of input parameters and the response variables, as well as to study the various interactions that may exist between the input parameters performed by statistical software.[5] Both approaches are increasingly applied for optimizing the variables from a green chemistry perspective. Extraction is an indispensable process for acquiring bioactive compounds. It is important to evaluate the effect of factors influencing the extraction process, such as extraction time, temperature and solvent/solute ratio because of differences in the physicochemical properties of these bioactive compounds. To extract the bioactive compounds with high yield, it is important to optimize the extraction technique, by evaluating all the variable parameters involved in the extraction process to find out the ideal conditions of the process, which proposes the reduction of experimental time and the ability to assess the effect of different sources of influence.[6]
Nyctanthes arbortristis Linn. also known as ‘Tree of Sadness’ is a member of Oleaceae family. N. arbortristis may be a large ligneous plant 7-10 m in height having polygon branches. Bark of this plant flaky gray in color and rough. The leaves are thick and hairy. Flowers are in clusters at the nodes of branches or in the axils of leaves. The flowers are sessile, sweet smelling, with a bell formed coil. Fruits are heart shaped and brown in color.[7] In therapeutic systems of Ayurveda, Siddha and Unani and Homeopathy, N. arbortristis has been found to be effective in the treatment of different ailments such as skin diseases, liver diseases, ulcers, hair fall, piles, rheumatism and malarial fever. The researchers have confirmed anticonvulsant, anti-inflammatory, anticancer, antioxidant, hepatoprotective and wound healing properties of extracts of N. arbortristis Linn. Plant contains bioactive constituents including alkaloids, tannins, triterpenes, flavonoids, sterols, saponins and glycosides.[8]
Several studies are found in the literature on the study of bioactive compounds from N. arbortristis extracted by different traditional techniques but very few literature is available on the extraction of bioactive compounds from N. arbortristis by novel emerging techniques. Moreover, no literature is available on the optimization of extraction conditions of ultrasound assisted extraction technique for the extraction of bioactive compounds from N. arbortristis. In the context of green chemistry, it is necessary to consume less toxic solvents and lessen the environmental impact. So, the aim of the present study was to use ultrasound assisted extraction technique for the extraction of bioactive compounds from N. arbortristis. The work here was also aimed to stepwise optimize the extraction conditions to obtain higher yields, use minimum solvent and to screen the chemical constituents of N. arbortristis.
MATERIALS AND METHODS
Materials
Folin–Ciocalteu’s phenol reagent, Gallic acid and sodium carbonate were purchased from Sigma-Aldrich (India). Methanol, ethyl acetate, petroleum ether, sodium carbonate and sodium hydroxide were obtained from Merck, India. All reagents were analytical grade. Distilled water was purified in our laboratory.
Sample Preparation
Nyctanthes arbortristis leaves were collected from Hoshiarpur region, Punjab. Plant material was collected in the month of December 2025. The collected leaves were air dried in the shade at 28-30oC. The dried leaves were milled using a grinder. To avoid any chemical decomposition, dried milled plant material was stored in a cool, dry place at 4oC prior to extraction.
Ultrasonic Extraction
Specific amounts of dried plant material were weighed in 50 mL Erlenmeyer flasks and specific amount of solvents was added to them. The flasks were then closed with polyethylene films. Flasks were then positioned within the ultrasonic bath (Bransonic Ultrasonic Cleaner B-2200E1) such that the solvent in the flasks was 2 cm below the surface of the water in the bath. The sonication was carried out for a definite time. The treated samples were centrifuged at 5000 rpm for given time period and the supernatant was collected. The extraction solution was filtered after each UAE and then it was concentrated in vacuo and the extract was kept at -20oC for further analysis. Three replicates were done for each experiment.
Phytochemical Analysis
The powdered leaves of Nyctanthes arbortristis were extracted using different solvents such as petroleum ether, ethyl acetate and methanol with the assistance of ultrasonication. All the three extracts were then qualitatively analyzed for the presence of chemical constituents. The extracts were phytochemically screened for the presence of carbohydrates, alkaloids, flavonoids, glycosides, saponins, phenolic compounds/tannins and terpenoids according to the standard procedure.
Total Phenolic Content
The Folin Ciocalteu determines the total concentration of phenolic hydroxyl groups. Folin Ciocalteu reagent reacts with polyphenols in plant extract to form blue colored complex compounds which can be measured using a visible-light spectroscopy technique. This blue complex is absorbed by the alkaline solution.[9] The total amount of phenol in the extracts was estimated using Folin Ciocalteu reagent. Gallic acid was used as a standard and the total phenol content has been presented as mg/g Gallic acid equivalent (GAE).
A series of calibration solution with concentration 10, 20, 30, 40 and 50 µg/mL of Gallic acid was prepared in methanol. The plant extract with concentration 0.5 mg/mL was also made in methanol. 2.5 mL of a 10 fold diluted Folin Ciocalteu reagent and 2 mL of 7.5% sodium carbonate were added to 0.5 mL of each sample (calibration solution, plant extract and blank) taken in the test tubes. The test tubes were covered with parafilm and allowed to stand at room temperature for 30 minutes and then the absorbance was measured spectrophotometrically at 765 nm against the blank. The estimation was carried out three times. The Folin Ciocalteu reagent reacts with reducing compounds and polyphenols and generates blue color as a result of the reaction.[10,11] The Figure 1 represents the Gallic acid standard curve which is measured spectrophotometrically.
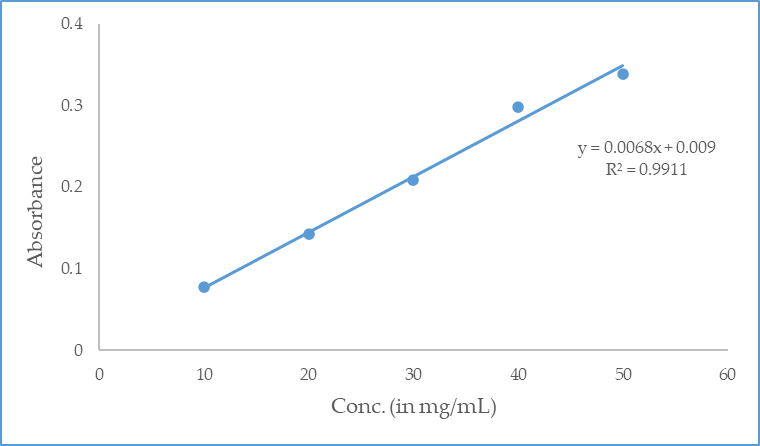
Figure 1: Gallic Acid Standard Curve
Total Flavonoids Content
The total flavonoids content (TFC) was determined using aluminium chloride colorimetric method. 2 mL AlCl3 (10%) and 1 mL each of NaNO2 (5%, w/v) and NaOH (1 mol/L) solutions were mixed with 1 mL leaves extract. The final volume was made 5 mL by adding deionized water and left for 10 min for incubation. Afterward, the absorbance was then compared to the mixture without the sample at 510 nm using quercetin as the standard.
The total flavonoid content was determined using a standard curve of quercetin (0-500 mg/L) (Figure 2). The total flavonoid concentration was measured in milligrams of quercetin equivalents per gram of extract.
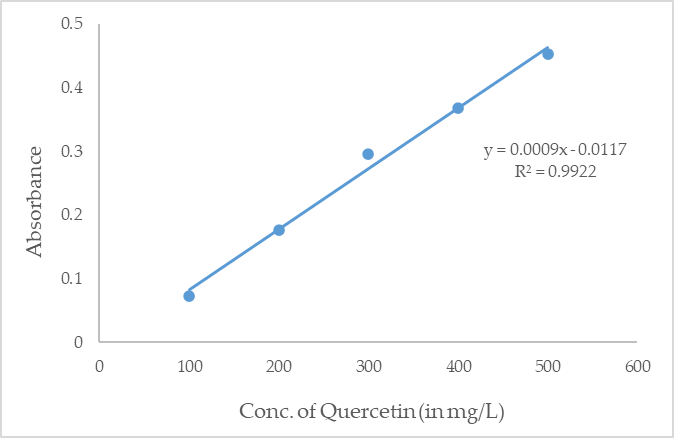
Figure 2: Quercetin Standard Curve
Optimization of UAE by Single-Factor Experiments
Effect of Extraction Temperature:
The optimum extraction temperature was selected through different temperatures (20, 30, 40, 50, 60, 70 and 80oC) under the following conditions: liquid/solid ratio 30 mL/g, methanol concentration 60% and extraction time 40 min. UAE were performed, the extraction solution was filtered and the sample residue was re-extracted twice with the same extraction conditions. The extractive solutions were then combined and concentrated in vacuo, and the extract was kept at -20oC for further analysis. Experiments were carried out in triplicate and the solutions were stored in dark before analysis.
Effect of Extraction Time:
In order to find the best extraction time, different extraction times (10, 20, 30, 40, 50, 60 and 70 min) were tested with the conditions of liquid/solid ratio 30 mL/g, methanol concentration 60% and extraction temperature 60oC.
Effect of Solvent Concentration:
For studying the effect of methanol concentration on TPC and TFC, 5.0 g of pretreated samples was placed in 250 mL conical flasks and soaked with methanol (varying from 30–90% v/v), extraction time was kept at 40 min., extraction temperature applied was 60oC and the liquid/solid ratio was 30 mL/g.
Experimental Design for the Response Surface Procedure
A three-factor 5-level central composite rotatable design (CCRD) was used to build up response surface methodology (RSM) model and to optimize the extraction condition of N. arbortristis leaves. The selected independent variables in this study were extraction temperature (°C), extraction time (min) and solvent ratio (v/v%) (water: methanol) towards the responses; total phenolic content (mg/g dry extract) and total flavonoid content (mg/g dry extract). The Design Expert ® software (Version 7, Stat. Ease Inc., Minneapolis, USA) was used to create a total of 19 experiments with 3 independent variables. The Ease Inc., Minneapolis, USA). Experiments were run randomly to minimize the effects of unexplained variability in the actual responses due to extraneous factors.[12] A summary of the independent variables and their coded levels are shown in Table 1.
Table 1: Coded Independent Variables Used in CCRD Design
|
Symbol |
Independent variables |
Coded level |
||||
|
|
|
-1.68 |
-1 |
0 |
+1 |
+1.68 |
|
A |
Extraction temperature (°C) |
40 |
48 |
60 |
72 |
80 |
|
B |
Extraction time (min) |
40 |
48 |
60 |
72 |
80 |
|
C |
Solvent ratio (water: methanol), v/v% |
40 |
48 |
60 |
72 |
80 |
Statistical Analysis:
Collected data were analyzed using quadratic polynomial modeling to obtain predictive mathematical equation that explains the interactions and impact of variables to the response.[13]
In the quadratic model equation, the parameters β0, βi, βii, and βij are the regression coefficients: β0 the intercept, βi and βii the linear and quadratic coefficient, respectively, and βij the interaction effect coefficient. Here, xi and xj represent the coded levels of the independent variables that exert influence over the dependent response variable Y. The non-significant levels (p < 0.05) of the independent variables that affect the dependent response variable Y were used to construct a reduced model, and the significant (p > 0.05) ones were dropped.
The significant differences between the independent variables were tested using analysis of variance (ANOVA). The experimental data were analyzed using reduced model (p < 0.05) and multiple regressions.
Verification of the Models:
Some random extractions were prepared to test the model predictions in order to assess the sufficiency of the constructed model. Actual values were compared with the predicted ones to check the adequacy of the final reduced models. For each response, the percentage of the residual standard error (RSE) was calculated.
Evaluation of In-Vitro Antioxidant Activity
Antioxidants have been shown to inhibit or delay the oxidation of a substrate by free radicals, thereby protecting the body from oxidative stress and the corresponding degeneration diseases. Antioxidants may be administered to the body externally as a means to strengthen the body's own antioxidant defense system. Antioxidants act in a number of different ways and at different levels of oxidation. All of these can reduce oxidative damage such as by lowering oxygen concentrations, scavenging free radicals like hydroxyl radicals to prevent the initiating of the chain reaction, or binding to free metal ions to prevent metal-induced free radical formation and oxidative damage. Natural antioxidants are the rich sources of phenolic and polyphenolic chemicals. To further utilize the phytochemical content of herbal plants for the conditions associated with the disease, their antioxidant activity was assessed. The current study is aimed to evaluate the extract's potential as an antioxidant and its ability to scavenge free radicals with that of ascorbic acid, a synthetic form of vitamin C, in relation to reactive oxygen species.[14]
1-Diphenyl-2-picrylhydrazyl (DPPH) radical scavenging activity
(a) Preparation of DPPH Stock Solution (0.5 mM)
DPPH stock solution with concentration 0.5 mM or 200 µg/mL was prepared using methanol.
(b) Determination of DPPH Maximum Wavelength and Operating Time
DPPH solution (20µg/mL) was prepared in methanol as a solvent. The absorbance of this solution was measured at a wavelength of 400–800 nm to obtain lmax. The absorbance of the solution was then measured at this wavelength at 1 minute intervals until a stable absorbance was obtained, to get the operating time.
(c) Test of Antioxidant Activity
Test of antioxidant activity was conducted according to the method described by Nerdy and Manurung.[14] This method consists of procedure for negative control, positive control, and sample procedure.
(i) Procedure for Negative Control:
The stock solution of DPPH was diluted with methanol to give a solution of concentration 40 µg/mL. The solution was left until at the end of the operating time and the absorbance was measured at the maximum wavelength.
(ii) Procedure for Positive Control:
50.0 mg of ascorbic acid was taken in a 250.0 mL volumetric flask, 100.0 mL methanol was added to it and the flask was shaken. Methanol was added to the marked line to obtain a stock solution of 200 µg/mL. 5.0 mL, 10.0 mL, 15.0 mL, 20.0 mL, and 25.0 mL of ascorbic acid stock solution was taken separately into five different 50.0 mL volumetric flasks and 10.0 mL of DPPH stock solution was added to each flask and the volume was made up to the mark with methanol and to get ascorbic acid concentration as 20, 40, 60, 80 and 100 µg/mL respectively and DPPH concentration as 40 µg/mL. The absorbance of each solution was determined at lmax after the operating time had elapsed.
(iii) Procedure for Sample:
50 mg of the extract was taken in a 250.0 mL volumetric flask, 100.0 mL methanol was added to it, shaken until dissolved and diluted with methanol up to the mark to obtain the extract stock solution of concentration 200 µg/mL. 5.0 mL, 10.0 mL, 15.0 mL, 20.0 mL and 25.0 mL of extract solution were taken separately in five different 50.0 mL volumetric flasks, 10.0 mL DPPH solution was added to them and the volume was made up to the mark with methanol to get extract solutions with different concentration of 20 µg/mL, 40 µg/mL, 60 µg/mL, 80 µg/mL and 100 µg/mL, respectively and DPPH solution concentration of 40 µg/mL in each flask. The absorbance of each solution was determined at the lmax after the operating time had elapsed. Triplicate replications were made for each concentration of each treatment.
Although the activity is given as 50% inhibitory concentration (IC50), the percentage of DPPH radicals scavenged was used to find IC50. The level of antioxidant activity increases with decreasing IC50 value. The percentage inhibition of the free radical DPPH was determined by using the following formula:
% inhibition = [(absorbance of control-absorbance of sample)/absorbance of control] × 100%
RESULTS AND DISCUSSION
Qualitative Phytochemical Screening
According to preliminary phytochemical analysis, all the solvent extracts of the plant contain carbohydrates, alkaloids, flavonoids, phenolic compounds/tannins, terpenoids, glycosides, and saponins. Moreover, methanolic extract of the plant showed the presence of carbohydrates, alkaloids, flavonoids, phenolic compounds/tannins, terpenoids, glycosides and saponins (Table 2).
Table 2: Phytochemical Screening of N. arbortristis
|
S. No. |
Test |
Petroleum ether extract |
Ethyl acetate extract |
Methanol extract |
|
1. |
Carbohydrates |
+ |
- |
+ |
|
2. |
Flavonoids |
- |
+ |
+ |
|
3. |
Alkaloids |
+ |
- |
+ |
|
4. |
Glycosides |
+ |
- |
+ |
|
5. |
Saponins |
+ |
+ |
+ |
|
6. |
Tannins and Phenol |
+ |
- |
+ |
|
7. |
Terpenoids |
+ |
+ |
+ |
Optimization of UAE by Single-Factor Experiments
Effect of Extraction Temperature on TFC and TPC:
The extraction performance is affected by the ultrasonic temperature as the increased ultrasonic temperature may lead to a greater diffusion coefficient of the compounds of interest resulting in enhanced solubility of those compounds.[15] The effect of different temperature on the total phenolic content (TPC) and on total flavonoid content (TFC) estimation is shown in Figure 3. The dramatic increase in TFC and TPC with increasing extraction temperature from 20 to 60°C may be due to decrease in solvent's viscosity and surface tension which lead to high vapor pressure. However, the higher extraction temperature (above 60°C) led to a reduction in the production of TFC and TPC. Therefore, the optimal extraction temperature was selected as 60°C.
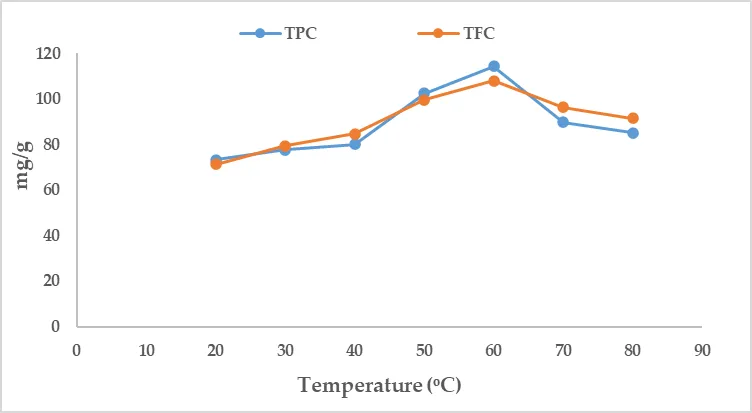
Figure 3: Effect of Extraction Temperature on TFC and TPC
Similar results were obtained with Pteris cretica and Oxalis corniculata giving the highest yield of total flavonoid at a temperature of 60°C.[16,17] These results may be due to hot spots that induced reduction in the viscosity of solvent resulting in an acceleration of the movement of molecules with increase in temperature; even degradation of sensitive flavonoids can occur at higher temperatures.[18] Extraction temperatures more than 80°C have not been studied as higher temperatures are unlikely to lead to significant results and might deteriorate the analytes which might be due to the disruption of the flavonoid structure at high temperatures.[17,19,20]
Effect of Time of Extraction on TFC and TPC:
Additionally, extraction time controls the reducibility of phenolic compounds and should be taken in consideration in the optimization process. Results of the effect of ultrasound time on the total extraction yield of polyphenols and flavonoids are shown in Figure 4. The polyphenols and flavonoids yield (101.45 mg/g and 98.18 mg/g, respectively) were the highest at 60 min of extraction and then decreased rapidly. It can be clarified that extended extraction time causes the degradation of the phenolic compound present in the extract and also decreases the extraction yield, therefore, 60 min was considered as the optimum extraction time.[17,21]
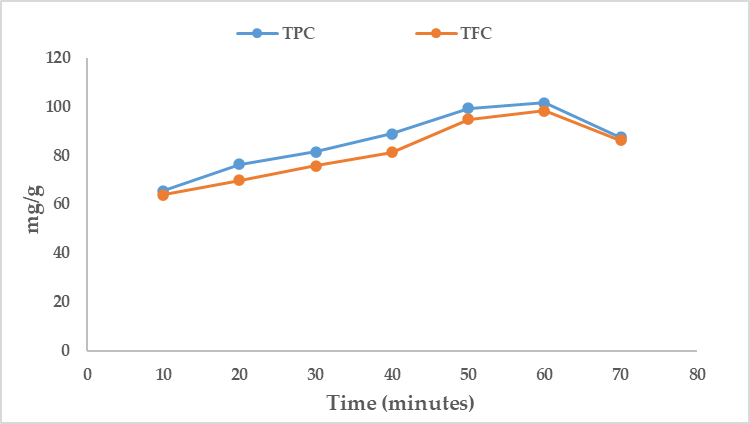
Figure 4: Effect of Time of Extraction on TFC and TPC
Effect of Methanol Concentration on TFC and TPC:
Phenolic compounds can be extracted from plants using aqueous methanol which is widely used solvent due to the ability of methanol to disrupt solute–plant matrix bond, thereby recovering TPC. At the same time, water causes the swelling of cell materials.[17,22] Therefore, it is necessary to choose an appropriate methanol concentration to promote the extraction performance. Figure 5 shows a rise in TFC and TPC as the methanol concentration increased from 30% to 60% but dropped very sharply at methanol content higher than 60%, suggesting that different methanol–water systems had different amounts of extraction efficiency and that it may be desirable to add some water to improve the extraction effectiveness. This is because the water can increase the polarity of the aqueous methanol. Therefore, 60% methanol concentration was selected for the subsequent study. A similar study reported the highest total flavonoids from Pteris cretica at 60% ethanol concentration.[16]
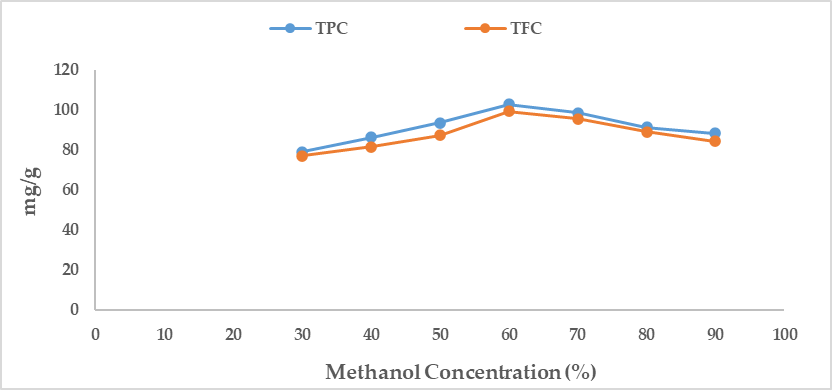
Figure 5: Effect of Methanol Concentration on TFC and TPC.
Model Fitting and Analysis of Variance
To investigate the effects of extraction temperature, extraction time and solvent ratio on TPC and TFC of N. arbortristis leaves, RSM was employed with CCRD. Table 3 presents the design matrices of actual data using CCRD and the predicted data.
Table 3: Design Matrices of Actual and Predicted Values of Extraction Temperatures (A), Extraction Times (B) and Methanol Concentration (C) for N. arbortristis Leaves Using CCRD Design
|
Run |
Independent Variables |
Response |
|||||
|
|
A (oC) |
B (min) |
C (v/v%) |
TPC (mg/g) |
TFC (mg/g) |
||
|
|
|
|
|
Actuala |
Predicted |
Actuala |
Predicted |
|
1 |
60 |
60 |
60 |
115.76±0.43 |
114.80 |
99.41±0.43 |
100.20 |
|
2 |
48 |
72 |
48 |
87.80±0.24 |
87.75 |
82.82±0.54 |
83.00 |
|
3 |
48 |
72 |
72 |
88.81±0.57 |
88.34 |
75.01±0.42 |
75.21 |
|
4 |
72 |
48 |
48 |
87.92±0.45 |
87.62 |
73.30±0.11 |
73.56 |
|
5 |
60 |
60 |
60 |
114.70±0.21 |
114.80 |
100.43±0.23 |
100.20 |
|
6 |
72 |
48 |
72 |
78.67±0.11 |
77.95 |
64.40±0.11 |
64.68 |
|
7 |
72 |
72 |
48 |
94.21±0.25 |
93.68 |
70.49±0.32 |
70.64 |
|
8 |
72 |
72 |
72 |
92.01±0.43 |
91.74 |
65.42±0.27 |
65.68 |
|
9 |
60 |
60 |
60 |
114.27±0.34 |
114.80 |
100.49±0.17 |
100.24 |
|
10 |
40 |
60 |
60 |
86.83±0.31 |
87.21 |
81.01±0.25 |
80.70 |
|
11 |
60 |
60 |
60 |
115.21±0.39 |
114.80 |
99.91±0.13 |
100.20 |
|
12 |
80 |
60 |
60 |
85.45±0.15 |
86.16 |
60.02±0.35 |
59.67 |
|
13 |
60 |
40 |
60 |
86.74±0.23 |
87.41 |
86.90±0.15 |
86.50 |
|
14 |
60 |
80 |
60 |
94.80±0.24 |
95.22 |
82.51±0.19 |
82.26 |
|
15 |
60 |
60 |
60 |
114.32±0.18 |
114.80 |
100.62±0.25 |
100.25 |
|
16 |
60 |
60 |
40 |
94.13±0.41 |
94.58 |
81.73±0.26 |
81.48 |
|
17 |
60 |
60 |
80 |
86.31±0.32 |
86.95 |
67.85±0.34 |
67.45 |
|
18 |
48 |
48 |
48 |
92.75±0.15 |
92.25 |
88.85±0.49 |
89.05 |
|
19 |
48 |
48 |
72 |
85.37±0.17 |
85.13 |
77.02±0.21 |
77.33 |
aValues are expressed as means±SD (n = 3).
The actual values of TPC and TFC of N. arbortristis varied from 78.67–115.76 mg/g of the extract and 60.02-100.62 mg/g of the extract, respectively.
Models for each of the two responses were expressed by the quadratic polynomial model by applying multiple regression analysis on the actual data and are given in Table 4. The empirical relationship between the dependent and independent variables for each response was generated by the demonstrated equations.
Table 4: Quadratic Polynomial Equations for the Two Responses in Terms of Coded Factors
|
Response |
Equation |
|
TPC |
Y = -464.7684 + 7.5612A + 5.3051B + 6.4749C + 0.0187AB – 0.0045AC + 0.0136BC – 0.0703A2 – 0.0588B2 – 0.0601C2 |
|
TFC |
Y = -421.9567 + 7.8442A + 3.8914B + 6.6519C + 0.0055AB + 0.0050AC + 0.0069BC – 0.0750A2 – 0.0395B2 – 0.0643C2 |
A statistical method based on ANOVA was used to obtain the coefficient of determination (R2) which were 0.9982 and 0.9993 for TPC and TFC, respectively. The R2 obtained showed that over 99% of the response variables could be modeled by the RSM model, which is considered good fit with good correlation (R2>0.9) by Jumbri et al. and Hamzaoui et al.[23,24] The high values of R2 suggested that the developed quadratic polynomials models agreed well with the CCRD design. These results confirmed the predictability of the models in determining the optimum conditions to get the highest TFC and TPC of N. arbortristis leaves extracts (Figure 6 and Figure 7).
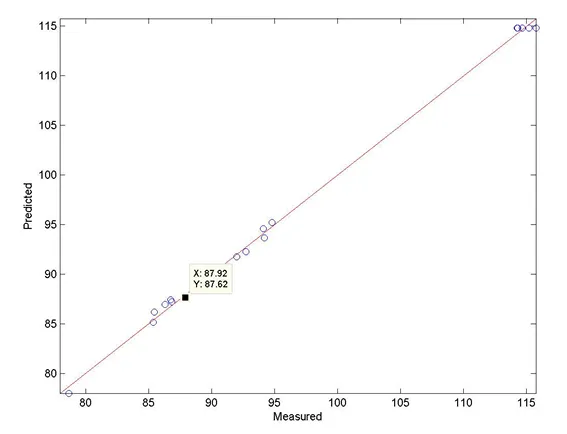
Figure 6: Comparison Between Predicted and Actual Values of Response Variable TPC
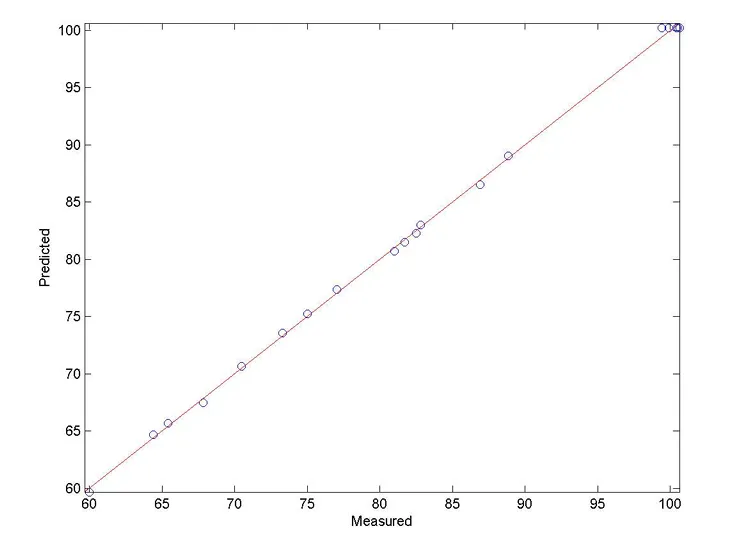
Figure 7: Comparison Between Predicted and Actual Values of Response Variable TFC
The regression analysis and ANOVA used in model fitting design are presented in Tables 5 and 6, to study the statistical significance of the terms for all the responses. The probability (p value) was relatively low for both the model responses (<0.0001) with a value less than 0.05 showing the significance of the models. A small p value indicates that the independent variables have a significant impact on the respective response variables.[25] The p values for A2, B2 and C2 were below 0.01, which means that there is a highly significant curvilinear effect on the TFC and TPC. Model F-value is a measure of the level of the actual experimental data signal (signal) relative to the random background noise. If the F-value is large (usually above 4.0, but preferably much larger) it means that the chemical/physical factors are causing variations that strongly overpower the background laboratory error. Likewise, when adjusted R2 is greater than 0.80, then it is mathematically proven that the model is very precise and very predictive. The F-values are extremely high in both TPC and TFC and the Adj. R2 values are greater than 0.80 so, our models have a good precision and predictive power.
Table 5: ANOVA for Quadratic Model of TPC
|
Source |
Sum of Squares |
df |
Mean Square |
F-value |
p-value |
|
|
Model |
2777.3 |
9 |
308.6109 |
557.9832 |
< 0.0001 |
Significant |
|
A-Temp. |
|
1 |
|
|
2.8141 X 10⁻⁶ |
Significant |
|
B-Time |
|
1 |
|
|
1.1558 X 10⁻⁵ |
Significant |
|
C-Solvent |
|
1 |
|
|
5.2245 X 10⁻⁶ |
Significant |
|
AB |
|
1 |
|
|
2.9258 X 10⁻⁴ |
Significant |
|
AC |
|
1 |
|
|
0.0468 |
Significant |
|
BC |
|
1 |
|
|
0.8776 X 10⁻⁴ |
Significant |
|
A2 |
|
1 |
|
|
5.2391 X 10⁻⁷ |
Significant |
|
B2 |
|
1 |
|
|
1.0747 X 10⁻⁶ |
Significant |
|
C2 |
|
1 |
|
|
9.7985 X 1075 |
Significant |
|
Residual |
4.9777 |
9 |
0.5531 |
|
|
|
|
Lack of Fit |
3.3803 |
5 |
0.6761 |
1.6928 |
0.3151 |
|
|
Pure Error |
1.5975 |
4 |
0.3994 |
|
|
|
|
Cor Total |
2782.5 |
18 |
|
|
|
|
|
R2 |
0.9982 |
|
|
|
|
|
|
Adj. R2 |
0.9964 |
|
|
|
|
|
Table 6: ANOVA for Quadratic Model of TFC
|
Source |
Sum of Squares |
df |
Mean Square |
F-value |
p-value |
Significance |
|
Model |
3272.7 |
9 |
363.6371 |
1531.0 |
< 0.0001 |
Significant |
|
A-Temp. |
|
1 |
|
|
2.1795 X 10⁻⁶ |
Significant |
|
B-Time |
|
1 |
|
|
1.6175 X 10⁻⁵ |
Significant |
|
C-Solvent |
|
1 |
|
|
1.9081 X 10⁻⁶ |
Significant |
|
AB |
|
1 |
|
|
0.0119 |
Significant |
|
AC |
|
1 |
|
|
0.0165 |
Significant |
|
BC |
|
1 |
|
|
0.0053 |
Significant |
|
A2 |
|
1 |
|
|
1.6435 X 10⁻⁷ |
Significant |
|
B2 |
|
1 |
|
|
2.1228 X 10⁻⁶ |
Significant |
|
C2 |
|
1 |
|
|
3.0381 X 10⁻⁷ |
Significant |
|
Residual |
2.1377 |
9 |
0.2375 |
|
|
|
|
Lack of Fit |
1.1200 |
5 |
0.2240 |
0.8805 |
0.5648 |
|
|
Pure Error |
1.0177 |
4 |
0.2544 |
|
|
|
|
Cor Total |
3274.9 |
18 |
|
|
|
|
|
R2 |
0.9993 |
|
|
|
|
|
|
Adj. R2 |
0.9987 |
|
|
|
|
|
The predicted R-square (R2) value is the measure of the regression model's ability to predict the response values, whereas the adjusted R-square (Adj. R2) value is the measure of the descriptive power of the regression model, including the various numbers of the variables. All variables that are included in a model increases the R2 value, whether or not they are significant statistically. So, it follows that the Adj. R2 value is significant for determining the adequacy of the model as the value tally only increases if the variables improve the model beyond what can normally be achieved by probability. According to Koocheki et al., If the Adj. R2 is greater than 0.9, this may be used as an indicator of how well the model performs.[26]
The validity of the models can also be confirmed by the Lack of Fit analysis, where a significant p value (less than 0.05) is indicative of the inadequacy of the model but a non-significant p value (more than 0.05) indicates that the model can accurately fit with the actual data.[27] The Lack of Fit p-value for both TPC and TFC is statistically insignificant (0.1047 and 0.5648, respectively), therefore, the model can be considered a good fit. It also indicates that both the developed quadratic polynomial models are reliable and accurate for predicting the relevant responses.
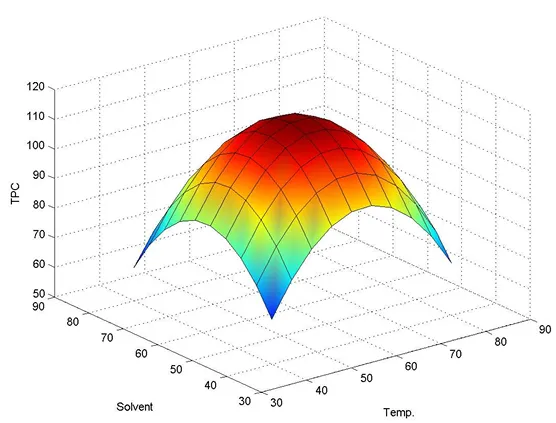
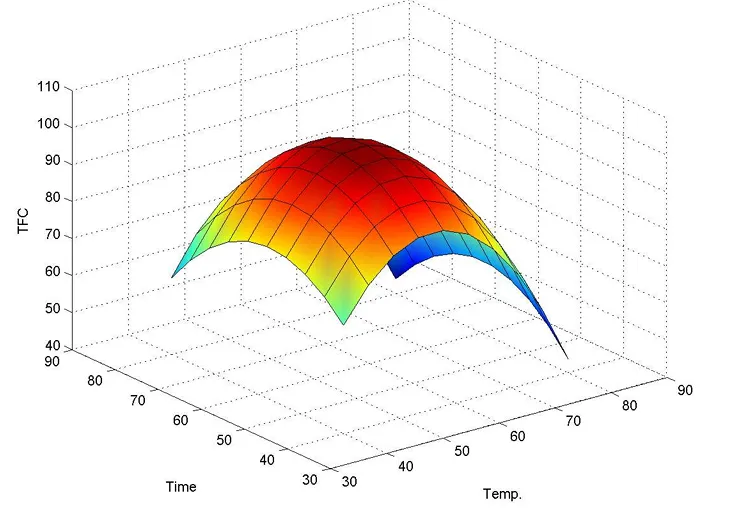
By taking the three-dimensional (3D) response surface images, the mutual influence of any two independent variables on the dependent variable with the other variables being at 0 level can be seen and the shape of the 3D response surface plots can be used to gain information about the influence degree. In other words, the interaction between two independent variables on the dependent variable is usually captured by elliptical or saddle shaped 3D surfaces and is relatively significant, while a surface with a gentle slope corresponds to a relatively weak interaction between the two factors on the dependent variable.[28,29]
The 3D graphical representations in Figure 8 and 9 describe the interactive effects that the independent variables have on the yields of TPC and TFC, respectively. A steeper incline within these visual depictions signifies a more pronounced interaction between the paired factors, thereby highlighting their collective potency in modulating the response variable.[30] It was found that the p-value for the interactions including AC, BC and AB were less than 0.05 for both TPC and TFC, indicating that there was a significant interaction effects on the ultrasonic extraction rate.
(C)
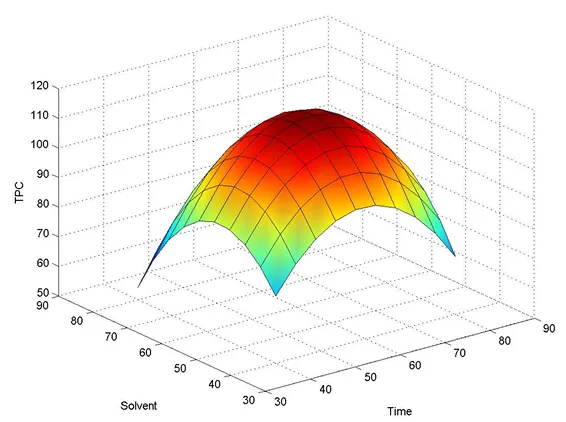
(B)
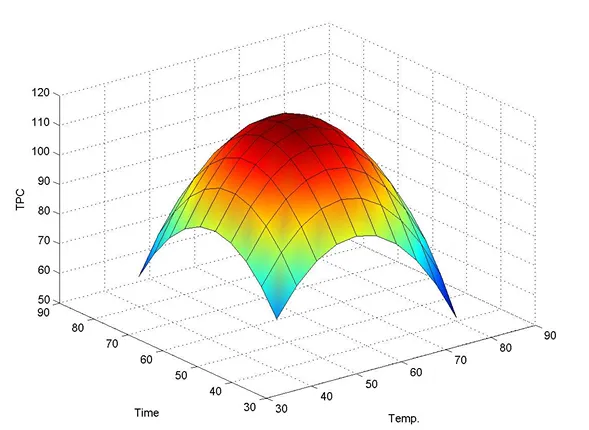
(A)
Figure 8: Response Surface 3D Plots of TPC. (A) The Interaction Effects of Temperature and Ultrasonic Time; (B) The Interaction Effects of Methanol Concentration and Ultrasonic Time; (C) The Interaction Effects of Methanol Concentration and Ultrasonic Temperature
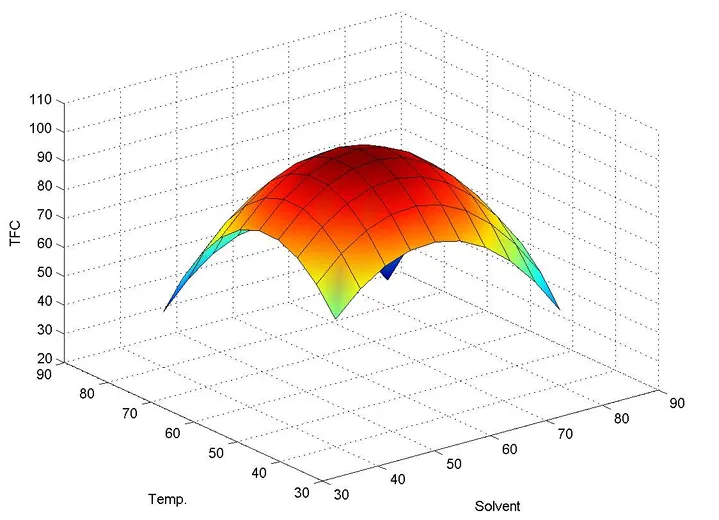
(C)
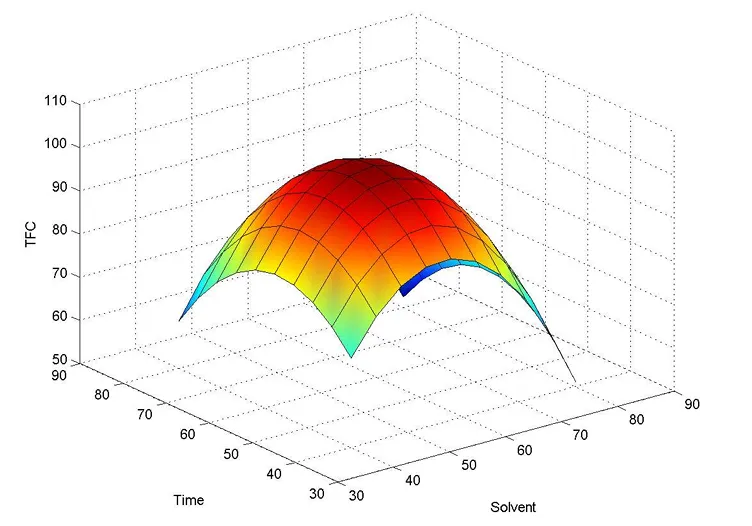
(B)
(A)
Figure 9: Response Surface 3D Plots of TFC. (A) The Interaction Effects of Temperature and Ultrasonic Time; (B) The Interaction Effects of Methanol Concentration and Ultrasonic Time; (C) The Interaction Effects of Methanol Concentration and Ultrasonic Temperature
Validation of the Optimized Model
The best extraction parameters determined by the RSM were found to be temperature (A) 60.07oC, ultrasonic exposure time (B) 61.44 minutes and methanol concentration (C) 58.57% for TPC whereas for TFC, these were found to be temperature (A) 56.32oC, an ultrasonic exposure duration (B) 58.12 minutes and methanol concentration (C) 57.02%. The theoretical TPC and TFC were found to be 114.93 mg/g and 101.76 mg g−1, respectively when optimized UAE conditions were used. Considering the limitations of the practical experiments, the experimental conditions were carefully adjusted for the validation experiment resulting in methanol concentration of 60%, experimental temperature of 60oC and an ultrasonic exposure time of 60 minutes. Subsequently, the confirmatory experiments were conducted under the optimized extraction conditions for the reliability test of the prediction model. Confirmatory experiments yielded satisfactory result with the TPC value of 115.21±0.14 mg g-1 and TFC value of 101.28±0.17 mg g-1 which closely matched with the theoretical value. Hence, it can be concluded that the regression model is suitable for optimization of UAE process from N. arbortristis.
Antioxidant Evaluation
The antioxidant activity of natural products can be easily and popularly determined by screening for DPPH radical scavenging activity. The method of DPPH radical scavenging was employed to evaluate the antioxidant activity. The plant extract was found to have a very strong DPPH inhibitory activity, which was dose dependent (Table 7). The DPPH radical scavenging potential of both ascorbic acid and the plant extract were found to be directly proportional to the concentration. Table 7 and Figure 10 show that the hydroalcoholic extract (extract obtained by methanol concentration of 60%, a temperature of 60oC and an ultrasonic exposure duration of 60 minutes) of N. arbortristis leaves yielded 73.43% antioxidant activity whereas the standard exhibited 87.57% at the same dose.
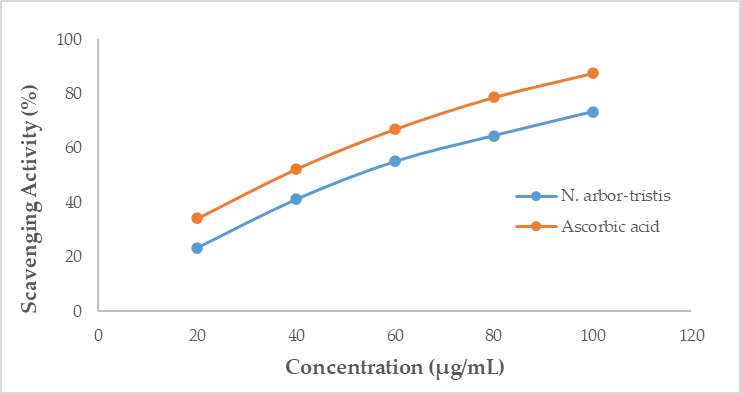
Figure 10: DPPH Radical Scavenging Activity of Hydroalcoholic Extract of N. arbortristis
Table 7: DPPH Radical Scavenging Activity of Ascorbic Acid and Hydroalcoholic Extract of N. arbortristis
|
Concentration (µg/mL) |
% Inhibition of Ascorbic Acid |
% Inhibition of N. arbortristis |
|
20 |
34.21 ± 1.23 |
23.36 ± 2.39 |
|
40 |
52.37 ± 2.59 |
41.15 ± 1.61 |
|
60 |
67.05 ± 4.32 |
55.10 ± 0.91 |
|
80 |
78.74 ± 1.37 |
64.63 ± 3.26 |
|
100 |
87.57 ± 1.16 |
73.43 ± 1.37 |
The antioxidant screening results indicate that DPPH radicals were reduced in power. The hydroalcoholic extract of N. arbortristis was shown to have an IC50 (inhibitory concentration 50%) value of 57.52 μg/mL for DPPH radical scavenging activity, which was higher than that of ascorbic acid (38.98 μg/mL). The plant extract was shown to have an appreciable dose dependent inhibition of DPPH activity. The study suggests that the extract possesses proton donating property and suggests its potential application as proton donor, in the form of free radical inhibitor or scavenger.
CONCLUSION
Nyctanthes arbortristis is one of the important medicinal plants used in the treatment of various ailments such as skin diseases, hair loss, ulcers, piles, rheumatism, liver diseases and malarial fevers. It has also been found to have anti-inflammatory, anticonvulsant, anticancer, hepatoprotective, antioxidant and wound healing properties. Preliminary phytochemical screening of methanolic leaves extract of N. arbortristis revealed the presence of carbohydrates, alkaloids, flavonoids, phenolic compounds/tannins, glycosides, saponins and terpenoids.
This study was aimed to stepwise optimize the extraction conditions like solvent concentration, time duration and operating temperature of UAE technique. The three factor-five level central composite rotatable design (CCRD) was used to develop response surface methodology (RSM) model and to evaluate the optimum extraction conditions of N. arbortristis leaves. ANOVA was used to statistically verify the model. Each of the independent variables gave a significant effect (p < 0.05) on all the responses, thus revealing that all of the extraction parameters used in this study were important in the optimization process.
The R2 values for the two responses, i.e. total phenolic content (TPC) and total flavonoid content (TFC) were 0.9982 and 0.9993 respectively, indicating that the quadratic polynomial models developed were satisfactory and could be used in the analysis of the interactions among the parameters. For economical evaluation, the optimum conditions obtained from RSM (extraction temperature (56-61°C), extraction time (58-62 min), solvent ratio (57-59% v/v) of the methanol-water used) can be used for future upscale extraction process of N. arbortristis leaves. The antioxidant activity of N. arbortristis was also measured in vitro by using 1,1-diphenyl-2-picrylhydrazyl (DPPH) assay method. The hydroalcoholic extract of N. arbortristis was shown to have an IC50 value of 57.52 μg/mL for DPPH radical scavenging activity, which was higher than that of ascorbic acid (38.98 μg/mL). The result obtained with the DPPH assay suggests that the extract has excellent antioxidant activity, which means that the leaf extract could be used as a good source of natural antioxidants and may be useful in preventing diseases associated with oxidative stress.
CONFLICTS OF INTEREST
All the authors declare no conflicts of interest.
REFERENCES

Manpreet Kaur, Arvinder Pal Singh*, Mona Piplani , Optimization Of Ultrasound Assisted Extraction Parameters Of Nyctanthes Arbortristis, Int. J. of Pharm. Sci., 2026, Vol 4, Issue 9, 3517-3537. https://doi.org/10.5281/zenodo.23010860
 10.5281/zenodo.23010860