

We use cookies to ensure our website works properly and to personalise your experience. Cookies policy
Department of Pharmacognosy, Bharat Technology, Uluberia, Howrah
The plant Zamioculcas zamiifolia is extensively grown as an ornamental plant while its pharmacognosy and pharmacological potentials remain underexplored. The current study assessed the pharmacognosy properties, phytochemical profile, antioxidant activity, and ?-amylase inhibitory activity of Zamioculcas zamiifolia leaf extract. Methods: The leaves collected from a local nursery/market in Uluberia, Howrah were shade dried and powdered and extracts prepared using different solvents. The extract chosen was then evaluated for physicochemical properties, preliminary phytochemical screening, total phenolic content (TPC), total flavonoid content (TFC), TLC, Fourier-transform infrared spectroscopy (FT-IR), DPPH radical scavenging assay, and ?-amylase inhibition assay. Ascorbic acid and acarbose were considered as standards for antioxidant and ?-amylase assay, respectively. Results: The extraction yields observed were 10.17% for methanolic extract, 9.45% for petroleum ether extract, 5.77% for ethyl acetate extract and 15.72% for aqueous extract. The extract chosen exhibited a TPC of 180.606 µg GAE/mg extract and TFC of 61.9 µg QE/mg extract. The DPPH radical scavenging activity increased from 15.38 ± 0.22% at 20 µg/mL to 67.27 ± 0.47% at 100 µg/mL, and IC50 of 67.98 µg/mL. The ?-amylase inhibition increased from 25.44 ± 1.01% to 56.39 ± 0.06%, with an IC50 of 78.37 µg/mL. Conclusion: The results reveal moderate antioxidant and ?-amylase inhibitory activity of the leaf extract. The results suggest further isolation, mechanisms, toxicity and in vivo studies.
Zamioculcas zamiifolia, commonly known as the ZZ plant or Zanzibar gem, is an ornamental member of the family Araceae and is valued for its glossy foliage, drought tolerance and ability to persist under low-light conditions. The species is native to eastern and southern Africa and has become an important indoor foliage plant.
Although the plant is primarily cultivated for ornamental purposes, previous investigations have reported phytochemicals and biological activities that justify further pharmacognostic and pharmacological evaluation. Natural products have been identified from Z. zamiifolia, and root extracts have shown antioxidant activity in chemical assays. Phenolic compounds and flavonoids are of particular interest because they can contribute to free-radical scavenging and other biological effects.
Oxidative stress results from an imbalance between oxidant generation and antioxidant defenses and can damage lipids, proteins and nucleic acids. Antioxidant assays such as DPPH provide a rapid in vitro measure of radical-scavenging capacity. In diabetes research, inhibition of carbohydrate-digesting enzymes such as α-amylase is commonly investigated as an in vitro strategy for assessing the potential to reduce the rate of starch hydrolysis and postprandial glucose release.
The present study was therefore undertaken to establish basic pharmacognostic parameters of Zamioculcas zamiifolia leaves, characterize the phytochemical composition of the extracts, quantify phenolic and flavonoid contents, and evaluate antioxidant and α-amylase inhibitory activities. The work is intended as preliminary experimental evidence for future isolation and mechanistic studies rather than as proof of clinical antidiabetic efficacy.
MATERIALS AND METHODS:
1. Plant Material and Extraction: -
Zamioculcas zamiifolia was collected from a local market and nursery area of Uluberia, Howrah, West Bengal, India. The plant material was washed with running tap water followed by distilled water, cut into small pieces and shade-dried at approximately 25°C –30°C for 10–15 days. Direct sunlight was avoided to minimize degradation of thermolabile and photosensitive constituents. The dried material was pulverized, sieved and stored in an airtight container before extraction.
For maceration, 20 g of powdered material was treated separately with 200 mL of ethanol, petroleum ether, ethyl acetate or water for 72 h at room temperature. The macerates were filtered through muslin cloth and Whatman No. 1 filter paper and concentrated. Soxhlet extraction was also described in the source report using solvents of increasing polarity, beginning with petroleum ether. The percentage yield was calculated as: (weight of dried extract/weight of dried plant material) × 100. The report subsequently identifies the methanolic extract as the extract used for the principal biological evaluation; however, one Results/Discussion passage describes the selected extract as ethanolic. This solvent designation should be confirmed from the laboratory record before submission.
2. Pharmacognostic and Physicochemical Evaluation: -
Macroscopic characteristics of the leaves, stems and roots were recorded. Total ash, water-soluble ash, acid-insoluble ash, moisture content, water-soluble extractive value and alcohol-soluble extractive value were determined using the procedures described in the project report. These parameters were used as preliminary quality-control characteristics for the crude plant material.
3. Preliminary Phytochemical Screening: -
The extracts were screened qualitatively for alkaloids, flavonoids, saponins, tannins, glycosides, proteins and carbohydrates using standard qualitative reactions including Dragendorff's/Wagner's tests, Shinoda and ferric chloride tests, foam test, Keller–Kiliani test, Biuret test and Molisch's test. Results were recorded semi-quantitatively using plus signs to indicate the observed intensity.
4. Total Phenolic Content: -
Total phenolic content was determined by the Folin–Ciocalteu colorimetric method. Plant extract or gallic acid standard (0.5 mL) was mixed with 2.5 mL of 10% Folin–Ciocalteu reagent, allowed to stand for 5 min, followed by addition of 2 mL of 7.5% sodium carbonate. After incubation for 30 min in the dark at room temperature, absorbance was measured at 765 nm. TPC was expressed as µg gallic acid equivalents (GAE) per mg of dry extract based on the reported calibration curve.
5. Total Flavonoid Content: -
Total flavonoid content was determined using an aluminium chloride colorimetric method. The extract was prepared at 1 mg/mL; 1 mL of extract was mixed with 1 mL of 2% aluminium chloride and incubated for 15 min at room temperature. Absorbance was measured at 415 nm against the blank. Quercetin was used for calibration and TFC was expressed as µg quercetin equivalents (QE) per mg of dry extract.
6. Thin-Layer Chromatography and FTIR: -
TLC was performed on a 10 × 2 cm plate using ethyl acetate:formic acid:glacial acetic acid:water (10:1.1:1.1:3) as the mobile phase. Separated bands were visualized under UV light and Rf values were calculated as the distance travelled by the compound divided by the distance travelled by the solvent front. FT-IR analysis was performed on the dried extract using a KBr pellet and a reported scanning range of 4000–400 cm¹. Characteristic absorption bands were interpreted in relation to common functional groups.
7. DPPH Radical-Scavenging Assay: -
A 0.1 mM DPPH solution was prepared in methanol. Extract and ascorbic acid were tested at 20, 40, 60, 80 and 100 µg/mL. One millilitre of test solution was mixed with 1 mL DPPH solution and incubated in the dark at room temperature for 30 min. Absorbance was measured at 517 nm. The assay was performed in triplicate. Radical-scavenging activity (RSA) was calculated as: % inhibition = [(Acontrol − Asample)/Acontrol] × 100. IC50 was reported as the concentration required to achieve 50% radical-scavenging activity.
8. α-Amylase Inhibition Assay: -
The α-amylase assay used α-amylase (1 U/mL), 1% soluble starch, 0.02 M phosphate buffer (pH 6.9), DNSA reagent and acarbose as the standard. Five hundred microlitres of extract was mixed with 500 µL enzyme solution and incubated at 25 °C for 10 min. Five hundred microlitres of starch solution was then added and the mixture was incubated for a further 10 min. The reaction was stopped with 1 mL DNSA reagent, followed by heating in a boiling water bath for 5 min, cooling and dilution with 10 mL distilled water. Absorbance was measured at 540 nm. Percentage inhibition was calculated as
[(Acontrol − Asample)/Acontrol] × 100.
9. Statistical Presentation: -
The source report presents assay measurements in triplicate as mean ± standard deviation (SD). Calibration equations and reported IC50 values were retained from the project report without replacing them with new statistical models.
RESULTS:
Macroscopical evaluation:
1. Leaf – Leaves are alternate, pinnately compound, glossy, dark green, leathery, and evergreen. Each leaf is 40–60 cm long and bears 6–12 pairs of opposite or sub opposite leaflets along a thick rachis.
2. Stem – thick, smooth, succulent leaf stalks (petioles) that appear stem-like. They are green, erect, cylindrical, and slightly swollen at the base.
3. Root – Thick, fleshy, fibrous adventitious roots arising from underground rhizomes. The roots are white to cream-colored.
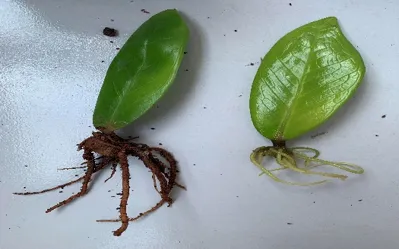
Fig no. 1 – Leaf, Root & Stem of Zz plant
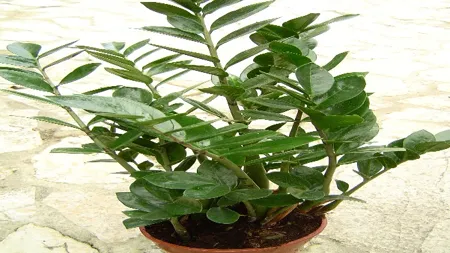
Fig no. 2 – Zz Plant
Percentage of Yield:
Table No. 1– Weight of crude drug & % of yield of Crude drug
|
Plant extract |
Wight of crude drug (Gram) |
Wight of extract material (Gram) |
Percentage of yield (%) |
|
Methanolic Extract |
30 g |
3. 051g |
10.17% |
|
Petroleum Ether Extract |
30 g |
2.837 g |
9.45% |
|
Ethly Acetate Extract |
30 g |
1.731 g |
5.77 % |
|
Water Extract |
30 g |
4.716 g |
15.72% |
Phytochemical Screening:
Table No. 2 – Phytochemical screening, (+) sign mean present & (-) sign means absent
|
|
Alkaloid |
Flavonoid |
Saponin |
Tannin |
Glycoside |
Protein |
Carbohydrate |
|
Methanolic Extract |
- |
+++ |
- |
+++ |
+++ |
+++ |
+++ |
|
Ethyl acetate Extract |
- |
++ |
- |
++ |
++ |
++ |
++ |
|
Chloroform Extract |
- |
+ |
- |
+ |
++ |
+ |
++ |
|
Aqueous extract |
- |
+ |
-_ |
+ |
++ |
+ |
++ |
Physical Evaluation:
Table No. 3 – Physical evaluation. The value expressed as Mean ± SD (n = 3)
|
SR. NO |
Parameters |
Percentage (%) |
|
1. |
Total Ash value |
7.39±0.07 |
|
2. |
Water soluble ash value |
2.58±0.04 |
|
3. |
Acid insoluble ash value |
2.75±0.02 |
|
4. |
Moisture content |
8.63±0.08 |
|
5. |
Water soluble extractive value |
39.47±0.93 |
Total Phenolic Content:
Table No. 4 – Absorbance of Gallic acid in different concentration
|
SR. NO |
Concentration of Gallic Acid (PPM) |
Absorbance (nm) |
|
1. |
50 ppm |
0.58 |
|
2. |
100 ppm |
1.05 |
|
3. |
150 ppm |
1.43 |
|
4. |
200 ppm |
1.77 |
|
5. |
250 ppm |
2.03 |
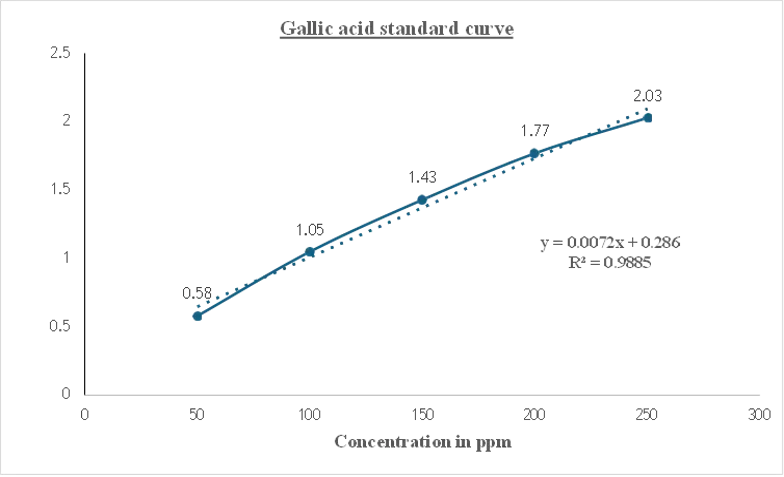
Fig no. 3 – Standard calibration Graph of Gallic acid
Calculation –
From this standard calibration graph the curve equation is find that the
Y= 0.0072x + 0.286. The plant sample absorbance is 1.652nm, 1.655nm, 1.651nm.
So mean is 1.652nm.
X= (Y - 0.286)/0.0072. Putting Y value = 1.652
X= (1.652 - 0.286)/0.0072 = 189.722
In 1 mg (1000 μg) of the plant extract the Total phenolic content is present
= 189.722 μg
the percentage of Total phenolic content is (189.722/1000) *100 = 18.97%
Total Flavonoid Content:
Table no. 5 – Absorbance of Quercetin In different concentration
|
SR. NO |
Concentration (PPM) |
Absorbance (nm) |
|
1. |
50 |
0.115 |
|
2. |
100 |
0.152 |
|
3. |
150 |
0.186 |
|
4. |
200 |
0.231 |
|
5. |
250 |
0.276 |
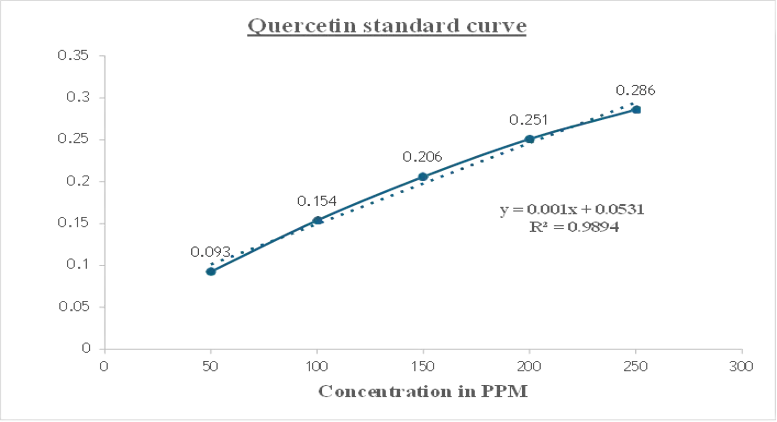
Fig no. 4 – Standard calibration graph of Quercetin
Calculation –
From this standard calibration graph the curve equation is find that the
Y = 0.001x + 0.0531. The plant sample absorbance is 0.117nm, 0.116nm, 0.115nm.
So mean is 0.115nm.
X = (Y- 0.0531)/0.001. Putting Y value = 0.115
X = (0.115 - 0.0531)/0.001 = 61.9
In 1 mg (1000 μg) of the plant extract the Total phenolic content is present = 61.9 μg
So, the percentage of Total phenolic content is (61.9/1000) *100 = 6.19%
Table no. 6 – Amount of TPC & TFC of plant extract
|
Sample |
TPC (μg GAE/mg of extract) |
TFC (μg QE/mg of extract) |
|
Plant extract |
180.606 |
61.9 |
Thin Layer Chromatography:
Size of TLC plate – Length (Height) – 10 cm & Width - 2 cm
Ethyl acetate: Formic acid: Glacial acetic acid: Water = 10:1.1:1.1:3
Table no. 7 – Rf value determination & identify compounds presences
|
SR. NO |
Spot |
Rf value |
Observation |
|
1. |
Lower dark band near origin |
0.08 |
Highly polar compound present for close to the origin due to strong interaction with silica gel. |
|
2. |
Lower yellow band |
0.25 |
More polar constituent present for moderate movement. |
|
3. |
Middle dark band |
0.39 |
Moderately polar for Intermediate migration on the TLC plate. |
|
4. |
First yellow band |
0.52 |
Moderately non-polar, migrated farther, indicating lower polarity. Flavonoid/phenolic compound present may be. |
|
5. |
Second bright yellow band |
0.61 |
High migration suggesting a relatively non-polar compound Flavonoid-like compound |
|
6. |
Upper top dark blue band |
0.80 |
Migrated close to the solvent front, indicating a highly non-polar constituent. |
FTIR Spectroscopy:
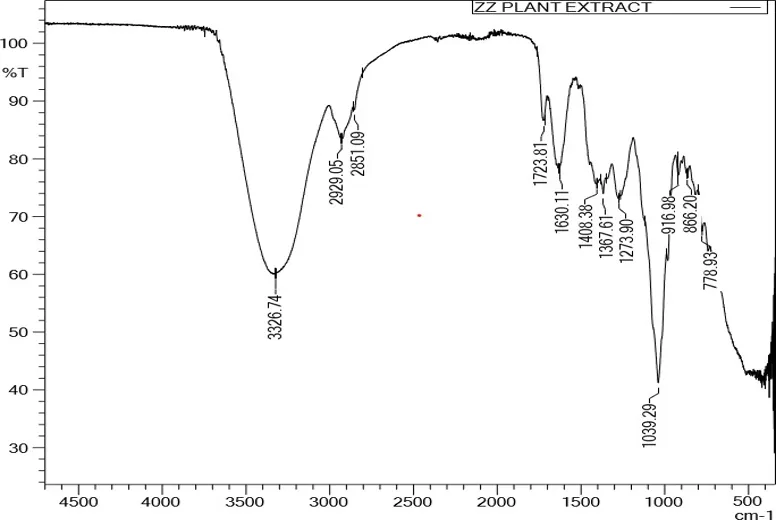
Fig no 5 - FT-IR spectrum of methanolic extract of Zz plant
Table no. 8 – Interpretation of FT-IR peaks & Functional groups of plant extract
|
Peak (cm ¹) |
Functional-group assignment |
Reported Possibility |
|
3326.74 |
O–H stretching |
Phenols, flavonoids, tannins |
|
2929.05 |
C–H asymmetric stretching |
Alkanes, terpenoids, lipids |
|
2851.09 |
C–H symmetric stretching |
Alkanes, fatty acids |
|
1723.81 |
C=O stretching |
Esters, aldehydes, ketones |
|
1630.11 |
C=C stretching / amide I |
Aromatic compounds, proteins |
|
1408.38 |
C–H bending |
Phenolic compounds |
|
1367.61 |
CH₃ bending |
Terpenoids, alkanes |
|
1273.90 |
C–O stretching |
Alcohols, phenols, ethers |
|
1039.29 |
C–O–C / C–O stretching |
Carbohydrates, glycosides |
|
916.98 |
=C–H bending |
Alkenes |
|
866.20 |
Aromatic C–H bending |
Aromatic compounds |
|
778.93 |
C–H out-of-plane bending |
Aromatic ring compounds |
Antioxidant In vitro Assay:
DPPH Assay of Ascorbic acid (Standard) –
Table no. 9 - % RSA of Ascorbic acid assay at different concentration
|
Concentration (PPM) |
Abs-1 (nm) |
Abs-2 (nm) |
Abs-3 (nm) |
%RSA-1 |
%RSA-2 |
%RSA-3 |
Mean (%RSA) |
Standard deviation |
|
20 |
0.271 |
0.269 |
0.268 |
38.69 |
39.15 |
39.37 |
39.07 |
0.35 |
|
40 |
0.205 |
0.203 |
0.201 |
53.62 |
54.07 |
54.52 |
54.07 |
0.45 |
|
60 |
0.169 |
0.167 |
0.165 |
61.76 |
62.23 |
62.67 |
62.22 |
0.46 |
|
80 |
0.117 |
0.118 |
0.119 |
73.53 |
73.30 |
73.07 |
73.31 |
0.23 |
|
100 |
0.084 |
0.083 |
0.082 |
80.98 |
81.24 |
81.62 |
81.28 |
0.32 |
DPPH Assay of Plant extract –
Table no. 10 – % RSA of plant extract assay at different concentration
|
Concentration (PPM) |
Abs-1 (nm) |
Abs-2 (nm) |
Abs-3 (nm) |
%RSA-1 |
%RSA-2 |
%RSA-3 |
Mean (%RSA) |
Standard deviation |
|
20 |
0.375 |
0.374 |
0.373 |
15.16 |
15.38 |
15.61 |
15.38 |
0.22 |
|
40 |
0.287 |
0.285 |
0.273 |
35.06 |
35.52 |
35.97 |
35.52 |
0.45 |
|
60 |
0.232 |
0.231 |
0.229 |
47.52 |
47.74 |
48.19 |
47.82 |
0.34 |
|
80 |
0.178 |
0.177 |
0.176 |
59.72 |
59.95 |
60.19 |
59.95 |
0.23 |
|
100 |
0.147 |
0.144 |
0.143 |
66.74 |
67.42 |
67.65 |
67.27 |
0.47 |
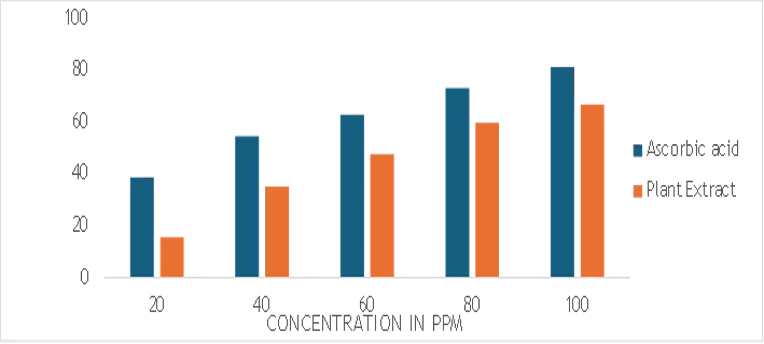
Fig no 6 – Bar graph of Ascorbic acid and plant extract DPPH radical scavenging activity
Antidiabetic In vitro Assay:
α-Amylase inhibition assay of Acarbose (standard) –
Table no 11 – α-Amylase inhibition activity of Acarbose at different concentration
|
Concentration (PPM) |
Abs-1 (nm) |
Abs-2 (nm) |
Abs-3 (nm) |
%inh-1 |
%inh-2 |
%inh-3 |
Mean (%inh) |
Standard deviation |
|
20 |
0.967 |
0.965 |
0.963 |
36.38 |
36.51 |
36.65 |
36.51 |
0.13 |
|
40 |
0.728 |
0.726 |
0.725 |
52.12 |
52.24 |
52.35 |
52.23 |
0.12 |
|
60 |
0.559 |
0.558 |
0.556 |
63.24 |
63.29 |
63.43 |
63.32 |
0.09 |
|
80 |
0.433 |
0.432 |
0.431 |
71.51 |
71.58 |
71.65 |
71.58 |
0.07 |
|
100 |
0.317 |
0.315 |
0.314 |
79.15 |
79.28 |
79.35 |
79.26 |
0.11 |
α-Amylase inhibition assay of plant extract –
Table no.12– α-Amylase inhibition activity of Plant extract at different concentration
|
Concentration (PPM) |
Abs-1 (nm) |
Abs-2 (nm) |
Abs-3 (nm) |
%inh-1 |
%inh-2 |
%inh-3 |
Mean (%inh) |
Standard deviation |
|
20 |
1.15 |
1.13 |
1.12 |
24.34 |
25.67 |
26.31 |
25.44 |
1.01 |
|
40 |
0.951 |
0.949 |
0.948 |
37.43 |
37.56 |
37.63 |
37.54 |
0.11 |
|
60 |
0.824 |
0.823 |
0.821 |
45.79 |
45.85 |
45.98 |
45.87 |
0.09 |
|
80 |
0.755 |
0.754 |
0.751 |
50.32 |
50.39 |
50.61 |
50.44 |
0.15 |
|
100 |
0.664 |
0.663 |
0.662 |
56.32 |
56.38 |
56.45 |
56.39 |
0.06 |
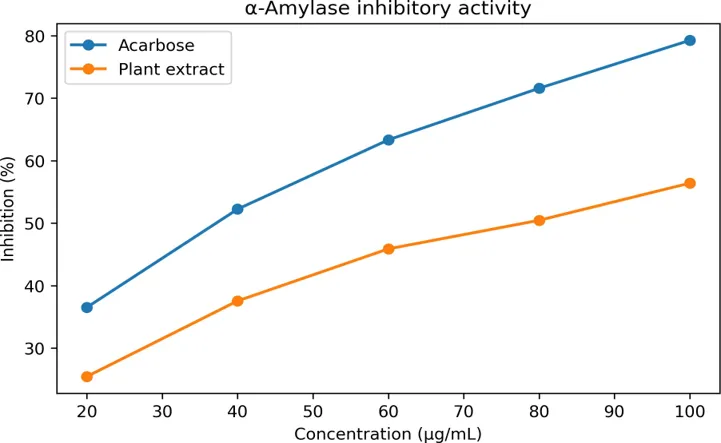
Fig no. 7 - Concentration-Dependent α -Amylase Inhibition by Acarbose and Plant Extract.
Table no 13 – Comparison % Inhibition & IC50 of both Acarbose & Plant extract
|
Concentration (µg/ml) |
% Inhibition of Acarbose |
% Inhibition of Plant Extract |
|
20 |
36.51 ± 0.13 |
25.44 ± 1.01 |
|
40 |
52.23 ± 0.12 |
37.54 ± 0.11 |
|
60 |
63.32 ± 0.09 |
45.87 ± 0.09 |
|
80 |
71.58 ± 0.07 |
50.44 ± 0.15 |
|
100 |
79.25 ± 0.11 |
56.39 ± 0.06 |
|
IC 50 VALUE (µg/ml) |
40.13 |
78.37 |
The extract inhibited α-amylase in a concentration-dependent manner, increasing from 25.44 ± 1.01% at 20 µg/mL to 56.39 ± 0.06% at 100 µg/mL. Acarbose produced stronger inhibition throughout the concentration range. The reported IC50 values were 78.37 µg/mL for the extract and 40.13 µg/mL for acarbose. These results indicate moderate in vitro α-amylase inhibitory activity. Because the experiment was an enzyme assay rather than an animal or clinical study, the findings should be interpreted as preliminary evidence of antidiabetic potential and not as evidence of therapeutic efficacy.
DISCUSSION:
The pharmacognostic findings and physicochemical parameters provide preliminary quality-control characteristics for Zamioculcas zamiifolia leaf material. The extraction yields differed among solvents, with the aqueous extract giving the highest reported yield, while the methanolic extract was described as the selected extract for subsequent phytochemical and biological evaluation.
The qualitative phytochemical screening and FT-IR profile indicate the presence of several classes of constituents, including phenolic/flavonoid-related and other oxygenated functionalities. The measured total phenolic and flavonoid contents provide a chemical basis for the observed DPPH radical-scavenging activity. However, the present study does not establish which individual constituent is responsible for the activity. The concentration-dependent inhibition of α-amylase indicates preliminary enzyme-inhibitory potential. The extract was less active than acarbose under the reported conditions. Taken together with the antioxidant findings, the results justify further mechanistic and in vivo investigation, but they should not be interpreted as evidence of clinical antidiabetic efficacy.
CONCLUSION
The present study provides preliminary pharmacognostic, phytochemical and in vitro biological evidence for Zamioculcas zamiifolia leaves. The extract showed measurable phenolic and flavonoid contents, multiple chromatographic constituents and FT-IR bands consistent with oxygenated and aromatic phytochemicals. DPPH activity was concentration dependent, with a reported IC50 of 67.98 µg/mL, while α-amylase inhibition was also concentration dependent, with a reported IC50 of 78.37 µg/mL. The extract was less active than ascorbic acid and acarbose, respectively, but demonstrated appreciable antioxidant and
moderate α-amylase inhibitory activity. Further work should include isolation and structural characterization of active constituents, validated enzyme kinetics, additional antidiabetic targets such as α-glucosidase, cytotoxicity/toxicity assessment, and in vivo studies. These steps are necessary before any therapeutic or clinical claims can be made.
ACKNOWLEDGEMENTS:
A lot of people assisted me in this dissertation either directly or indirectly, and now is the time to thank everyone for their contribution. My sincere appreciation goes to my Guide, Mr. Karan Kumar Das, Assistant Professor of Department of Pharmaceutical Chemistry, for his valuable assistance and cooperation in time. He served as a beacon of hope for me. It gives me immense pleasure to acknowledge the continuous support and encouragement from our principal, Dr. Biplab Debnath.
REFERENCES


Subhadip Acharya, Arpan Roy, Surjyakanta Barui, Saptak Dhank, Prospects of Zamioculcas zamiifolia in the Field of Diabetes Mellitus, Int. J. of Pharm. Sci., 2026, Vol 4, Issue 8, 4502-4512. https://doi.org/10.5281/zenodo.22125104
 10.5281/zenodo.22125104