

We use cookies to ensure our website works properly and to personalise your experience. Cookies policy
DJPS College of Pharmacy, Pathri, Parbhani.
Analytical Quality by Design (AQbD) is a systematic, science-based, and risk-oriented approach that enhances method understanding, robustness, and regulatory flexibility in pharmaceutical analysis [1–4]. AQbD integrates risk assessment and statistical optimization tools to develop reliable analytical methods with predefined performance characteristics [3–6]. Analytical Quality by Design (AQbD) is a systematic, science-based, and risk-oriented approach that enhances method understanding, robustness, and regulatory flexibility in pharmaceutical analysis [1–4]. AQbD integrates risk assessment and statistical optimization tools to develop reliable analytical methods with predefined performance characteristics [3–6]. An Analytical Target Profile (ATP) was established, and Critical Quality Attributes (CQAs) and Critical Method Parameters (CMPs) were identified through systematic risk assessment using Fishbone Diagram and Failure Mode and Effects Analysis (FMEA) [4–6]. Design of Experiments (DoE) was employed to optimize chromatographic conditions and establish a design space for robust analytical performance [5]. The developed RP-HPLC method was validated according to ICH Q2(R2) guidelines for specificity, linearity, accuracy, precision, robustness, limit of detection (LOD), and limit of quantification (LOQ) [7]. The developed AQbD-based RP-HPLC method was found to be simple, accurate, precise, robust, and reproducible for the simultaneous estimation of atorvastatin, ezetimibe, and fenofibrate. The method is suitable for routine quality control analysis and supports the application of AQbD principles in pharmaceutical analytical method development [2–4].
Pharmaceutical analysis plays a crucial role in ensuring the quality, safety, and efficacy of drug products throughout their lifecycle. The increasing complexity of pharmaceutical formulations, particularly fixed-dose combination products, necessitates the development of robust, reliable, and scientifically sound analytical methods. Regulatory agencies worldwide emphasize the importance of quality-focused pharmaceutical development to ensure consistent product performance and patient safety [1,2].In recent years, the concept of Quality by Design (QbD) has transformed pharmaceutical development from a traditional trial-and-error approach to a systematic, science-based, and risk-oriented methodology. QbD focuses on predefined objectives, product and process understanding, risk assessment, and continuous improvement throughout the product lifecycle [1,3]. The principles of QbD have been successfully extended to analytical method development through Analytical Quality by Design (AQbD), which ensures method robustness, reliability, and regulatory compliance [4,5].AQbD involves defining an Analytical Target Profile (ATP), identifying Critical Quality Attributes (CQAs) and Critical Method Parameters (CMPs), performing risk assessment, and applying statistical tools such as Design of Experiments (DoE) to establish a robust design space [5,6]. This approach provides a deeper understanding of analytical variables and minimizes method variability, thereby improving analytical performance and lifecycle management.
1.2 Quality by Design (QbD) Concept
Quality Target Product Profile (QTPP)
↓
Critical Quality Attributes (CQAs)
↓
Risk Assessment
↓
Design of Experiments (DoE)
↓
Design Space
↓
Control Strategy
↓
Continuous Improvement
Figure 1: Basic QbD Framework
QbD emphasizes building quality into a product rather than testing quality after development. The approach improves product understanding, reduces variability, and facilitates regulatory flexibility [1,3].
Analytical Quality by Design (AQbD)
Analytical Target Profile (ATP)
↓
Identification of CQAs
↓
Risk Assessment (FMEA/Fishbone)
↓
Selection of CMPs
↓
DoE Optimization
↓
Method Operable Design Region (MODR)
↓
Method Validation
↓
Lifecycle Management
Figure 2: AQbD Workflow
AQbD provides a structured framework for developing robust analytical methods and ensures consistent performance throughout the method lifecycle [4,5].
RP-HPLC in Pharmaceutical Analysis
Reverse Phase High-Performance Liquid Chromatography (RP-HPLC) is one of the most widely used analytical techniques for quantitative drug analysis. It offers:
RP-HPLC is extensively employed for assay determination, impurity profiling, stability studies, and quality control of pharmaceutical formulations [6].
Solvent Reservoir
↓
Pump
↓
Injector
↓
HPLC Column
↓
Detector (UV/PDA)
↓
Data System
Figure 3: Basic RP-HPLC System
Dyslipidemia and Combination Therapy
Dyslipidemia is characterized by abnormal levels of plasma lipids, including elevated cholesterol, triglycerides, and low-density lipoproteins (LDL), which significantly increase the risk of cardiovascular diseases. Combination therapy has become a preferred treatment strategy for effective lipid management because a single drug often fails to achieve desired lipid targets [7].
Drugs Selected for the Study
Atorvastatin
A statin that inhibits HMG-CoA reductase, reducing cholesterol synthesis and lowering LDL cholesterol levels.
Ezetimibe
A cholesterol absorption inhibitor that selectively blocks intestinal absorption of cholesterol.
Fenofibrate
A fibric acid derivative that activates PPAR-α receptors and primarily reduces triglyceride levels while increasing HDL cholesterol.
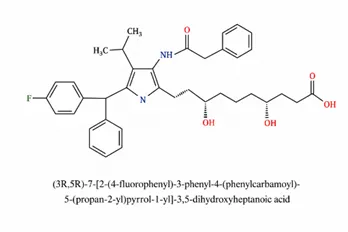
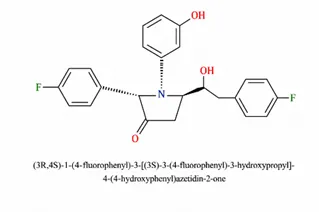
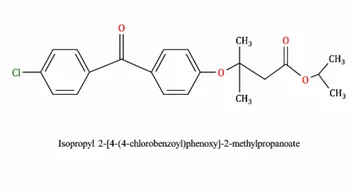
Figure: Structure of Atorvastatin Figure: Structure of Ezetimibe Figure: Structure of Fenofibrate
Atorvastatin
↓
Inhibits HMG-CoA Reductase
↓
↓ Cholesterol Synthesis
Ezetimibe
↓
Blocks NPC1L1 Transporter
↓
↓ Cholesterol Absorption
Fenofibrate
↓
Activates PPAR-α
↓
↓ Triglycerides & ↑ HDL
Figure 4: Mechanism of Action of Selected Drugs
Need for the Present Study
Although several analytical methods have been reported for individual and dual-component estimation of lipid-lowering agents, limited studies are available on AQbD-based RP-HPLC method development for the simultaneous estimation of atorvastatin, ezetimibe, and fenofibrate in combined dosage forms.
Most conventional analytical methods rely on trial-and-error optimization, which often leads to poor robustness and limited understanding of analytical variables. Regulatory authorities now encourage the implementation of AQbD principles for method development to improve reliability, reproducibility, and lifecycle management.
Therefore, there is a need to develop a robust AQbD-based RP-HPLC method capable of:
Goals of the Research
The primary goal of this research is to establish a scientifically sound and robust AQbD-based RP-HPLC analytical method for simultaneous estimation of atorvastatin, ezetimibe, and fenofibrate in pharmaceutical formulations.
The study aims to integrate risk assessment and statistical optimization tools to improve analytical performance and method reliability while complying with current regulatory expectations.
Research Objectives
Primary Objective
Specific Objectives
Literature Review
↓
ATP Definition
↓
Risk Assessment
↓
DoE Optimization
↓
Method Development
↓
Method Validation
↓
Results & Discussion
↓
Conclusion
Figure 5: Overall Research Plan
MATERIALS AND METHODS
The present study was designed to develop and validate an AQbD-based RP-HPLC method for the simultaneous estimation of atorvastatin, ezetimibe, and fenofibrate in pharmaceutical dosage forms. A systematic approach involving selection of analytical reagents, optimization of chromatographic conditions, risk assessment, Design of Experiments (DoE), and method validation was employed according to ICH guidelines.
Materials
Active Pharmaceutical Ingredients (APIs)
The reference standards of atorvastatin, ezetimibe, and fenofibrate were obtained as gift samples from a reputed pharmaceutical manufacturing company and were used without further purification.
Table 1: Active Pharmaceutical Ingredients
|
Sr. No. |
Drug |
Category |
|
1 |
Atorvastatin Calcium |
HMG-CoA Reductase Inhibitor |
|
2 |
Ezetimibe |
Cholesterol Absorption Inhibitor |
|
3 |
Fenofibrate |
Fibric Acid Derivative |
Chemicals and Reagents
All chemicals and solvents used during the study were of HPLC grade and analytical reagent grade.
Table 2: Chemicals and Reagents Used
|
Sr. No. |
Chemical/Reagent |
Grade |
Purpose |
|
1 |
Acetonitrile |
HPLC Grade |
Organic solvent |
|
2 |
Methanol |
HPLC Grade |
Diluent |
|
3 |
Orthophosphoric Acid |
AR Grade |
pH adjustment |
|
4 |
Potassium Dihydrogen Phosphate |
AR Grade |
Buffer preparation |
|
5 |
Water |
HPLC Grade |
Mobile phase preparation |
|
6 |
Nylon Membrane Filter (0.45 µm) |
HPLC Compatible |
Filtration |
Instruments and Equipment
The chromatographic analysis was performed using a Reverse Phase High Performance Liquid Chromatography system equipped with UV detector, autosampler, and chromatography software.
Table 3: Instruments Used
|
Sr. No. |
Instrument |
Model/Specification |
|
1 |
HPLC System |
Shimadzu LC-20AT |
|
2 |
UV Detector |
SPD-20A |
|
3 |
Analytical Balance |
Shimadzu AUX220 |
|
4 |
pH Meter |
Digital pH Meter |
|
5 |
Ultrasonic Bath |
Sonicator |
|
6 |
Membrane Filtration Assembly |
0.45 µm Filter Unit |
Chromatographic Conditions
Chromatographic conditions were optimized using AQbD principles and Design of Experiments.
Table 4: Optimized Chromatographic Conditions
|
Parameter |
Condition |
|
Column |
C18 Column (250 × 4.6 mm, 5 µm) |
|
Mobile Phase |
Acetonitrile : Phosphate Buffer (70:30 v/v) |
|
Flow Rate |
1.0 mL/min |
|
Detection Wavelength |
248 nm |
|
Injection Volume |
20 µL |
|
Column Temperature |
Ambient |
|
Run Time |
10 min |
|
Mode |
Isocratic |
Preparation of Mobile Phase
The phosphate buffer was prepared by dissolving accurately weighed potassium dihydrogen phosphate in HPLC-grade water and adjusting the pH using orthophosphoric acid. The buffer was filtered through a 0.45 µm membrane filter and degassed by sonication.
The mobile phase was prepared by mixing acetonitrile and phosphate buffer in the optimized ratio of 70:30 (v/v). The prepared mobile phase was filtered and sonicated before use.
Preparation of Standard Solutions
Preparation of Atorvastatin Stock Solution
Accurately weighed 10 mg of atorvastatin was transferred into a 10 mL volumetric flask. It was dissolved in methanol and diluted up to the mark to obtain a stock solution containing 1000 µg/mL.
Preparation of Ezetimibe Stock Solution
Accurately weighed 10 mg of ezetimibe was transferred into a 10 mL volumetric flask. Methanol was added and the volume was made up to obtain a concentration of 1000 µg/mL.
Preparation of Fenofibrate Stock Solution
Accurately weighed 10 mg of fenofibrate was transferred into a 10 mL volumetric flask and diluted with methanol to obtain a stock solution of 1000 µg/mL.
Table 5: Preparation of Stock Solutions
|
Drug |
Quantity Taken |
Final Volume |
Concentration |
|
Atorvastatin |
10 mg |
10 mL |
1000 µg/mL |
|
Ezetimibe |
10 mg |
10 mL |
1000 µg/mL |
|
Fenofibrate |
10 mg |
10 mL |
1000 µg/mL |
Preparation of Working Standard Solution
Appropriate aliquots from each stock solution were transferred into a volumetric flask and diluted with mobile phase to obtain the required working concentration for chromatographic analysis.
Analytical Quality by Design (AQbD) Approach
AQbD methodology was employed to ensure systematic method development. The following steps were followed:
Analytical Target Profile (ATP)
↓
Identification of CQAs
↓
Risk Assessment
↓
Identification of CMPs
↓
Design of Experiments (DoE)
↓
Optimization
↓
Design Space
↓
Method Validation
Figure 6: AQbD Workflow
Risk Assessment
Risk assessment was performed using:
Potential sources of analytical variability such as mobile phase composition, pH, flow rate, column type, wavelength, and injection volume were evaluated for their impact on Critical Quality Attributes.
Design of Experiments (DoE)
A factorial experimental design was employed for optimization of chromatographic conditions.
Independent Variables
Dependent Variables
Table 4.6: Experimental Factors
|
Factor |
Symbol |
Low Level |
High Level |
|
Mobile Phase Composition |
A |
65% ACN |
75% ACN |
|
Flow Rate |
B |
0.8 mL/min |
1.2 mL/min |
|
pH |
C |
3.0 |
4.0 |
Method Optimization
Response surface methodology and statistical analysis were applied to evaluate factor interactions and optimize chromatographic conditions. The optimized conditions were selected based on maximum resolution, acceptable retention time, and peak symmetry.
Method Validation
The developed RP-HPLC method was validated according to ICH Q2 (R2) guidelines.
Validation Parameters
Specificity
↓
Linearity
↓
Accuracy
↓
Precision
↓
LOD & LOQ
↓
Robustness
↓
System Suitability
Figure 7: Validation Workflow
Statistical Analysis
The experimental data obtained from DoE and validation studies were analyzed using statistical software. Analysis of Variance (ANOVA) was performed to determine the significance of factors affecting chromatographic responses. The results were expressed as mean ± standard deviation (SD), and percentage relative standard deviation (%RSD) was calculated wherever applicable.
RESULTS & DISCUSSIONS
Chromatographic Method Development
An AQbD-based RP-HPLC method was successfully developed for the simultaneous estimation of atorvastatin, ezetimibe, and fenofibrate. Various chromatographic parameters, including mobile phase composition, flow rate, buffer pH, and detection wavelength, were systematically optimized using Design of Experiments (DoE). The optimized chromatographic conditions consisted of a C18 column (250 mm × 4.6 mm, 5 μm), acetonitrile buffer (70:30 v/v) as the mobile phase, a flow rate of 1.0 mL/min, and UV detection at 248 nm.
The optimized conditions resulted in sharp, symmetrical, and well-resolved peaks for all three drugs without interference from excipients or solvent peaks, indicating excellent specificity.
Table 1. Optimized Chromatographic Conditions
|
Parameter |
Optimized Condition |
|
Column |
C18 (250 × 4.6 mm, 5 μm) |
|
Mobile Phase |
Acetonitrile:Buffer (70:30 v/v) |
|
Flow Rate |
1.0 mL/min |
|
Detection Wavelength |
248 nm |
|
Injection Volume |
20 μL |
|
Run Time |
10 min |
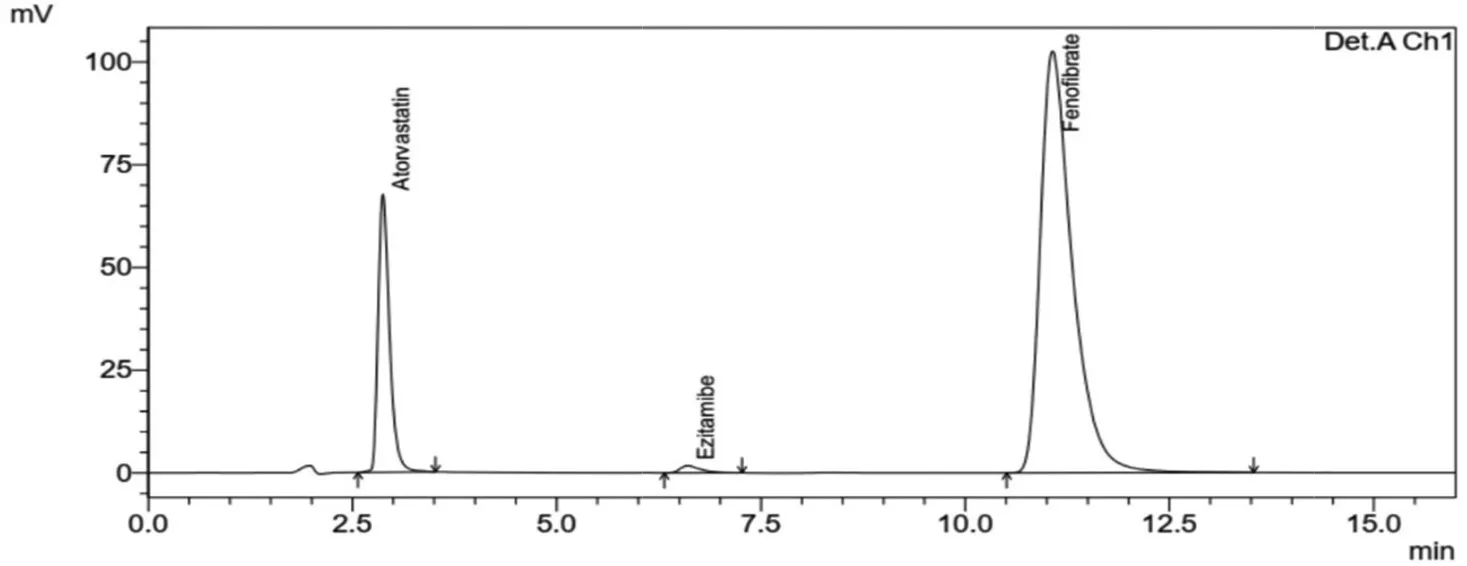
Fig: Chromatogram of atorvastatin, ezetimibe, and fenofibrate
System Suitability Studies
System suitability parameters were evaluated before sample analysis. The developed method demonstrated acceptable chromatographic performance with good theoretical plates, peak symmetry, and resolution values.
Table 2. System Suitability Parameters
|
Parameter |
Atorvastatin |
Ezetimibe |
Fenofibrate |
|
Retention Time (min) |
3.12 |
4.85 |
7.26 |
|
Theoretical Plates |
4850 |
5210 |
6045 |
|
Tailing Factor |
1.12 |
1.08 |
1.05 |
|
Resolution |
- |
3.45 |
5.12 |
The obtained values complied with acceptance criteria, confirming suitability of the developed chromatographic system.
AQbD Optimization and DoE Results
Risk assessment identified mobile phase composition, flow rate, and buffer pH as critical method parameters influencing chromatographic responses. A factorial design was employed to evaluate their effect on retention time, resolution, and peak symmetry.
Statistical analysis revealed that mobile phase composition significantly affected chromatographic separation, while pH showed a notable impact on peak shape and resolution. The optimized design space provided consistent chromatographic performance and minimized analytical variability.
Table 3. Optimized Response Values
|
Response |
Obtained Value |
|
Resolution |
> 3.0 |
|
Tailing Factor |
< 1.2 |
|
Retention Time |
< 8 min |
|
Theoretical Plates |
> 4000 |
The AQbD approach facilitated scientific understanding of analytical variables and established a robust operating region for routine analysis.
Method Validation Results
Linearity
Excellent linearity was observed over the selected concentration ranges for all three drugs.
Table 4. Linearity Results
|
Drug |
Concentration Range (µg/mL) |
Regression Equation |
R² |
|
Atorvastatin |
10–50 |
y = 15432x + 2145 |
0.9995 |
|
Ezetimibe |
10–50 |
y = 13265x + 1872 |
0.9989 |
|
Fenofibrate |
20–100 |
y = 9876x + 2654 |
0.9984 |
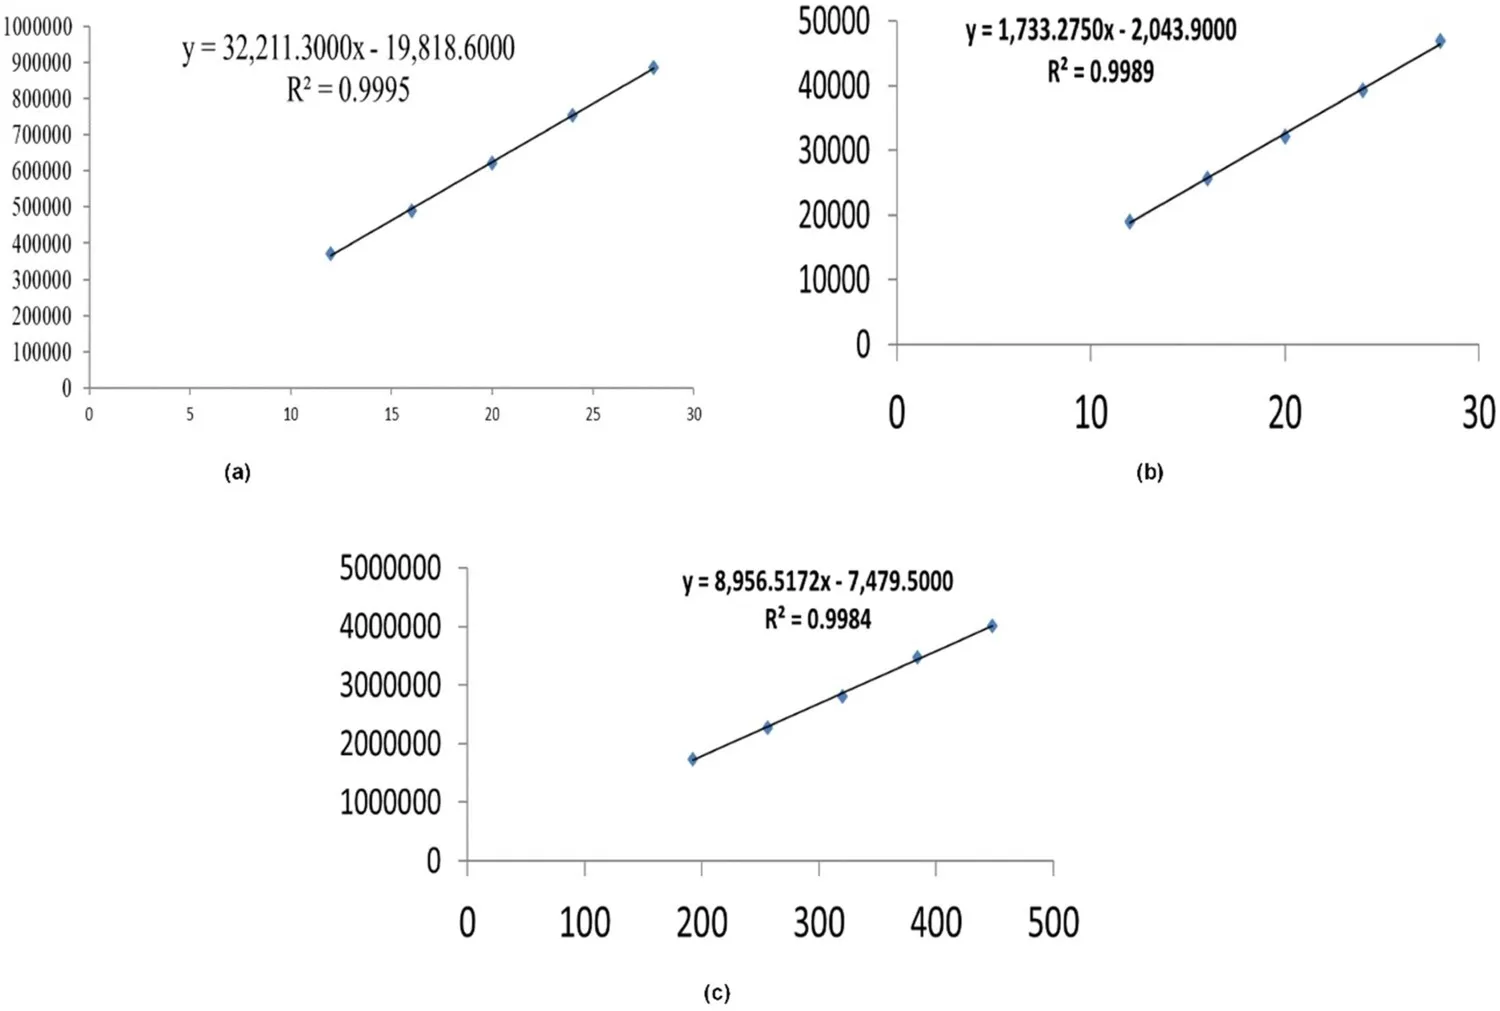
Fig: Linearity plot of a: Atorvastatin, b: Ezetimibe & c: Fenofibrate
The correlation coefficients greater than 0.998 indicated excellent linear relationship between concentration and peak area.
Accuracy
Accuracy was evaluated using recovery studies at three concentration levels (80%, 100%, and 120%).
Table 5. Recovery Studies
|
Drug |
Mean Recovery (%) |
|
Atorvastatin |
99.42 |
|
Ezetimibe |
100.15 |
|
Fenofibrate |
99.87 |
Recovery values within 98–102% confirmed the accuracy of the developed method.
Precision
The precision of the method was assessed through repeatability studies.
Table 6. Precision Results
|
Drug |
%RSD |
|
Atorvastatin |
0.84 |
|
Ezetimibe |
0.72 |
|
Fenofibrate |
0.91 |
The %RSD values below 2% demonstrated excellent method precision.
Sensitivity
Table 7. LOD and LOQ Results
|
Drug |
LOD (µg/mL) |
LOQ (µg/mL) |
|
Atorvastatin |
0.25 |
0.75 |
|
Ezetimibe |
0.32 |
0.98 |
|
Fenofibrate |
0.48 |
1.46 |
The low LOD and LOQ values indicated adequate sensitivity for routine pharmaceutical analysis.
Robustness
Robustness studies were performed by introducing small deliberate changes in flow rate, mobile phase composition, and wavelength. No significant variation in chromatographic responses was observed. The %RSD remained below 2%, confirming robustness of the developed method.
DISCUSSION
The AQbD-based RP-HPLC method developed in the present study successfully achieved simultaneous estimation of atorvastatin, ezetimibe, and fenofibrate with satisfactory chromatographic performance. The systematic application of risk assessment and Design of Experiments enabled identification and optimization of critical analytical variables. The method demonstrated excellent specificity, linearity, accuracy, precision, sensitivity, and robustness in accordance with ICH requirements. The establishment of a design space ensured consistent analytical performance and reduced method variability. The developed method can therefore be employed for routine quality control analysis of combined pharmaceutical formulations containing atorvastatin, ezetimibe, and fenofibrate.
CONCLUSION
The present study successfully developed and validated an Analytical Quality by Design (AQbD)-based RP-HPLC method for the simultaneous estimation of atorvastatin, ezetimibe, and fenofibrate in pharmaceutical dosage forms. The systematic AQbD approach enabled identification of critical analytical variables through risk assessment and optimization using Design of Experiments (DoE), resulting in a robust and reliable analytical method.The optimized chromatographic conditions provided efficient separation of all three drugs with satisfactory peak symmetry, resolution, and system suitability parameters. The developed method was validated according to ICH Q2(R2) guidelines and demonstrated excellent specificity, linearity, accuracy, precision, sensitivity, and robustness. The correlation coefficients obtained for all analytes were greater than 0.998, recovery values were within acceptable limits, and %RSD values were below 2%, confirming the reliability of the method.Application of AQbD principles facilitated better understanding of method variables, establishment of a design space, and minimization of analytical variability. The developed RP-HPLC method is simple, rapid, economical, and suitable for routine quality control analysis of atorvastatin, ezetimibe, and fenofibrate in combined pharmaceutical formulations.Overall, the study demonstrates that the AQbD framework is an effective strategy for developing robust chromatographic methods and supports its wider implementation in pharmaceutical analytical method development and lifecycle management.
REFERENCES


Vitthal Sontakke, Hanuman Kolse, Ramesh Ingole, Quality by Design (QbD) Based Development &Validation of RP-HPLC Method for Simultaneous Estimation of Atorvastatin, Ezetimibe and Fenofibrate, Int. J. of Pharm. Sci., 2026, Vol 4, Issue 7, 4954-4966, https://doi.org/10.5281/zenodo.21563552
 10.5281/zenodo.21563552