

We use cookies to ensure our website works properly and to personalise your experience. Cookies policy
1,2,3 Department of Quality Assurance, Nargund college of Pharmacy, Bengaluru
4 Department of Pharmaceutical Chemistry, Nargund College of Pharmacy, Bengaluru
5 Department of Pharmaceutics, Dr Gurachar Nargund College of Pharmacy, Murdi
A simple and precise UV spectroscopic method was developed for the simultaneous estimation of Finasteride and Tamsulosin HCl. Methanol was selected as the solvent based on the solubility studies of the drugs. Finasteride showed maximum absorbance at 240 nm, while Tamsulosin HCl showed maximum absorbance at 223 nm. The linearity range for Finasteride was found to be 10-60 µg/ml and Tamsulosin Hydrochloride was found to be 5-30 µg/ml with correlation of 0.9977 for FINA and 0.9955 for TAM, indicating excellent linearity. Various analytical validation parameters i.e., Accuracy, Precision, LOD, LOQ marketed formulation was found to be 96.24% and 98.67% respectively. LOD and LOQ for FINA were found to be 0.07794 and 0.23617 µg/ml, and for TAM, it was found to be 0.41222 and 1.24921 µg/ml. The results % Recovery for FINA and TAM were observed in the range of 98.93-98.92% and 100.41-99.12%. %RSD for the precision study was found to be less than 2% for the drugs. The developed method can be used for the simultaneous estimation of FINA and TAM from the tablet formulation.
Disease: Benign Prostatic Hyperplasia (BPH) is a non-cancerous enlargement of the prostate gland that commonly occurs in aging men. It can compress the urethra and cause lower urinary tract symptoms such as frequent urination, difficulty in urination, and weak urine flow. It affecting approximately one-third of men aged over 50 years. Combined therapy with alpha-adrenergic blockers and 5-alpha reductase inhibitors is considered an effective long-term treatment due to its enhanced patient acceptance and clinical efficacy. The combination has been reported to decrease prostate size by up to 26% while reducing the likelihood of BPH-related surgical intervention by approximately 57%.1
DRUG STRUCTURE:
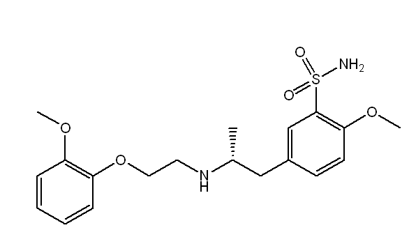
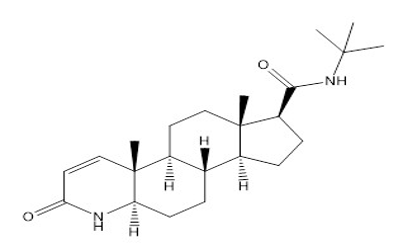
Fig 2: Tamsulosin Hcl: 5-[(2R)-2[2-(2-ethoxyphenoxy) ethylaminopropyl]-2-methoxybenzene Sulphonamide.5
2. MATERIALS AND METHODS
2.1 Materials:
A Shimadzu UV–1700 Pharma Spec double-beam UV–Visible spectrophotometer, having a spectral bandwidth of 2 nm, wavelength accuracy of ±0.5 nm, and equipped with 10 mm matched quartz cells, was used for measuring the absorbance of all prepared solutions. The absorption spectra were recorded using UV-Probe software (Version 2.32). An electronic analytical balance (Sartorius TE-214S) was employed for accurate weighing of samples, while an ultrasonicator (RC Systems MU1700) was used for sonication during sample preparation.
2.2 Marketed Formulation
UrimaxF (Tamsulosin Hydrochloride IP 0.4mg, Finasteride 5mg)
2.3 Reagent And Chemical
Methanol was used as a solvent which was procured from Avantar Performance Materials India Private Limited., Maharashtra, India. Distilled water was used throughout the analysis.
2.4 Solubility:
Solubility of Finasteride: 10 mg of Finasteride was weighed and added to 4 different 10ml volumetric flasks and add the small quantity of water, Methanol, 0.1N NAOH and 0.1N HCL respectively and shaken for 1-2 min and then make up the volume with respective solvents where results were found that the drug Finasteride was insoluble in water, slightly soluble in 0.1N NAOH and 0.1N HCl and freely soluble in Methanol.
Solubility of Tamsulosin HCL: 10 mg Tamsulosin HCL was weighed and added to 10ml of volumetric flask and add the small quantity of water, Methanol, 0.1N NaOH and 0.1N HCL respectively and shaken for 1-2 min and make up the volume with respective solvents where results were found that the drug Tamsulosin was soluble in water, methanol, 0.1N NaOH, and 0.1N HCL.
2.5 Selection Of Solvent:
From the above studies Finasteride and Tamsulosin HCL both were found to be soluble in Methanol. Hence Methanol was selected as solvent to carry the research work.
2.6 Preparation Of Standard Stock Solution
Ⅰ. Standard Stock Solution of Finasteride
10mg of standard Fina was weighed and transferred to 10ml volumetric flask. Fina was dissolved in 5ml methanol by gently shaking and volume was made with methanol to obtain final concentration of 1000 µg/ml and labelled as ‘Std Stock Fina-A’ From this solution, 1 ml of aliquot was transferred to 10ml of volume was made up to the mark distilled water. This solution was labelled as ‘Std stock Fina-B’
Ⅱ. Standard stock solution of Tamsulosin HCl:
10mg of standard tam was weighed and transferred to 10ml volumetric flask. Tam was Dissolved in 5ml methanol by gently shaking and volume was made with methanol to Obtain final concentration of 1000 µg/ml and labelled as ‘Std stock tam-A’ from this solution 1ml of aliquot was transferred to 10ml of volume was made up to the mark distilled water. This solution was labelled as ‘Std stock Tam-B’
2.7 Selection of wavelength for Finasteride:
From the std stock Fina-B (100 µg/ml) solution 1ml of aliquot was transferred in a 10ml volumetric flask and the volume made up to the mark with distilled water to obtain to final concentration of 10 µg/ml. The solution was scanned in the spectrum mode from 200nm to 400nm, and 240 nm was selected as the analytical wavelength based on maximum absorbance.
2.8 Selection of wavelength for Tamsulosin HCl:
From the std stock Tam-B (100 µg/ml) solution 1ml of aliquot was transferred in a 10ml volumetric flask and the volume made up to the mark with distilled water to obtain to final concentration of 10 µg/ml. The solution was scanned in the spectrum mode from 200nm to 400nm, and 223 nm was selected as the analytical wavelength based on maximum absorbance.
2.9 Selection of analytical concentration range
Ⅰ. Selection of Analytical Concentration Range for Finasteride
Cleaned 10ml volumetric flasks were taken and labelled as C1, C2, C3.C4, and C5. From the ‘Std Stock-B’ (100 µg/ml) solution 1, 2, 3, 4, and 5ml of aliquot was pipette out and transferred to C1, C2, C3, C4, and C5 volumetric flasks. The volume was made up to the mark with distilled water to obtain the concentration of 10 20 30 40 and 50 µg/ml. All these solutions were scanned in the range of 200-400 nm. The overlain spectra of these solutions are shown in Figure 3. Absorbance of above all the solution was measured at 240nm and a calibration curve was constructed curve are shown in Figure 4.
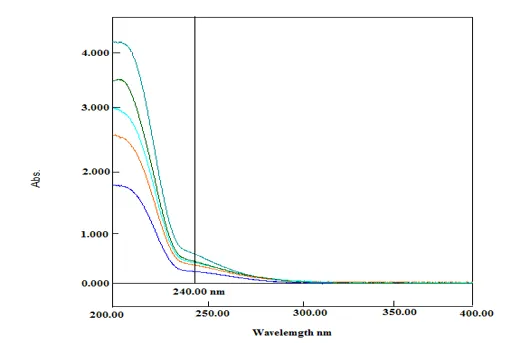
Figure 3: Overlain spectra of FINA
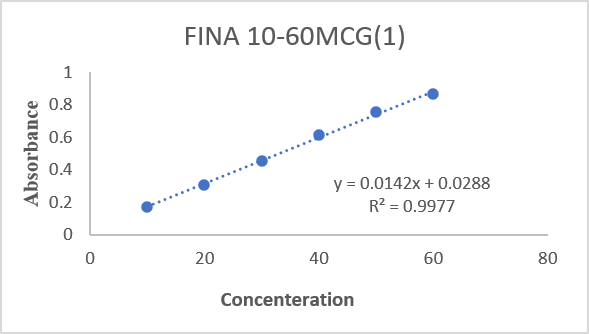
Figure 4: Calibration curve of FINA at 240 nm
Ⅱ. Selection of Analytical Concentration Range for Tamsulosin HCl:
Cleaned 10ml volumetric flasks were taken and labelled as C1, C2, C3, C4, and C5 From the ‘Std Stock TAM-B’ (100 µg/ml) solution 1, 2, 3, 4, and 5 of aliquot was pipette out and transferred to C1, C2, C3, C4 and C5 volumetric flasks. The volume was made up to the mark with distilled water to obtain the concentration of 10 20 30 40 and 50 µg/ml of TAM. All these solutions were scanned in the range of 200-400nm. The overlain spectra of these solutions are shown in Figure 5. Absorbance of the above solutions was measured at 223nm and a calibration curve was constructed by plotting absorbance v/s concentration as shown in Figure 6.
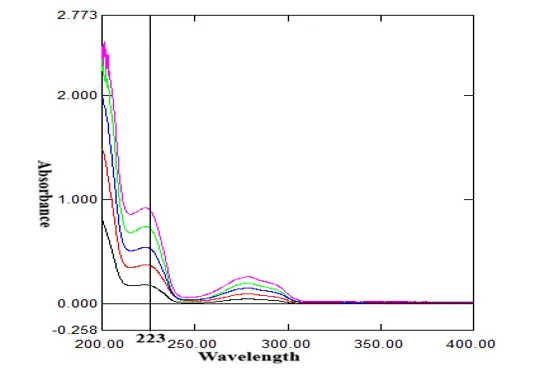
Figure 5: Overlain spectra of TAM
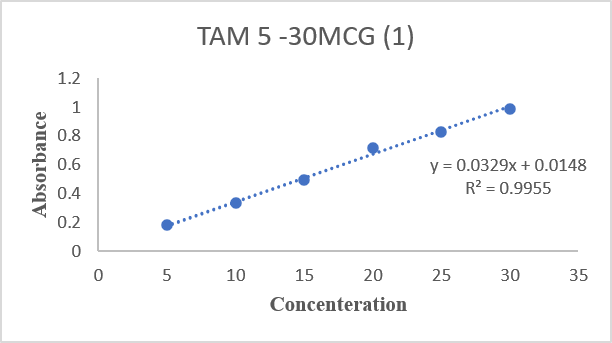
Figure 6: Calibration Curve of TAM at 223nm
3. ANALYSIS OF TABLET FORMULATION:
Twenty tablets of FINA and TAM were weighed and crushed to obtain fine powder. An accurately weighed tablet powder equivalent to about 5mg of FINA and 0.4mg of TAM was transferred into 10 ml volumetric flask and sonicated for 10 minutes with 5ml methanol for extraction of drugs the volume was made up to 10ml with methanol. The resulting solution was filtered through Whatman filter paper no. 41, few ml of filter was discarded, and rest of solution was used as ‘Sample Stock A. From the ‘Sample stock A’ solution 1ml of the aliquot was transferred in to a 10ml volumetric flask. The volume is made up to the mark with
methanol to obtain a stock containing 50 μg/mL of FINA and 4 μg/mL of TAM.
This was labelled as ‘Sample stock B.’ From this solution 1 ml of the aliquot was pipetted out transferred to a 10 ml volumetric flask and this was labelled as ‘sample stock c’. The volume was made to the mark with distilled water to obtain a solution with final concentration of 5 µg/ml of FINA and 0.4 µg/ml of TAM. The sample solution was scanned at 240nm and 223nm. The resultant absorbance was recorded and noted. Results are given in Table No 5.
The concentration of two Drugs (X and Y) in sample solution was calculated by using following equations:
Cx = A2ay1-A1ay2 / ax2ay1-ax1ay2
Cy = A1ax2-A2ax1 / ax2ay1-ax1ay2
Where, ax1, ax2, ay1 and ay2 are the absorptivities of X and Y at λ1 and λ2 respectively. A1 and A2 are the absorbance of diluted sample at λ1 and λ2 respectively. [6, 7]
3.1 Validation of spectrophotometric Method.
3.1.1 Accuray studies of Finasteride and Tamsulosin HCl:
To determine the accuracy of the method, recovery study was performed by standard addition method at 80%, 100%, and 120% level of the assay concentration. For this study, 1ml of the pre-analysed ‘sample stock-B’ solution (5µg/ml of FINA and 0.4µg/ml of TAM) was transferred to the three separate clean 10ml volumetric flask which was already containing 4µg/ml, 55µg/ml and 65µg/ml of FINA and 0.32µg/ml, 0.405µg/ml and 0.425µg/ml of TAM respectively and made up to the mark with distilled water. These solutions were analysed in UV- Spectroscopy mode same as that of the sample solution analysis.
The results were shown in the Table No 6
3.1.2 Precision:
The precision of an analytical method was studied by performing intermediate precision.
Intermediate precision:
A. Intra-day Precision: The Variation of results was analysed by measuring the absorbance of standard solution of FINA (10, 20, 30 µg/ml at 240nm) and TAM (10, 20, 30 µg/ml
at 223nm) at three different time intervals on the same day and %RSD was calculated. The %RSD was calculated to assess precision using the following formula:
%RSD = (SD/ mean) × 100
B. Inter-day Precision: The variation in results was evaluated by measuring the absorbance of standard solutions FINA (10, 20, and 30µg/ml) at 240nm and TAM (10, 20, and 30µg/ml) at 223nm in the same time over three consecutive days. The %RSD was calculated to assess the reproducibility of the method using the following formula:
%RSD = (SD/ mean) × 100
Limit of Detection (LOD) and Limit of Quantification (LOQ)
The Detection limit and quantification limit were determined from the standard deviation of y-intercepts of six calibration curves and averages slope of six calibration curves. The formula is as follows:[8, 9]
LOD = 3.3×Standard deviation of y-Intercepts of six Calibration curvesAverage Slope of Six Calibration curves

LOQ = 10×Standard Deviation of y-intercepts of Six Calibration curves Average Slope of Six Calibration Curves

The results of LOD and LOQ are shown in the summary Table No 4.5
4. RESULTS AND DISCUSSION
4.1 Linearity
Table No: 1 Linearity Range for FINA at 240 nm
|
Conc μg/ml |
Average Absorbance |
Std Dev |
% RSD |
|
10 |
0.1745 |
0.001979 |
1.521388 |
|
20 |
0.305333 |
0.002134 |
1.737363 |
|
30 |
0.455667 |
0.003543 |
0.850963 |
|
40 |
0.615167 |
0.002478 |
0.909151 |
|
50 |
0.756167 |
0.004017 |
0.73836 |
|
60 |
0.863167 |
0.002734 |
0.959293 |
Table No: 2 Linearity Range of FINA at 223 nm
|
Conc μg/ml |
Average Absorbance |
Std Dev |
% RSD |
|
10 |
0.1561 |
0.001835 |
1.17492 |
|
20 |
0.1856 |
0.002422 |
1.30455 |
|
30 |
0.2345 |
0.002665 |
1.13628 |
|
40 |
0.2853 |
0.00216 |
0.75709 |
|
50 |
0.344 |
0.001789 |
0.52001 |
|
60 |
0.3756 |
0.001506 |
0.40076 |
Table No:3 Linearity Range for TAM at 223nm
|
Conc μg/ml |
Average Absorbance |
Std Dev |
% RSD |
|
5 |
0.176 |
0.001291 |
0.73352 |
|
10 |
0.334167 |
0.002339 |
0.70033 |
|
15 |
0.5115 |
0.007205 |
1.408665 |
|
20 |
0.7150 |
0.001915 |
0.267812 |
|
25 |
0.826333 |
0.0017 |
0.205689 |
|
30 |
0.992667 |
0.001972 |
0.198659 |
Table No: 4 Linearity Range for TAM at 240 nm
|
Conc μg/ml |
Average Absorbance |
Std Dev |
% RSD |
|
5 |
0.02583 |
0.000408 |
1.58031 |
|
10 |
0.04583 |
0.000408 |
0.89072 |
|
15 |
0.066 |
0.001265 |
1.91653 |
|
20 |
0.08633 |
0.001506 |
1.74387 |
|
25 |
0.11416 |
0.002041 |
1.78794 |
|
30 |
0.13583 |
0.001722 |
1.26802 |
4.2 Assay Results
Table No: 5 Assay Results of Tablet Formulation
|
Sr. No. |
Amount Present (mg/tab) |
Amount Found (mg/tab) |
% Assay |
|||
|
FINA |
TAM |
FINA |
TAM |
FINA |
TAM |
|
|
1 |
5 |
0.4 |
4.81 |
0.39 |
96.34% |
99.64% |
|
2 |
5 |
0.4 |
4.87 |
0.40 |
97.50% |
101.93% |
|
3 |
5 |
0.4 |
4.88 |
0.40 |
97.68% |
101.96% |
|
4 |
5 |
0.4 |
4.87 |
0.39 |
97.43% |
98.73% |
|
5 |
5 |
0.4 |
4.79 |
0.38 |
95.90% |
97.68% |
|
6 |
5 |
0.4 |
4.75 |
0.39 |
96.64% |
98.67% |
|
Mean |
4.828333 |
0.391667 |
96.64% |
99.67% |
||
|
±SD |
0.053072 |
0.006872 |
0.009809 |
0.017784 |
||
|
%RSD |
1.099184 |
1.754513 |
1.014942 |
1.78432 |
||
4.3 Accuracy:
Table No: 6 Accuracy results of FINA and TAM
|
Level of % Recovery |
Sl. No. |
Amount of Standard Drug Added (µg/ml) |
Total Amount Found (µg/ml) |
Total Amount Recovered (µg/ml) |
% Recovery |
||||
|
FINA |
TAM |
FINA |
TAM |
FINA |
TAM |
FINA |
TAM |
||
|
80% |
1 |
4 |
0.32 |
8.923 |
0.720 |
3.923 |
0.320 |
98.07% |
100.24% |
|
2 |
4 |
0.32 |
9.025 |
0.719 |
4.025 |
0.319 |
100.64% |
99.75% |
|
|
3 |
4 |
0.32 |
8.923 |
0.723 |
3.923 |
0.323 |
98.07% |
101.23% |
|
|
100% |
1 |
5 |
0.4 |
10.098 |
0.793 |
5.098 |
0.393 |
101.96% |
101.96% |
|
2 |
5 |
0.4 |
9.901 |
0.795 |
5.196 |
0.395 |
98.03% |
103.92% |
|
|
3 |
5 |
0.4 |
10.09 |
0.801 |
5.098 |
0.401 |
101.96% |
101.96% |
|
|
120% |
1 |
6 |
0.48 |
10.935 |
0.873 |
5.935 |
0.473 |
98.92% |
98.54% |
|
2 |
6 |
0.48 |
11.032 |
0.879 |
6.032 |
0.479 |
100.53% |
99.94% |
|
|
3 |
6 |
0.48 |
10.838 |
0.874 |
5.838 |
0.474 |
97.31% |
98.89% |
|
Table No: 7
|
Level of % Recovery |
Mean* (% Recovery) |
± SD |
% RSD |
|||
|
FINA |
TAM |
FINA |
TAM |
FINA |
TAM |
|
|
80% |
98.93 |
100.41 |
1.48 |
0.75 |
1.49 |
0.75 |
|
100% |
102.61 |
99.19 |
1.13 |
1.06 |
1.103 |
1.07 |
|
120% |
98.92 |
99.12 |
1.61 |
0.72 |
1.63 |
0.73 |
4.4 Precision
1. Intermediate Precision
Table No 8: Intraday results of FINA at 240 nm
|
Conc μg/ml |
Absorbance |
Average |
Std Dev |
% RSD |
||
|
0 hour |
2 hours |
4 hours |
||||
|
10 |
0.172 |
0.173 |
0.174 |
0.173 |
0.00082 |
0.47196 |
|
20 |
0.305 |
0.306 |
0.308 |
0.30633 |
0.00125 |
0.40714 |
|
30 |
0.452 |
0.453 |
0.454 |
0.453 |
0.00082 |
0.18024 |
Table No 9: Interday results of FINA at 240 nm
|
Conc μg/ml |
Absorbance |
Average |
Std Dev |
% RSD |
||
|
Day 1 |
Day 2 |
Day3 |
||||
|
10 |
0.173 |
0.172 |
0.174 |
0.173 |
0.00082 |
0.47196 |
|
20 |
0.304 |
0.305 |
0.306 |
0.305 |
0.00082 |
0.2677 |
|
30 |
0.454 |
0.451 |
0.452 |
0.45233 |
0.00125 |
0.27573 |
Table No 10: Intraday results of TAM at 223nm
|
Conc μg/ml |
Absorbance |
Average |
Std Dev |
% RSD |
||
|
0 hour |
2 hours |
4 hours |
||||
|
30 |
0.344 |
0.335 |
0.336 |
0.335 |
0.00082 |
0.24373 |
|
40 |
0.712 |
0.716 |
0.714 |
0.714 |
0.000163 |
0.22871 |
|
50 |
0.991 |
0.992 |
0.994 |
0.9936 |
0.00125 |
0.12552 |
Table No 11: Interday results of TAM at 223 nm
|
Conc μg/ml |
Absorbance |
Average |
Std Dev |
% RSD |
||
|
Day 1 |
Day 2 |
Day3 |
||||
|
10 |
0.336 |
0.334 |
0.332 |
0.334 |
0.00163 |
1.43245 |
|
20 |
0.714 |
0.712 |
0.718 |
0.71467 |
0.00249 |
0.34904 |
|
30 |
0.991 |
0.992 |
0.994 |
0.99233 |
0.00125 |
0.12569 |
Table 12: Summary of UV-Visible Spectrophotometric Method
|
Parameters |
FINA |
TAM |
|
Wavelength (nm) |
240nm |
223nm |
|
Linearity Range (µg/ml) |
10-60µg/ml |
5-30µg/ml |
|
Regression Equation (y=mx+c) |
Y=0.0142x+0.0288 |
Y=0.0329x+0.0148 |
|
Correlation Coefficient (R2) |
0.9977 |
0.9955 |
|
LOD (µg/ml) |
0.07794 |
0.41222 |
|
LOQ (µg/ml) |
0.23617 |
1.24921 |
|
Analysis of Tablets (Mean %Assay) |
96.24% |
98.67% |
|
% Recovery |
98.93-98.92% |
100.41-99.12% |
|
Intra Day Precision (%RSD) |
0.353% |
0.1993% |
|
Inter Day Precision (%RSD) |
0.335% |
0.635% |
5. CONCLUSION:
A simple, precise, and sensitive UV-spectrometric method utilizing the simultaneous equation method has been developed for the simultaneous estimation of Finasteride and Tamsulosin HCl.
The developed method was validated according to ICH guidelines, and the results of the assay studies were satisfactory. Therefore, this method can be successfully applied for routine analysis of Finasteride and Tamsulosin HCl in marketed formulation of the pharmaceutical dosage form.
6. ACKNOWLEDGEMENT
I would like to thank the Dept. of Pharmaceutical Quality Assurance, Nargund college of Pharmacy, Bengaluru for providing the research facilities for the conducting my research work. I would like to thank my principal and guide for continuous encouragement and support.
REFERENCES



Nithyashree H P, Dr. S. Vijaya Bhaskar, Kavana M, Dr. Shachindra L Nargund, Dr. Shravan L Nargund, Simultaneous Estimation of Finasteride and Tamsulosin Hydrochloride in Pharmaceutical Formulation using Vierodt’s Method, Int. J. of Pharm. Sci., 2026, Vol 4, Issue 9, 4136-4145. https://doi.org/10.5281/zenodo.23058395
 10.5281/zenodo.23058395