

We use cookies to ensure our website works properly and to personalise your experience. Cookies policy
1Department of Chemistry, Government College Banaganapalli, Nandyal, Andhra Pradesh, India
2,3 Department of Chemistry, K.V.R. Government College for Woman (A), Kurnool, Andhra Pradesh, India
A simple, cost-effective, and sensitive spectrophotometric method was developed based on a color-developing condensation reaction of a acyclovir with p-dimethylaminobenzaldehyde in pharmaceutical formulation. The proposed method based on the reaction between the exocyclic primary amino group of Acyclovir and the carbonyl group of para-dimethylaminobenzaldehyde (PDAB) in an acidic medium to form yellow coloured schiff’s base.The resulting chromophore exhibited a maximum absorption at 420 nm. The reaction obey’s Beer-Lambert’s law within a specific concentration range20-100 ?g/m, providing a sensitive, low-cost, and rapid alternative to HPLC for the routine quality control and pharmaceutical analysis of Acyclovir in bulk and dosage forms
Acyclovir is a synthetic acyclic nucleoside analog of guanosine, widely used as an antiviral medication to treat herpes simplex and varicella-zoster viruses. It works by mimicking guanosine, inhibiting viral DNA polymerase, and acting as a chain terminator, which prevents viral replication with high selectivity and minimal toxicity to uninfected cells. Current analytical literature reveals an array of methods for Acyclovir determination in tablets, ranging from traditional spectrophotometric method1-8, spectrophotometric and spectrofluorimetric method9-10, Flow Injection Chemiluminescence method11, polarographic determination12, Fourier transform (FT) Raman spectroscopy13, liquid chromatography-spectrofluorimetric detection14, HPLC-fluorescence15, electrochemiluminescence method16, fluorimetric method17-18 HPLC methods19-31 and Fourier transform infrared spectroscopy32, reflecting a broad methodological landscape for pharmaceutical quality control.
MATERIALS AND METHODS
Instrumentation
Spectronic 1000 plus UV Visible Spectrophotometer with 1 cm matched quartz cells was used for all spectral and absorbance measurements. AR grade chemicals are used for preparation of reagents and solutions in the present investigations
Preparaion of 1% para-dimethylaminobenzaldehyde:
Dissolve the 1.0 g in 100 mL of a 1:1 mixture of 95% ethanol and concentrated hydrochloric acid (HCl)
Standard Acyclovir solution:
50 mg of Acyclovir is dissolved in 50 ml methanol. 1.0 ml of the above stock solution is further diluted to 10 ml with methanol to get working concentration of 100 mg/mL
Absorption Spectrum of the Acyclovir–PDAB Complex for the Determination of wavelength of maximum absorbance
The optimal wavelength for measuring the drug-PDAB complex was established by scanning the colored product against a reagent blank. Following the addition of sulfuric acid and 1%PDAB to the drug solution, the volume was adjusted with methanol. The spectrum (Fig.1) revealed that the maximum absorbance occurred at 440 nm. The use of an excess of PDAB reagent ensured the reaction proceeded to exhaustion, meaning negligible free drug remained in the solution. This peak wavelength of 440 nm was adopted for the construction of the calibration curve and validation studies.
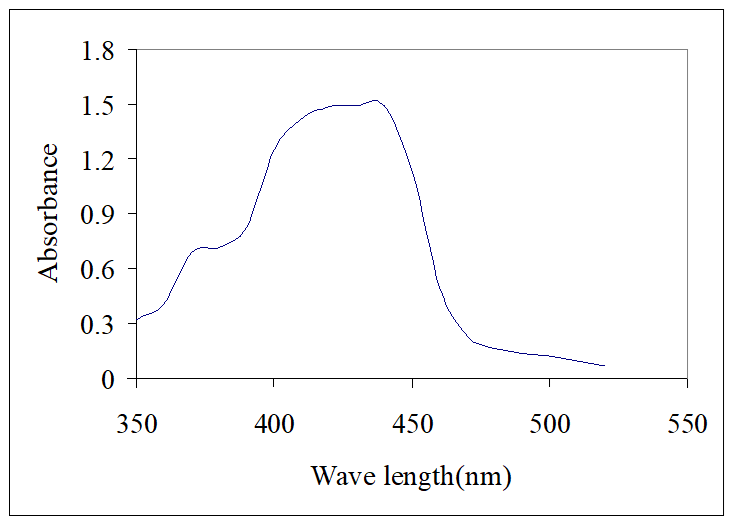
Fig:1: Absorption spectrum of acyclovir and dimethyl amino benzaldehyde
Assay procedure
Accurately measured aliquots of the standard drug solution (0.2–1.0mL) were transferred into a series of 10 mL volumetric flasks. To each flask, 0.5 mL of 0.1 N sulfuric acid and 1.0 mL of 1% w/v p-dimethylaminobenzaldehyde were added. Following thorough agitation, the volume was adjusted to the mark with distilled water. The absorbance of the resulting Schiff’s base was recorded at 440 nm after a five-minute incubation period against a reagent blank. The concentration of Acyclovir was then determined using a calibration curve, which exhibited linearity over a range of 20–100 ug/mL.
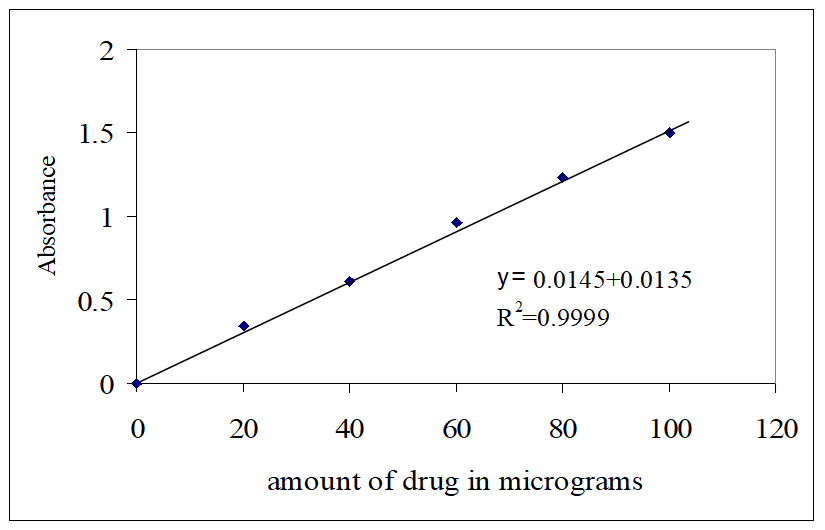
Fig:2: Calibration curve of acyclovir
RESULTS AND DISCUSSION:
The analytical procedure was based on the condensation of Acyclovir with p-dimethylaminobenzaldehyde (PDAB) in an acidic environment, yielding a stable Schiff’s base and the resulting yellow chromophore is spectrophotometrically measured at a 440 nm against a reagent blank. The complex exhibits remarkable stability for over 6 hours, and the method obeys Beer-Lambert’s law over a concentration range of 20-100 μg/mL with a high correlation coefficient (R2 > 0.999). The molar absorptivity and Sandell’s sensitivity were calculated, indicating high sensitivity for the detection of the drug in both bulk and pharmaceutical dosage forms. The regression analysis using method of least squares was made for the slope (b), intercept (a) and correlation (r) obtained from different concentrations and results are summarized in the table 1. The percent relative standard deviation calculated from the five measurements of acyclovir shown in table 2. The calculated % RSD (Relative Standard Deviation) was found to be less than 2.0%, confirming the excellent reproducibility of the proposed method. Furthermore, the consistently low standard deviation values reflect both the high accuracy and precision of the analytical procedure. The calculated t-value was found to be less than the theoretical value of 2.78, confirming that there is no significant difference in precision and validating the reproducibility of the method
Commonly used pharmaceutical excipients and additives, including starch, calcium, lactose, and glucose, showed no significant interference at the concentrations typically found in commercial formulations.
Validated for accuracy and precision, the proposed Schiff’s base condensation method provides a reliable and time-efficient alternative for the quantitative determination of Acyclovir. The method’s simplicity allows for its convenient adoption in routine pharmaceutical quality assurance without the need for sophisticated instrumentation
Table 1: Optical characteristics of proposed method
|
Parameters |
Proposed method |
|
λmax (nm) |
440 |
|
Beer’s law limit (µg/mL) |
20-100 |
|
Molar absorptivity (l mole-1 cm-1) |
1.188x10³ |
|
Sandell’s sensitivity (µg cm-2 / 0.001 absorbance unit) |
0.2964 |
|
Regression equation (Y = a + bx) |
Y=0.0145x+0.0135 |
|
Slope (b) |
0.0054 |
|
Intercept (a) |
0.0034 |
|
Correlation coefficient (r) |
0.9999 |
*Y = a+bX, where Y is the absorbance and X concentration in μg / ml
Table 2: Assay of acyclovir in tablets
|
Sample (mg) |
*Amount Found (mg) ±S.D* |
% Label claim |
%RSD* |
*tcal |
|
400 |
400.08±0.48 |
100.02 |
0.1203 |
0.3715 |
|
400 |
400.02±0.30 |
100.005 |
0.07582 |
0.1474 |
|
400 |
399.96±0.24 |
99.99 |
0.0602 |
0.3717 |
REFERENCES

J. Sudhakar Reddy, K. Prabhavathi, N. Rami Reddy, Spectrophotometric Method for The Determination of an Acyclovir in Pharmaceutical Formulations, Int. J. of Pharm. Sci., 2026, Vol 4, Issue 4, 509-513. https://doi.org/10.5281/zenodo.19409960
 10.5281/zenodo.19409960