

We use cookies to ensure our website works properly and to personalise your experience. Cookies policy
Department of Pharmaceutical Analysis, J.K.K. Nattraja college of Pharmacy, Komarapalayam, Namakkal, India 638183
A simple, accurate, precise method was developed for the simultaneous estimation of the Theophylline and Salbutamol in Tablet dosage form. Chromatogram was run through Std ODS C18 (4.6 x 250mm, 5µm). Mobile phase containing Buffer 0.01N Ammonium acetate: Acetonitrile taken in the ratio 65:35 was pumped through the column at a flow rate of 1 ml/min. Temperature was maintained at 30°C. The optimized wavelength selected was 230nm. Retention time of Theophylline and Salbutamol were found to be 2.129 min and 2.592 min. % RSD of theophylline and Salbutamol were found to be 0.4 and 0.2 respectively. % Recovery was obtained as 99.82 % and 99.76 % for Theophylline and Salbutamol respectively. LOD, LOQ values obtained from regression equations of Theophylline and Salbutamol were 0.19, 0.59 and 0.01, 0.04 respectively. The Regression equation of Theophylline is y = 6477.3x + 13338, and of y = 27841x + 374.37 Salbutamol. Retention times were decreased and that run time was decreased, so the method developed was simple and economical that can be adopted in regular Quality control tests in Industries.
Theophylline and Salbutamol are commonly used bronchodilators for the treatment of bronchial asthma and chronic obstructive pulmonary disease (COPD). Theophylline, a methylxanthine derivative, produces bronchodilation by phosphodiesterase inhibition and adenosine receptor antagonism, while Salbutamol is a selective short-acting β?-adrenoceptor agonist that rapidly relaxes bronchial smooth muscle. Their combination therapy provides both immediate and sustained bronchodilation, improving clinical efficacy.
Chemically, Theophylline (C?H?N?O?; molecular weight 180.16 g/mol) and Salbutamol (C??H??NO?; molecular weight 239.31 g/mol) possess different physicochemical properties, making their simultaneous estimation in combined dosage forms analytically challenging. Reliable quantification of these drugs is essential to ensure product quality, safety, and therapeutic effectiveness.
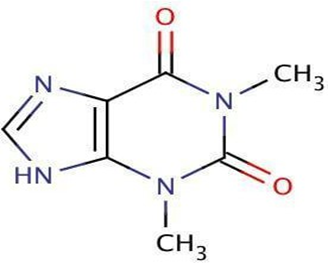
Figure 1: Structure of Theophylline
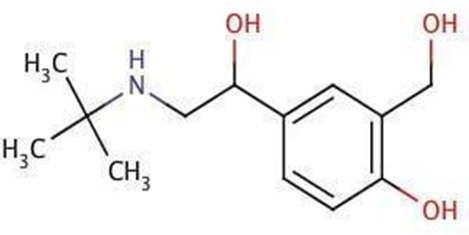
Figure 2: Structure of Salbutamol
Several analytical methods, including UV spectrophotometry and high-performance liquid chromatography (HPLC), have been reported for the estimation of Theophylline and Salbutamol either individually or in combination. However, many existing methods suffer from limitations such as longer analysis time, complex mobile phase composition, limited sensitivity, or inadequate validation in accordance with International Council for Harmonisation (ICH) guidelines.
Reverse phase high-performance liquid chromatography (RP-HPLC) is a preferred technique in pharmaceutical analysis due to its high resolution, sensitivity, reproducibility, and suitability for simultaneous multi-component analysis. Hence, the present study aims to develop and validate a simple, rapid, accurate, and economical RP-HPLC method for the simultaneous estimation of Theophylline and Salbutamol in tablet dosage form, in compliance with ICH guidelines, for routine quality control applications.
MATERIALS AND METHODS
Instruments
Chromatographic separation was carried out using a WATERS HPLC 2695 system equipped with a quaternary pump, auto-sampler, and Photo Diode Array (PDA) detector, controlled by Empower 2 software. Data acquisition and processing were performed using the same software. A reverse phase C18 column (ODS C18, 250 × 4.6 mm, 5 μm particle size) was employed for separation. A calibrated electronic analytical balance (Denver Instruments) was used for weighing, while a pH meter (BVK Enterprises, India) and an ultrasonicator were used for pH adjustment and sample dissolution, respectively.
Reagents and Chemicals
Theophylline and Salbutamol reference standards of pharmaceutical grade were obtained as gift samples. Marketed tablet formulation containing Theophylline and Salbutamol was procured from a local pharmacy. HPLC grade acetonitrile, methanol, potassium dihydrogen phosphate, and orthophosphoric acid were procured from Rankem. Distilled water was used throughout the study.
Chromatographic Conditions
Chromatographic separation was achieved on a C18 column using a mobile phase consisting of 0.01 N ammonium acetate buffer and acetonitrile in the ratio of 65:35 (v/v). The mobile phase was filtered through a 0.45 μm membrane filter and degassed prior to use. The flow rate was maintained at 1.0 mL/min, and the column temperature was set at 30°C. Detection was carried out at 230 nm, and the injection volume was 20 μL. The total run time was optimized to ensure adequate separation of both analytes.
Preparation of Standard Solutions
Accurately weighed 80 mg of Theophylline and 1.6 mg of Salbutamol were transferred into separate 100 mL volumetric flasks. About 75% of the diluent (acetonitrile: water, 50:50 v/v) was added, and the solutions were sonicated for 10 minutes to ensure complete dissolution. The volumes were then made up with the same diluent to obtain standard stock solutions containing 800 μg/mL of Theophylline and 16 μg/mL of Salbutamol. Appropriate dilutions were prepared from the stock solutions to obtain working standard solutions.
Optimization of RP-HPLC Method
The RP-HPLC method was optimized to achieve efficient simultaneous estimation of Theophylline and Salbutamol. Several chromatographic conditions were evaluated, and optimal separation was obtained using 0.01 N ammonium acetate buffer (pH 4.0) and acetonitrile (65:35, v/v) on an ODS C18 column (150 × 4.6 mm, 5 μm) at a flow rate of 1.0 mL/min. Detection was carried out at 230 nm, with the column temperature maintained at 30°C and an injection volume of 20 μL. A total run time of 5 minutes was sufficient. Under these conditions, both drugs showed well-resolved, symmetrical peaks with acceptable tailing factor, theoretical plate count, and resolution. The optimized chromatogram is shown in Figure 3.
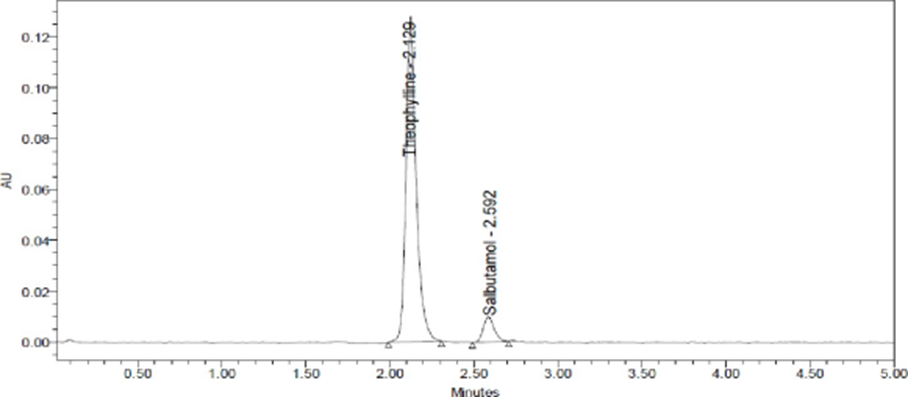
Figure 3: Optimized Chromatogram
Validation of RP-HPLC method
The developed RP-HPLC method for the simultaneous estimation of Theophylline and Salbutamol was validated in accordance with ICH Q2(R1) guidelines with respect to system suitability, specificity, linearity, precision, accuracy, robustness, limit of detection (LOD), and limit of quantification (LOQ).
System Suitability
System suitability was evaluated by injecting standard solutions containing Theophylline (80 μg/mL) and Salbutamol (1.6 μg/mL) six times into the chromatographic system. Parameters such as retention time, tailing factor, theoretical plates (USP plate count), and resolution were determined. The percentage relative standard deviation (%RSD) of peak areas for six replicate injections was found to be less than 2%, confirming the suitability of the system. The tailing factor (T) and number of theoretical plates (N) were evaluated and the results are presented in Table 1.
Specificity
Specificity of the method was assessed by analyzing blank and placebo solutions. No interfering peaks were observed at the retention times of Theophylline and Salbutamol, indicating that the method is specific for both analytes in the presence of formulation excipients.
Precision
Standard stock solutions were prepared by accurately weighing 80 mg of Theophylline and 1.6 mg of Salbutamol, which were transferred into separate 100 mL volumetric flasks, dissolved in diluent with sonication for 10 minutes, and diluted to volume to obtain concentrations of 800 μg/mL and 16 μg/mL, respectively.
Working standard solutions (100% test concentration) were prepared by diluting the stock solutions to obtain 80 μg/mL of Theophylline and 1.6 μg/mL of Salbutamol. Precision was evaluated by repeatability and intra-day precision using replicate injections of the working standard solution. The %RSD values were within acceptable limits, indicating good precision. The results were shown in table 3.
Linearity
Linearity was evaluated at six concentration levels corresponding to 25%, 50%, 75%, 100%, 125%, and 150% of the test concentration. The concentration ranges studied were 20–120 μg/mL for Theophylline and 0.4–2.4 μg/mL for Salbutamol. Each concentration level was injected, and calibration curves were constructed by plotting peak area versus concentration. The method showed a linear response over the studied range with acceptable correlation coefficients. The calibration curves for Theophylline and Salbutamol are shown in Figure 2, and the corresponding linearity parameters are presented in Table 2.
Accuracy
Accuracy was assessed by recovery studies using the standard addition method at 50%, 100%, and 150% levels. Sample stock solutions were spiked with known quantities of standard Theophylline and Salbutamol and diluted to volume with diluent. The spiked samples were analyzed using the proposed method, and percentage recoveries were calculated. The recoveries for both drugs were found to be within the acceptable range of 98.0–102.0%, confirming the accuracy of the method. The % recovery was reported in table 6.
Robustness
Robustness of the method was evaluated by making small deliberate variations in chromatographic conditions, including flow rate (0.9 and 1.1 mL/min), mobile phase composition (± variation), and column temperature (25°C and 35°C). Samples were injected in duplicate under each altered condition. No significant changes were observed in system suitability parameters, and %RSD values remained within acceptable limits, indicating the robustness of the method. Percentage RSD was shown in table 9.
Limit of Detection and Limit of Quantification
LOD and LOQ were determined based on signal-to-noise approach using diluted standard solutions. LOD samples were prepared by serial dilution of stock solutions to obtain low concentration levels, followed by further dilution. LOQ samples were prepared similarly at higher concentration levels. The obtained LOD and LOQ values demonstrated adequate sensitivity of the method for the estimation of both drugs.
RESULTS AND DISCUSSION
System suitability
Table 1: System suitability parameters for Theophylline and Salbutamol
|
Sr. No |
Theophylline |
Salbutamol |
|||||
|
Inj |
RT (min) |
USP Plate Count |
Tailing |
RT (min) |
USP Plate Count |
Tailing |
Resolution |
|
1 |
2.120 |
6219 |
1.23 |
2.579 |
7022 |
1.15 |
3.8 |
|
2 |
2.121 |
6105 |
1.27 |
2.580 |
6494 |
1.10 |
3.6 |
|
3 |
2.121 |
5935 |
1.20 |
2.581 |
8468 |
1.13 |
3.8 |
|
4 |
2.121 |
5841 |
1.20 |
2.583 |
7162 |
1.16 |
3.6 |
|
5 |
2.122 |
5658 |
1.30 |
2.584 |
6877 |
1.22 |
3.8 |
|
6 |
2.124 |
6144 |
1.26 |
2.585 |
7381 |
1.12 |
3.9 |
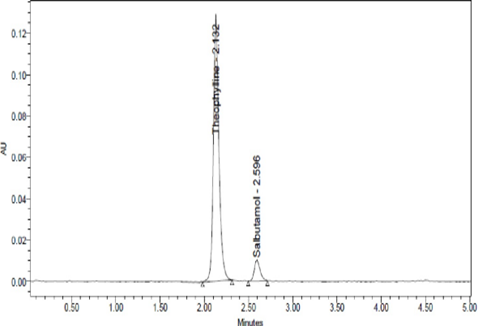
Figure 4: System suitability Chromatogram
Validation:
Specificity:
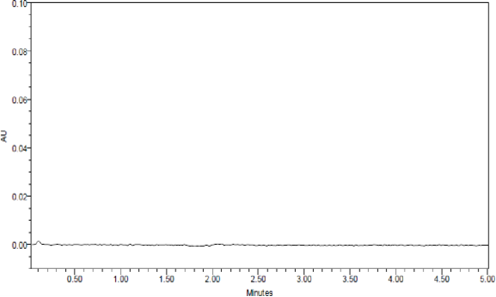
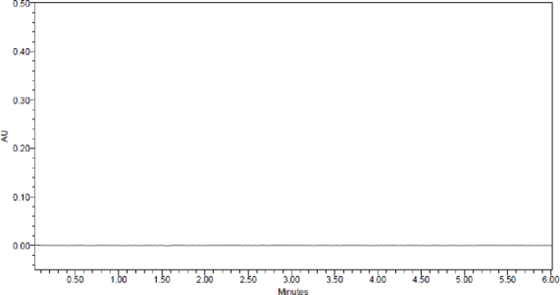
Figure 5: Chromatogram of blank Figure 6: Chromatogram of placebo
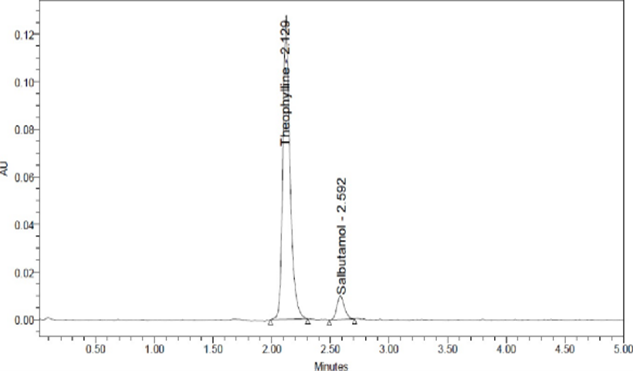
Figure 7: Typical Chromatogram
Linearity:
Table 2: Linearity table for Theophylline and Salbutamol.
|
Theophylline |
Salbutamol |
||
|
Conc (μg/mL) |
Peak area |
Conc (μg/mL) |
Peak area |
|
0 |
0 |
0 |
0 |
|
20 |
148290 |
0.4 |
12079 |
|
40 |
279149 |
0.8 |
22377 |
|
60 |
409063 |
1.2 |
34000 |
|
80 |
537748 |
1.6 |
44419 |
|
100 |
653495 |
2 |
56904 |
|
120 |
786096 |
2.4 |
66710 |

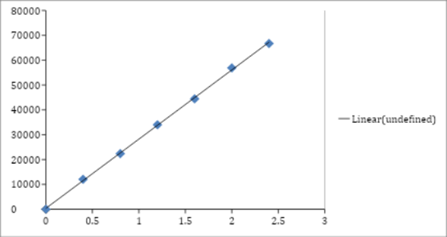
Figure 8: Calibration curve of Theophylline Figure 9: Calibration curve of Salbutamol
Precision:
System Precision:
Table 3: System precision table of Theophylline and Salbutamol
|
Sr. No |
Area of Theophylline |
Area of Salbutamol |
|
1. |
549487 |
44110 |
|
2. |
541550 |
43918 |
|
3. |
542613 |
44014 |
|
4. |
545404 |
44001 |
|
5. |
540522 |
43985 |
|
6. |
547623 |
44121 |
|
Mean |
544533 |
44025 |
|
S.D |
3564.3 |
77.7 |
|
%RSD |
0.7 |
0.2 |
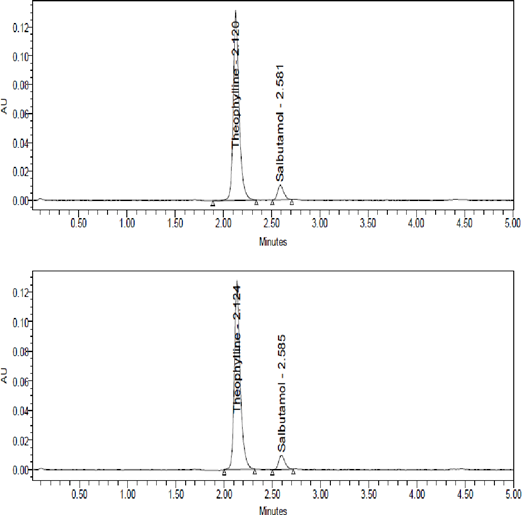
Figure 10: System precision chromatogram
Repeatability:
Table 4: Repeatability table of Theophylline and Salbutamol
|
Sr. No |
Area of Theophylline |
Area of Salbutamol |
|
1. |
543435 |
43746 |
|
2. |
540185 |
43650 |
|
3. |
542023 |
43657 |
|
4. |
542815 |
43861 |
|
5. |
543848 |
43585 |
|
6. |
546104 |
43644 |
|
Mean |
543068 |
43691 |
|
S.D |
1971.2 |
98.2 |
|
%RSD |
0.4 |
0.2 |
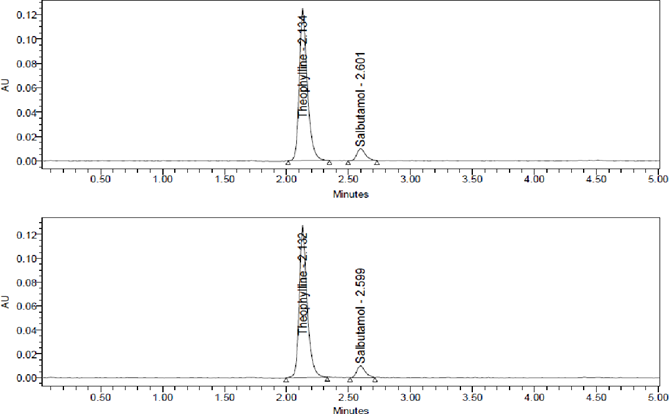
Figure 11: Repeatability chromatogram
Intermediate precision (Day_ Day Precision):
Table 5: Intermediate precision table of Theophylline and Salbutamol
|
Sr. No |
Area of Theophylline |
Area of Salbutamol |
|
1. |
537228 |
43229 |
|
2. |
537458 |
43546 |
|
3. |
531167 |
43678 |
|
4. |
538288 |
43958 |
|
5. |
532583 |
43789 |
|
6. |
536299 |
43748 |
|
Mean |
535504 |
43658 |
|
S.D |
2916.0 |
249.9 |
|
%RSD |
0.5 |
0.6 |
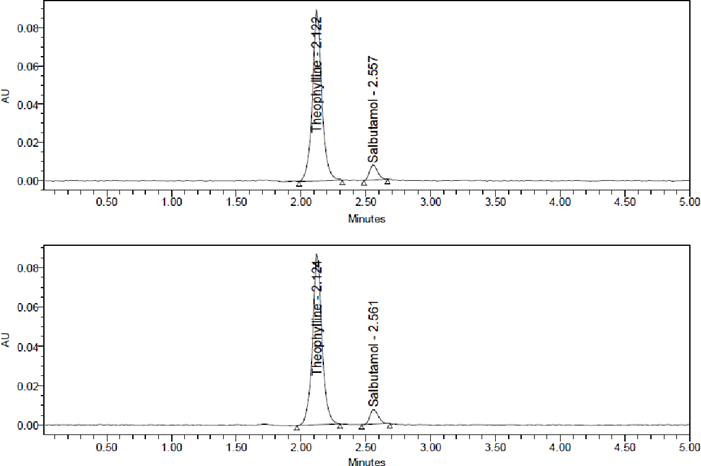
Figure 12: Inter Day precision Chromatogram
Accuracy:
Table 6: Accuracy table of Theophylline
|
% Level |
Amount Spiked (μg/mL) |
Amount recovered (μg/mL) |
% Recovery |
Mean %Recovery |
|
50% |
40 |
39.74 |
99.35 |
99.82 %
|
|
40 |
39.82 |
99.56 |
||
|
40 |
39.82 |
99.54 |
||
|
100% |
80 |
79.46 |
99.33 |
|
|
80 |
80.20 |
100.25 |
||
|
80 |
80.32 |
100.40 |
||
|
150% |
120 |
120.23 |
100.19 |
|
|
120 |
119.78 |
99.82 |
||
|
120 |
119.96 |
99.97 |
Table 7: Accuracy table of Salbutamol
|
% Level |
Amount Spiked (μg/mL) |
Amount recovered (μg/mL) |
% Recovery |
Mean % Recovery |
|
50% |
0.80 |
0.80 |
100.27 |
99.76% |
|
0.80 |
0.80 |
99.71 |
||
|
0.80 |
0.80 |
100.14 |
||
|
100% |
1.60 |
1.60 |
99.82 |
|
|
1.60 |
1.60 |
99.69 |
||
|
1.60 |
1.61 |
100.38 |
||
|
150% |
2.40 |
2.38 |
99.29 |
|
|
2.40 |
2.38 |
99.26 |
||
|
2.40 |
2.38 |
99.25 |
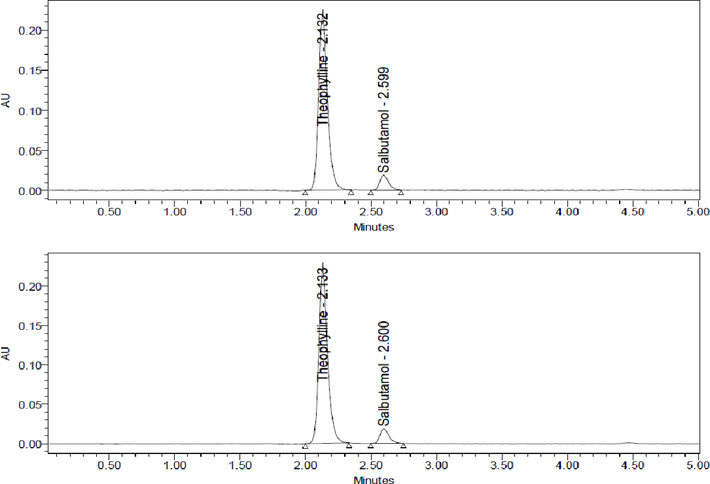
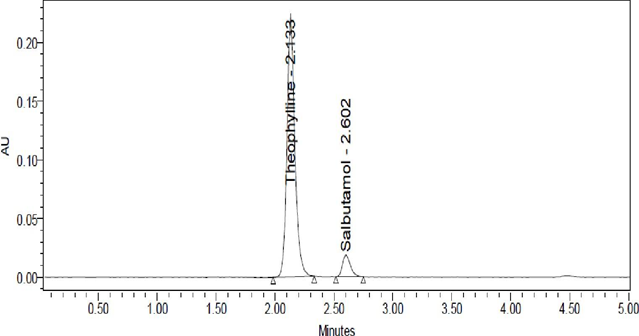
Figure 14: Accuracy 100% Chromatogram of Theophylline and Salbutamol
Sensitivity:
Table 8: Sensitivity table of Theophylline and Salbutamol
|
Molecule |
LOD |
LOQ |
|
Theophylline |
0.19 |
0.59 |
|
Salbutamol |
0.01 |
0.04 |
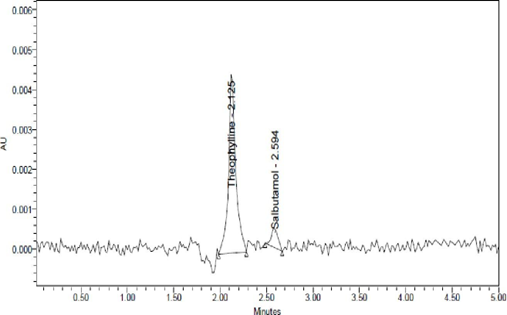
Figure 16: LOD Chromatogram of Standard
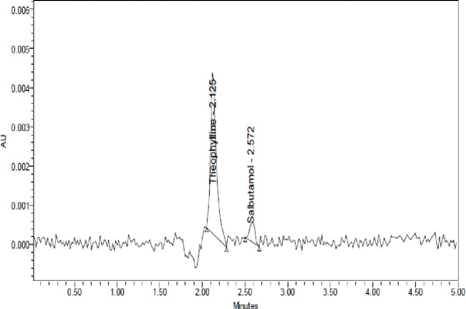
Figure 17: LOQ Chromatogram of Standard
Robustness:
Table 9: Robustness data for Theophylline and Salbutamol.
|
Sr. no |
Condition |
%RSD of Theophylline |
%RSD of Salbutamol |
|
1 |
Flow rate (-) 1.1ml/min |
0.8 |
0.7 |
|
2 |
Flow rate (+) 1.3ml/min |
0.3 |
0.1 |
|
3 |
Mobile phase (-) 70B:30A |
0.8 |
0.8 |
|
4 |
Mobile phase (+) 45B:55A |
0.2 |
0.5 |
|
5 |
Temperature (-) 25°C |
0.9 |
0.8 |
|
6 |
Temperature (+) 35°C |
0.6 |
0.1 |
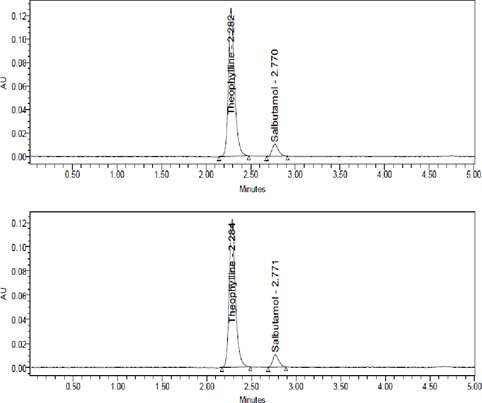
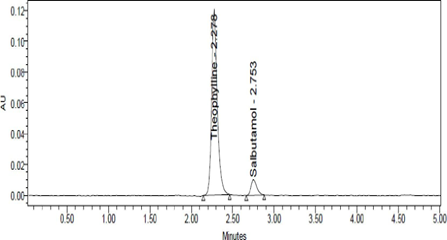
Figure 18: Flow minus Chromatogram of Theophylline and Salbutamol.
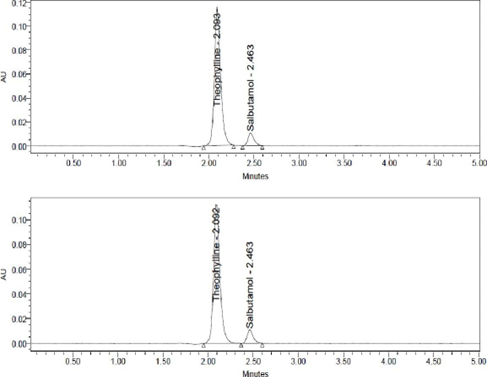
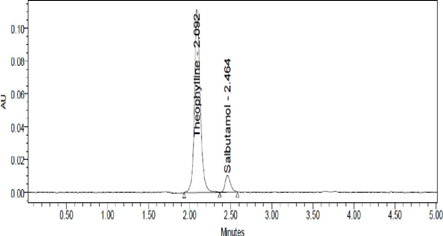
Figure 19: Mobile phase minus Chromatogram of Theophylline and Salbutamol.
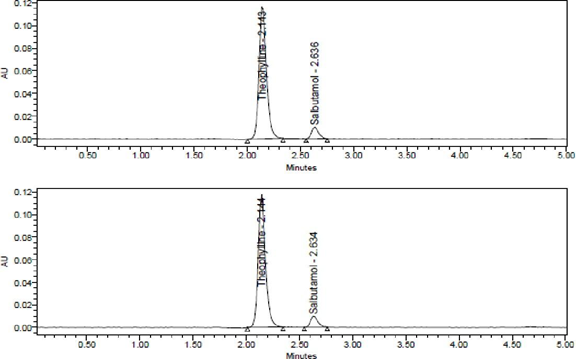
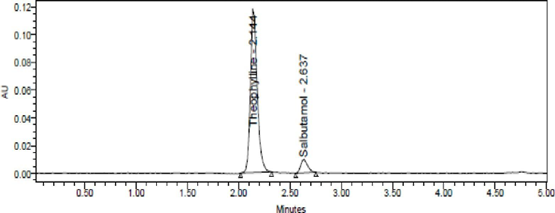
Figure 22: Temperature minus Chromatogram of Theophylline and Salbutamol.
Assay:
Rhodes pharmaceuticals, bearing the label claim Theophylline 200mg, Salbutamol 4mg. Assay was performed with the above formulation. Average % Assay for Theophylline and Salbutamol obtained was 99.63% and 99.14 % respectively.
Table 10: Assay Data of Theophylline
|
Sr. no |
Standard Area |
Sample area |
% Assay |
|
1 |
549487 |
543435 |
99.70 |
|
2 |
541550 |
540185 |
99.10 |
|
3 |
542613 |
542023 |
99.44 |
|
4 |
545404 |
542815 |
99.58 |
|
5 |
540522 |
543848 |
99.77 |
|
6 |
547623 |
546104 |
100.19 |
|
Avg |
544533 |
543068 |
99.63 |
|
Stdev |
3564.3 |
1971.2 |
0.4 |
|
%RSD |
0.7 |
0.4 |
0.4 |
Table 11: Assay Data of Salbutamol
|
Sr. no |
Standard Area |
Sample area |
% Assay |
|
1 |
44110 |
43746 |
99.27 |
|
2 |
43918 |
43650 |
99.05 |
|
3 |
44014 |
43657 |
99.07 |
|
4 |
44001 |
43861 |
99.53 |
|
5 |
43985 |
43585 |
98.90 |
|
6 |
44121 |
43644 |
99.04 |
|
Avg |
44025 |
43691 |
99.14 |
|
Stdev |
77.7 |
98.2 |
0.2 |
|
%RSD |
0.2 |
0.2 |
0.2 |
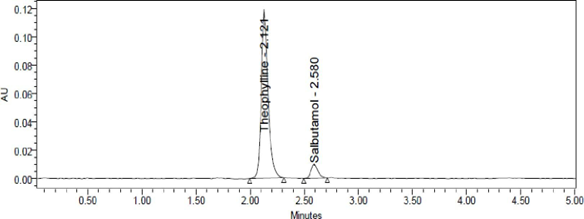
Figure 24: Chromatogram of working standard solution
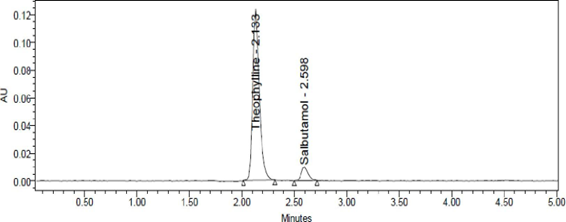
Figure 25: Chromatogram of working sample solution
DEGRADATION
Degradation Studies: Degradation studies were performed with the formulation and the degraded samples were injected. Assay of the injected samples was calculated and all the samples passed the limits of degradation
Table 12: Degradation Data of Theophylline
|
Sr. No |
Degradation Condition |
% Drug Degraded |
Purity Angle |
Purity Threshold |
|
1 |
Acid |
6.74 |
0.210 |
0.402 |
|
2 |
Alkali |
6.21 |
0.110 |
0.402 |
|
3 |
Oxidation |
6.21 |
0.210 |
0.402 |
|
4 |
Thermal |
3.71 |
0.126 |
0.421 |
|
5 |
UV |
1.79 |
0.208 |
0.419 |
|
6 |
Water |
0.65 |
0.218 |
0.423 |
Table 13: Degradation Data of Salbutamol
|
Sr. No |
Degradation Condition |
% Drug Degraded |
Purity Angle |
Purity Threshold |
|
1 |
Acid |
5.63 |
1.267 |
1.661 |
|
2 |
Alkali |
3.70 |
1.662 |
2.136 |
|
3 |
Oxidation |
4.30 |
1.501 |
1.862 |
|
4 |
Thermal |
2.67 |
1.244 |
1.657 |
|
5 |
UV |
1.94 |
1.326 |
1.639 |
|
6 |
Water |
0.34 |
1.465 |
1.742 |
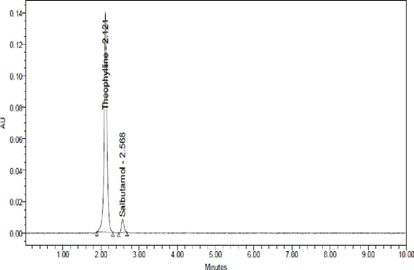
Figure 26: Acid chromatogram of Theophylline and Salbutamol
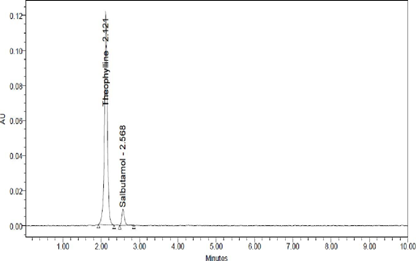
Figure 27: Base chromatogram of Theophylline and Salbutamol
CONCLUSION
A simple, accurate, precise method was developed for the simultaneous estimation of the Theophylline and Salbutamol in Tablet dosage form. Retention time of Theophylline and Salbutamol were found to be 2.129 min and 2.592 min. %RSD of theophylline and Salbutamol were found to be 0.4 and 0.2 respectively. %Recovery was obtained as 99.82 % and 99.76 % for Theophylline and Salbutamol respectively. LOD, LOQ values obtained from regression equations of Theophylline and Salbutamol were 0.19, 0.59 and 0.01, 0.04 respectively. The Regression equation of Theophylline is y = 6477.3x + 13338, and of y = 27841x + 374.37 Salbutamol. Retention times were decreased and that run time was decreased, so the method developed was simple and economical that can be adopted in regular Quality control tests in Industries.
REFERENCES

Arulmani M, Dr. V. Sekar, R. Krishnan, N. Mohanapriya, Development and Validation of a Simple RP-HPLC Method for the Simultaneous Estimation of Theophylline and Salbutamol in Tablet Dosage Form, Int. J. of Pharm. Sci., 2026, Vol 4, Issue 3, 1266-1280. https://doi.org/10.5281/zenodo.18981115
 10.5281/zenodo.18981115