

We use cookies to ensure our website works properly and to personalise your experience. Cookies policy
Department of Pharmaceutical Chemistry, Dr. Bapuji Salunkhe Institute of Pharmacy, Miraj, Maharashtra, Dr. Babasaheb Ambedkar Technological University, Lonere, Maharashtra, India. 416305.
A simple, rapid, economical, and eco-friendly UV-spectrophotometric method was developed for the estimation of Atorvastatin Calcium in bulk drug and pharmaceutical dosage forms. The method followed the principles of Green Analytical Chemistry by minimizing hazardous chemical usage, reducing waste generation, and employing safer solvents and energy-efficient analytical conditions. Atorvastatin Calcium was quantified by measuring absorbance at its selected ?max using UV-visible spectrophotometry. The method was validated according to ICH guidelines for linearity, accuracy, precision, specificity, robustness, LOD, and LOQ. The calibration curve demonstrated good linearity over the selected concentration range, with satisfactory correlation coefficient values. Accuracy studies showed good percentage recovery, while precision studies confirmed the reproducibility of the method. Stress degradation studies were conducted under acidic, alkaline, oxidative, thermal, and photolytic conditions to assess the stability-indicating capability. Significant degradation was observed under the applied stress conditions, confirming the susceptibility of Atorvastatin Calcium to degradation. The method successfully estimated the drug in the presence of degradation products without significant interference. Overall, the proposed green UV-spectrophotometric method was found to be simple, sensitive, accurate, precise, reliable, and environmentally friendly, making it suitable for routine quality control analysis of Atorvastatin Calcium in bulk and pharmaceutical formulations.
Atorvastatin is mainly used as an antihyperlipidemic agent in cardiovascular risk conditions. Atorvastatin belongs to the class of antihyperlipidemic agents known as statins. It is intended for lowering cholesterol level in the body. It acts by enzyme inhibition mechanism. Atorvastatin act by competitively inhibiting the 3-hydroxy-3-methyl glutaryl Co-enzyme-A(HMGCoA) reductase. HMG-CoA reductase is a rate determining enzyme in in the biosynthesis of cholesterol via mevalonate pathway. This enzyme catalyzes the HMGCoA conversion into mevalonate. Atorvastatin primarily shows its action in liver. It causes the decrease in hepatic cholesterol level, hence hepatic uptake of cholesterol increases and it results in lowering of plasma cholesterol level. Statins can reduce mortality and morbidity associated with coronary heart disorder. Atorvastatin appears as white crystalline powder. It is practically in soluble in water, slightly soluble in methylene chloride and soluble in methanol. Atorvastatin calcium is chemically {[R-(R, R*)]-2-(4-flurophenyl)-ß, ẟ-dihydroxy-5-(1-methylethyl) -3- phenyl-4-[phenylamino) carbonyl]-14- pyrrole-1-heptanoic acid, calcium salt (2:1) trihydrate. It is available in commercial pharmaceutical formulations for the treatment of hypercholesterolemia. it is effective to reduce both cholesterol and triglycerides. Main objective is to develop and validate UV visible method.[1]
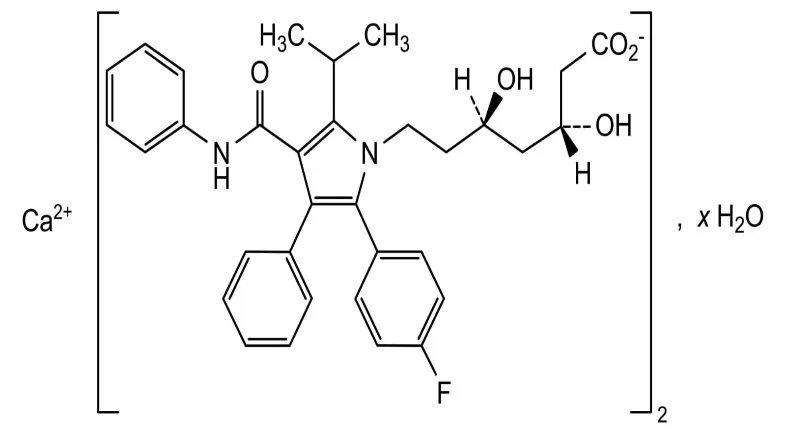
Fig. No. 1: Chemical structure of Atorvastatin Calcium
Green Analytical Chemistry (GAC) underlines minimizing the environmental and health impacts of analytical procedures. Green analytical chemistry advocate for reduction in solvent use, replacement of toxic reagents, energy conservation, and elimination of hazardous waste. Tool for assessing the greenness of analytical methods is the AGREE which is applied in this study.[2]
After a method has been formulated, it is crucial to evaluate its capability to produce accurate results consistently. Therefore, validating the analytical method is essential, confirming its resilience to outside factors. Validation includes specific parameters and also incorporates various statistical tools that enhance the method's credibility. Once a method has been established, thorough validation must occur before it is shared or transferred between laboratories. Validation procedures should be well-documented and conducted using properly calibrated tools and instruments. The purpose of analytical method validation is to confirm its appropriateness for the intended application. Validation of a pre-existing analytical method is necessary when modifications are made to the drug substance composition, its synthesis, or when there are alterations in the procedure.[3]
FDS is purposeful deterioration research in which a pharmaceutical material or drug product is subjected to an extra stress to quicken its normal rate of degradation. To ascertain whether unintentional exposure to situations different from the usual When exposure damages the product, stress testing may be helpful. The main cause of impurities in medication substances or products is degradation of the active pharmaceutical ingredient (API) or impurities associated to the procedure. The primary cause of the medication material's disintegration under various conditions is instability, which happened during manufacture, isolation, drying, storage, and shipping. The API's basic chemical stability regulates it. Any substance can degrade primarily through the following processes: heat, oxidation, photolysis, and hydrolysis. The generation of every degradation product that could occur under every circumstance is aided by the stress testing.
Various analytical techniques, including UV spectrophotometry, reverse-phase high-performance liquid chromatography (RP-HPLC), ultra-performance liquid chromatography (UPLC), and high-performance thin-layer chromatography (HPTLC), have been reported for the estimation of Atorvastatin Calcium. However, the development of a simple, economical, specific UV-Visible Spectrophotometric method including combination of solvents specifically optimized for pharmaceutical dosage forms remains limited. Therefore, there is a need for a statistically optimized, accurate, precise, and robust analytical method. Accordingly, the present study is focused on the development and optimization of a simple, efficient, and reliable UV-Visible Spectrophotometric method for the estimation of Atorvastatin Calcium in bulk drug and pharmaceutical formulations using a green solvent.
Digital weighing balance, Melting point apparatus, Sonicator, Hot air oven, Double beam UV/Visible Spectrophotometer.
Atorvastatin calcium powder was gifted by the AUROBINDO, Gujrat, India. All other chemicals and reagents used were of analytical grade.
Selection of a suitable solvent is influenced by the wavelength expected to be studied.
10 mg of drug was weighed & 10 ml of solvent system (water + ethanol) (50:50) were used to dissolve 10 mg of drug. To reach a concentration of 1000 µg/ml, a 1 ml solution was taken out of 1st stock solution and then diluted using 10 ml of solvent system. To final concentration of 10 µg/ml, a 1 ml solution taken out of the standard stock solution and diluted to a volume of 10 ml with solvent system. The solution was scanned between 200 and 400 nm, and when compared to solvent system as a blank, the greatest absorbance was recorded at 246 nm.
10 mg of drug was weighed & 10 ml of solvent system (water + ethanol) (50:50) were used to dissolve 10 mg of drug. To reach a concentration of 1000 µg/ml, a 1 ml solution was taken out of 1st stock solution and then diluted using 10 ml of solvent system. Then 10 ml volumetric flasks were filled with the standard solution, increasing in size from 0.2 ml to 1 ml. Then, using solvent system the volume in each flask was adjusted to 10 ml to produce a concentration range of 2 – 10 µg/ml. After measuring the solutions' absorbance at 246 nm with respect to the blank, a calibration curve for Atorvastatin calcium was plotted.
The UV method developed for was validated in terms of parameters. These parameters include linearity, precision, Accuracy, ruggedness, robustness, limit of quantification (LOQ) and limit of detection (LOD). The validation was carried out according to ICH guideline Q2 (R1). Validation was conducted using predefined calibration standards to ensure the method's reliability and reproducibility across different condition.
To reach concentration of 2, 4, 6, 8, and 10μg/ml, aliquots of the standard solution were precisely transferred into several flasks and diluted to volume with distilled water. The linearity of the process was assessed.
Absorbance was measured at a concentration of 6µg/ml using six replications of the sample solution on the same day.
Through intra-day and inter-day precision experiments, the method's precision was established. Three identical solutions were made and examined at a single day for the intra-day precision investigation. In the meanwhile, identical solutions were prepared and analyzed for three days in order to assess the inter-day precision. In addition, the RSD was computed.
The method's ruggedness was assessed for an Atorvastatin calcium concentration of 6μg/ml & by two analysts evaluate aliquots from a homogeneous slot under identical operational and environmental circumstances.
The method's robustness was assessed by varying the wavelength of Atorvastatin calcium by ±2 nm, from 246 nm to 244 nm and 248 nm.
Accuracy was performed by the recovery in percent. The study was carried out at three distinct percentage: 80%, 100%, and 120%. The percent recovery and RSD were calculated.
The LOD and the LOQ were determined utilizing the SD of the intercept and the slope of the curve.
Forced degradation aims to forcefully break down of the active ingredient. These investigations are utilized to assess an ability of method to quantify substance and the breakdown substances independently. FDS of selected API in bulk and formulation was carried out as per ICH guidelines Q1A (R2). It involves subjecting the drugs to factors such as heat, light, heat and acidic or alkaline conditions. This data is necessary for establishing the stability of drug across different conditions aiding in formulation development and ensuring compliance with regulatory requirements. The sample was exposed to following conditions.
Samples were treated with 10 ml of 0.1 M HCl & placed at room temperature for 2 hours. Then neutralize with 0.1 M NaOH solution and scanned in UV region at 246 nm. The same solution was scanned on 3th & 5th day to check the Inter-day effects.
Samples were treated with 10 ml of 0.1 M NaOH & placed at room temperature for 2 hours. Then neutralize with 0.1 M HCl solution and scanned in UV region at 246 nm. The same solution was scanned on 3rd & 5th day to check the Inter-day effects.
Samples were treated with 5% H2O2 & placed at room temperature for 2 hours. Scanned in UV region at 246 nm. The same solution was scanned on 5th day to check the Inter-day effects.
Sample was kept in oven at 50 °C for about 24 hours. Sample was dissolved in solvent system & scanned in UV region at 246 nm.
Sample was exposed to sunlight. On next day sample was dissolved in solvent system & scanned in UV region at 246 nm.
A solution comprising 10µg/ml was scanned between 200 and 400 nm, and the highest absorbance detected at 246 nm when compared to solvent system as a blank.
3.2 Analytical method development, validation & forced degradation study by using UV Spectrophotometry.
(a) Analytical method development by using UV spectrophotometry
Selection of a suitable solvent is influenced by the wavelength expected to be studied. The solvent thus used for present study was solvent system (water + ethanol) (50:50).
The final solution of 10µg/ml was scanned in the UV region of 200-400 nm with the highest absorbance at 246 nm against solvent system as a blank.
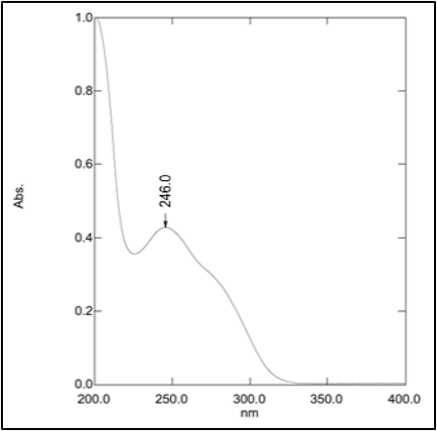
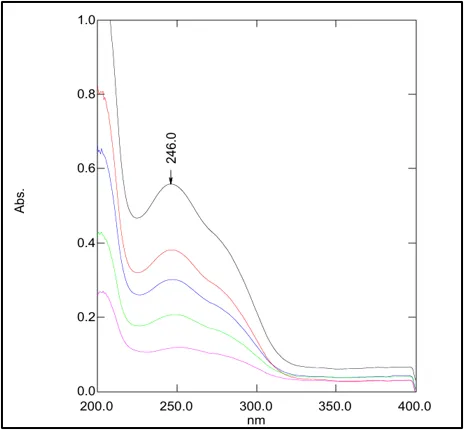
Fig. No. 2: UV spectrum of Fig. No. 3: Overlay spectrum of
Atorvastatin calcium Atorvastatin calcium
(b) Validation of developed analytical method by using UV spectrophotometry
1. Linearity:
The sample were scanned at concentration range of 2, 4, 6, 8, 10 µg/ml.
Table No. 1: Results of calibration for Atorvastatin calcium
|
Concentration (µg/ml) |
Absorbance |
Mean |
SD |
%RSD |
|
2 |
0.112 |
0.112 |
0.001 |
0.8928 |
|
0.113 |
||||
|
0.111 |
||||
|
4 |
0.213 |
0.214 |
0.0010 |
0.4672 |
|
0.214 |
||||
|
0.215 |
||||
|
6 |
0.307 |
0.306 |
0.001 |
0.3267 |
|
0.305 |
||||
|
0.306 |
||||
|
8 |
0.421 |
0.421 |
0.001 |
0.2371 |
|
0.422 |
||||
|
0.420 |
||||
|
10 |
0.516 |
0.517 |
0.0010 |
0.1934 |
|
|
0.518 |
|
|
|
|
0.517 |
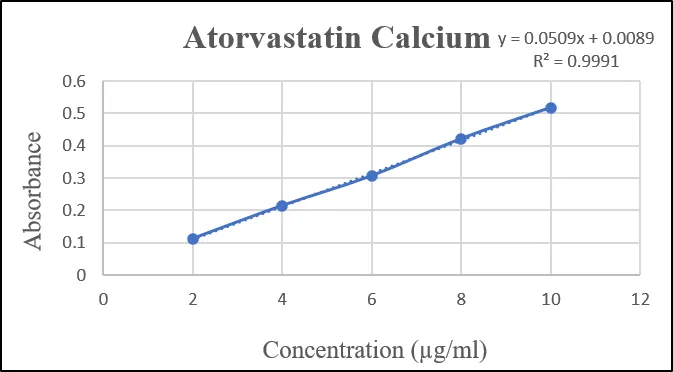
Fig. No. 4: Calibration curve of Atorvastatin calcium
2. System precision:
Absorbance was measured at a concentration of 6 µg/ml using six replications of the sample solution on the same day.
Table No. 2: System Precision results of Atorvastatin calcium
|
Concentration (µg/ml) |
Absorbance |
Conc. Found |
Mean |
SD |
% RSD |
|
6 |
0.300 |
5.8 |
5.9 |
0.075 |
1.272 |
|
0.305 |
5.9 |
||||
|
0.306 |
6 |
||||
|
0.303 |
5.9 |
||||
|
0.306 |
6 |
||||
|
0.304 |
5.9 |
3. Method Precision
Precision was carried out on Intraday and Inter-day at 3 various concentration and measurements were taken in triplicate for both studies.
Table No. 3: Intra-day precision data of Atorvastatin calcium
|
Concentration (µg/ml) |
Absorbance |
Conc. Found |
Mean |
SD |
% RSD |
|
2 |
0.090 |
1.76 |
1.77 |
0.015 |
0.861 |
|
0.092 |
1.79 |
||||
|
0.091 |
1.77 |
||||
|
6 |
0.300 |
5.8 |
5.9 |
0.1 |
1.694 |
|
0.305 |
5.9 |
||||
|
0.306 |
6 |
||||
|
10 |
0.529 |
10.38 |
10.36 |
0.011 |
0.0011 |
|
0.528 |
10.36 |
||||
|
0.528 |
10.36 |
Table No. 4: Inter-day precision of Atorvastatin calcium
|
Concentration (µg/ml) |
Absorbance |
Conc. Found |
Mean |
SD |
% RSD |
|
2 |
0.080 |
1.56 |
1.56 |
0.02 |
1.282 |
|
0.081 |
1.58 |
||||
|
0.079 |
1.54 |
||||
|
6 |
0.291 |
5.7 |
5.7 |
0.057 |
0.01 |
|
0.291 |
5.7 |
||||
|
0.296 |
5.8 |
||||
|
10 |
0.523 |
10.26 |
10.24 |
0.01 |
0.112 |
|
0.522 |
10.24 |
||||
|
0.522 |
10.24 |
4. Accuracy
The recovery study was carried out at three distinct percentage: 80%, 100%, & 120%.
Table No. 5: Recovery data of Atorvastatin calcium
|
Brand name |
Label claim |
Level |
Absorbance |
Conc. Found |
Mean |
SD |
% Recovery |
|
GenX Vast |
10 mg |
80 % |
0.102 |
1.99 |
1.90 |
0.08 |
98.04 |
|
0.094 |
1.83 |
||||||
|
0.097 |
1.89 |
||||||
|
100 % |
0.108 |
2.11 |
2.13 |
0.03 |
99.83 |
||
|
0.111 |
2.17 |
||||||
|
0.109 |
2.13 |
||||||
|
120 % |
0.119 |
2.32 |
2.37 |
0.05 |
101.9 |
||
|
0.122 |
2.38 |
||||||
|
0.124 |
2.42 |
5. Ruggedness
Ruggedness was established by analyzing the sample by two distinct analysts.
Table No. 6: Ruggedness data of Atorvastatin calcium
|
Analyst |
Concentration (µg/ml) |
Absorbance |
Conc. Found |
Mean |
SD |
% RSD |
|
Analyst 1 |
6 |
0.323 |
6.33 |
6.31 |
0.023 |
0.365 |
|
0.323 |
6.33 |
|||||
|
0.321 |
6.29 |
|||||
|
Analyst 2 |
6 |
0.283 |
5.55 |
5.51 |
0.03 |
0.553 |
|
0.281 |
5.51 |
|||||
|
0.280 |
5.49 |
6. Robustness
Robustness determined by subjecting change in the wavelength. The method was found to be robust and result are shown in Table No. 7.
Table No. 7: Robustness data of Atorvastatin calcium
|
Concentration (µg/ml) |
Wavelength (nm) |
Absorbance |
Conc. Found |
Mean |
SD |
% RSD |
|
6 |
244 |
0.297 |
5.8 |
5.7 |
0.030 |
0.527 |
|
0.294 |
5.76 |
|||||
|
0.295 |
5.78 |
|||||
|
6 |
248 |
0.295 |
5.7 |
5.75 |
0.03 |
0.531 |
|
0.292 |
5.72 |
|||||
|
0.294 |
5.76 |
7. LOD & LOQ:
Table No. 8: LOD & LOQ data
|
LOD |
3.3 × σ/s |
3.3 × 0.005689 ÷ 0.05085 |
0.369 μg/ml |
|
LOQ |
10 × σ/s |
10 × 0.005689 ÷ 0.05085 |
1.118 μg/ml |
Where,
σ = Std. deviation of the response
s = slope of the calibration curve
c) Forced degradation of API & It’s formulation by using UV spectrophotometry
Table No. 9: Results for Degradation of API
|
Stress condition |
Concentration (µg/ml) |
Time / day |
Absorbance |
Conc. Found |
Mean |
SD |
% RSD |
|
Acidic |
10 |
30 min |
0.508 |
9.97 |
9.95 |
0.028 |
0.284 |
|
0.506 |
9.93 |
||||||
|
60 min |
0.493 |
9.67 |
9.67 |
0.02 |
0.291 |
||
|
0.495 |
9.71 |
||||||
|
90 min |
0.482 |
9.46 |
9.44 |
0.028 |
0.299 |
||
|
0.480 |
9.42 |
||||||
|
3rd day |
0.451 |
8.85 |
8.81 |
0.056 |
0.642 |
||
|
0.447 |
8.77 |
||||||
|
5th day |
0.419 |
8.22 |
8.17 |
0.07 |
0.865 |
||
|
0.414 |
8.12 |
||||||
|
Alkali |
10 |
30 min |
0.528 |
10.37 |
10.33 |
0.021 |
0.285 |
|
0.527 |
10.34 |
||||||
|
60 min |
0.521 |
10.22 |
10.19 |
0.042 |
0.416 |
||
|
0.518 |
10.16 |
||||||
|
90 min |
0.514 |
10.08 |
10.04 |
0.049 |
0.492 |
||
|
0.510 |
10.01 |
||||||
|
3rd day |
0.498 |
9.77 |
9.73 |
0.056 |
0.581 |
||
|
0.494 |
9.69 |
||||||
|
5th day |
0.472 |
9.26 |
9.21 |
0.070 |
0.767 |
||
|
0.467 |
9.16 |
||||||
|
Oxidative
|
10 |
30 min |
0.509 |
9.99 |
9.97 |
0.028 |
0.283 |
|
0.507 |
9.95 |
||||||
|
60 min |
0.496 |
9.73 |
9.7 |
0.042 |
0.437 |
||
|
0.493 |
9.67 |
||||||
|
90 min |
0.482 |
9.46 |
9.4 |
0.021 |
0.223 |
||
|
0.484 |
9.49 |
||||||
|
3rd day |
0.456 |
8.94 |
8.9 |
0.049 |
0.555 |
||
|
0.452 |
8.87 |
||||||
|
5th day |
0.421 |
8.26 |
8.2 |
0.07 |
0.861 |
||
|
0.416 |
8.16 |
||||||
|
Thermal |
10 |
3rd day |
0.543 |
10.65 |
10.6 |
0.035 |
0.332 |
|
0.540 |
10.60 |
||||||
|
5th day |
0.534 |
10.48 |
10.4 |
0.028 |
0.270 |
||
|
0.532 |
10.44 |
||||||
|
Photolytic |
10 |
3rd day |
0.490 |
9.61 |
9.56 |
0.070 |
0.739 |
|
0.485 |
9.51 |
||||||
|
5th day |
0.465 |
9.12 |
9.14 |
0.02 |
0.309 |
||
|
0.467 |
9.16 |
Table No. 10: % of Degradation of API
|
Stress Condition |
Day |
Area of Standard |
Area of Degraded Sample |
Degraded Up to % |
Actual % Degradation |
|
Acidic |
5th
|
0.517 |
0.416 |
80.46 |
19.54 |
|
Alkali |
0.517 |
0.469 |
86.71 |
13.29 |
|
|
Oxidative |
0.517 |
0.418 |
80.85 |
19.15 |
|
|
Thermal |
0.517 |
0.533 |
92.11 |
7.89 |
|
|
Photolytic |
0.517 |
0.466 |
90.13 |
9.87 |
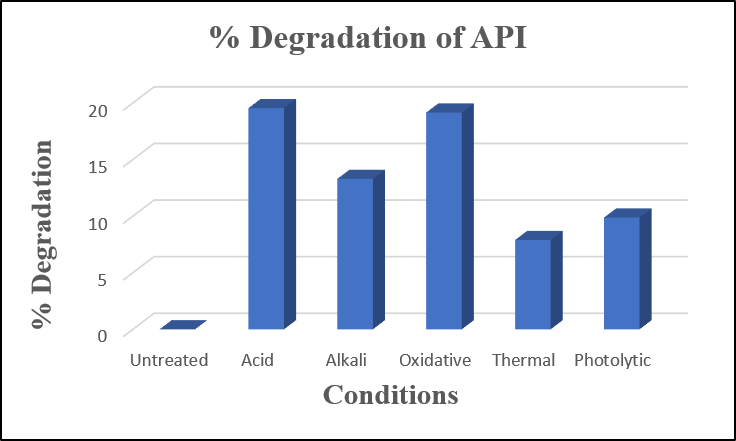
Fig. No. 5: Graphical representation showing degradation of API
Table No. 11: Results for Degradation of Atorvastatin calcium formulation
|
Stress condition |
Concentration (µg/ml) |
Time / day |
Absorbance |
Conc. Found |
Mean |
SD |
% RSD |
|
Acidic |
10 |
30 min |
0.524 |
10.28 |
10.2 |
0.014 |
0.137 |
|
0.525 |
10.30 |
||||||
|
60 min |
0.514 |
10.08 |
10.1 |
0.028 |
0.280 |
||
|
0.516 |
10.12 |
||||||
|
90 min |
0.500 |
9.81 |
9.8 |
0.01 |
0.144 |
||
|
0.501 |
9.83 |
||||||
|
3rd day |
0.476 |
9.34 |
9.3 |
0.05 |
0.608 |
||
|
0.472 |
9.26 |
||||||
|
5th day |
0.442 |
8.67 |
8.6 |
0.02 |
0.326 |
||
|
0.440 |
8.63 |
||||||
|
Alkali |
10 |
30 min |
0.508 |
9.97 |
9.9 |
0.014 |
0.141 |
|
0.507 |
9.95 |
||||||
|
60 min |
0.501 |
9.83 |
9.8 |
0.042 |
0.430 |
||
|
0.504 |
9.89 |
||||||
|
90 min |
0.494 |
9.69 |
9.7 |
0.028 |
0.291 |
||
|
0.496 |
9.73 |
||||||
|
3rd day |
0.481 |
9.44 |
9.4 |
0.02 |
0.298 |
||
|
0.483 |
9.48 |
||||||
|
5th day |
0.459 |
9 |
8.8 |
0.176 |
1.99 |
||
|
0.446 |
8.75 |
||||||
|
Oxidative
|
10 |
30 min |
0.534 |
10.48 |
10.54 |
0.084 |
0.805 |
|
0.540 |
10.6 |
||||||
|
60 min |
0.527 |
10.3 |
10.3 |
0.028 |
0.274 |
||
|
0.525 |
10.30 |
||||||
|
90 min |
0.521 |
10.22 |
10.2 |
0.07 |
0.688 |
||
|
0.526 |
10.32 |
||||||
|
3rd day |
0.486 |
9.53 |
9.5 |
0.006 |
0.066 |
||
|
0.486 |
9.5 |
||||||
|
5th day |
0.448 |
8.7 |
8.8 |
0.01 |
0.160 |
||
|
0.449 |
8.8 |
||||||
|
Thermal |
10 |
3rd day |
0.557 |
10.93 |
10.9 |
0.04 |
0.389 |
|
0.554 |
10.87 |
||||||
|
5th day |
0.548 |
10.75 |
10.7 |
0.02 |
0.262 |
||
|
0.550 |
10.79 |
||||||
|
Photolytic |
10 |
3rd day |
0.476 |
9.34 |
9.3 |
0.014 |
0.151 |
|
0.477 |
9.36 |
||||||
|
5th day |
0.458 |
8.98 |
8.9 |
0.063 |
0.712 |
||
|
0.453 |
8.89 |
Table No. 12: % of Degradation of formulation
|
Stress Condition |
Day |
Area of Standard |
Area of Degraded Sample |
Degraded Up to % |
Actual % Degradation |
|
Acidic |
5th |
0.517 |
0.441 |
85.29 |
14.71 |
|
Alkali |
0.517 |
0.453 |
89.62 |
10.90 |
|
|
Oxidative |
0.517 |
0.448 |
86.65 |
13.35 |
|
|
Thermal |
0.517 |
0.549 |
93.55 |
6.45 |
|
|
Photolytic |
0.517 |
0.455 |
91.72 |
8.28 |
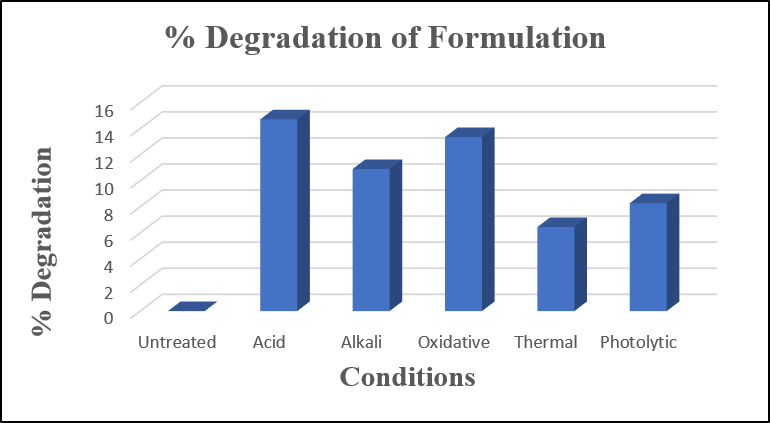
Fig. No. 6: Graphical representation showing degradation of Atorvastatin calcium formulation
AGREE = Analytical GREEnness Metric Approach and Software
The Analytical GREEnness is a tool intended to aid the User in evaluating the environmental and occupational hazards associated with a particular analytical procedure based on the 12 principles of Green Analytical Chemistry.
parameters in the analytical Greenness tool being checked as given in Figure. This software provides details on reagents, procedures, reagent toxicity, power usage, and other topics.
The criteria that have been presented align with the twelve SIGNIFICANCE principles, which can be adjusted in weight to offer a certain level of flexibility. Every one of the twelve input variables is converted to a normal 0–1 scale. The ultimate evaluation result is the sum of the assessment results for each premise. This leads to the creation of a graph that resembles a clock, with the overall score and color representation displayed in the middle. The greenness evaluation report for the experimental is shown in Figure.
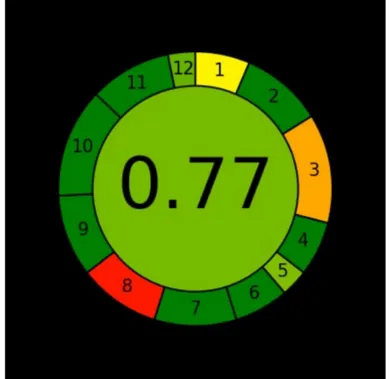
Fig No. 7: Green assessment
Analytical GREEnness is a metric system for the assessment of greenness of analytical procedures based on the SIGNIFICANCE principles. It is comprehensive (by incorporation of each of the 12 principles), flexible (by the possibility to assign weights), easy to interpret (the output is a colored pictogram, showing the structure of weak and strong points), and easy to perform (with a user-friendly GUI software). The freely downloadable software makes the analysis very fast and straightforward. The analysis can be performed in a few minutes. The case studies present full applicability of AGREE to various analytical methodologies.
CONCLUSION
The technique for estimating Atorvastatin calcium in bulk and formulation was developed and validated using UV Spectrophotometric method. The findings and statistical parameters indicate how easy, quick, reliable the suggested analytical method is UV-spectroscopic instruments are readily available in all pharmaceutical research and testing laboratories. The method used for estimation of Atorvastatin calcium in bulk and dosage forms was found to be accurate, precise, rugged and robust in nature. This validated method will help the researchers and analysts to assure the quality of novel antihyperlipidemic drug Atorvastatin calcium in bulk & it’s tablet formulation during routine quality control analysis. The forced degradation was carried out as per ICH guideline Q1A (R2). The sample was exposed to acid, alkali, oxidative, thermal & photolytic conditions. The proposed method is stability indicating and could be effectively applied to the degradation studies in Atorvastatin calcium drug substance and in its tablet dosage form. The drug has undergone more significant degradation under acidic and oxidative conditions whereas mild degradation under alkali condition. So, it has been concluded that Atorvastatin calcium is more sensitive to acidic and oxidative compared to alkali, photolytic & thermal conditions.
ACKNOWLEDGEMENTS:
Authors are thankful to Principal, Dr. Bapuji Salunkhe Institute of Pharmacy, Miraj, Maharashtra, India for providing laboratory facilities and constant encouragement.
CONFLICT OF INTEREST
The author(s) declare(s) that they have no declaration of interests to disclose.
REFERENCES



Vrushabh Madake, Sanskruti More, Sakshi Gavali, A Green Analytical Method Development, Validation and Stress Degradation Studies of Atorvastatin Calcium in Bulk and Formulation by UV-Visible spectrophotometric Method, Int. J. of Pharm. Sci., 2026, Vol 4, Issue 8, 4678-4690, https://doi.org/10.5281/zenodo.22144444
 10.5281/zenodo.22144444