

We use cookies to ensure our website works properly and to personalise your experience. Cookies policy
Pharmaceutical Analysis, Centre for Pharmaceutical Science, UCESTH, JNTUH, Kukatpally, Hyderabad.
A reverse-phase high-performance liquid chromatography (RP-HPLC) method was investigated for the determination of lerodalcibep in bulk drug and pharmaceutical dosage form. Chromatographic separation was reported using a Kromasil C18 column (250 × 4.6 mm, 5 µm) with a mobile phase consisting of 0.1% trifluoroacetic acid and acetonitrile (60:40, v/v). The flow rate was 1.0 mL/min, detection was performed at 270 nm, and the column temperature was 30°C. The method was evaluated for system suitability, linearity, precision, accuracy, sensitivity, robustness, assay and forced-degradation behavior. The manuscript reports system precision of 0.3% RSD, intermediate precision of 0.5% RSD, mean accuracy of 99.44%, and mean assay of 99.68%. The reported limits of detection and quantification were 0.08 and 0.24, respectively; units and calculation details require confirmation. Calibration details and several method-specific experimental particulars must be verified against the original records before definitive conclusions on validation and stability-indicating capability are made.
Analytical methods are essential for the identification, quantification and quality assessment of pharmaceutical substances in bulk materials and dosage forms. Chromatographic techniques, particularly high-performance liquid chromatography (HPLC), are widely used because they can separate analytes from components of complex mixtures and support quantitative analysis.
Reverse-phase HPLC uses a relatively non-polar stationary phase and a comparatively polar mobile phase. Method performance depends on factors including stationary-phase chemistry, mobile-phase composition, flow rate, temperature, detection wavelength and sample preparation. Appropriate method development and validation are therefore required to establish that a procedure is suitable for its intended analytical purpose.
Lerodalcibep is described in the source manuscript as a PCSK9 blocker used with diet and exercise to lower LDL cholesterol in people with elevated cholesterol. The source also describes it as a synthetic fusion protein. These pharmacological and structural statements should be supported by suitable primary or authoritative references before submission.
The objective of this work was to develop and evaluate an RP-HPLC method for the determination of lerodalcibep in bulk drug and pharmaceutical dosage form, including assessment of relevant validation characteristics and forced-degradation behavior. The precise research gap and novelty statement should be supported by a review of previously published analytical methods for lerodalcibep.
MATERIALS AND METHOD
Chemicals and reagents
The chemicals and reagents used in the present study included acetonitrile (HPLC grade), water (HPLC grade), methanol (HPLC grade), potassium dihydrogen orthophosphate (AR grade), orthophosphoric acid (AR grade), and a Millipore membrane filter (0.2 µm).
Instrumentation and chromatographic conditions
HPLC instrument used was of WATERS HPLC 2965 SYSTEM with Auto Injector and PDA Detector. Software used is Empower 2. UV-VIS spectrophotometer PG Instruments T60 with special bandwidth of 2mm and 10mm and matched quartz was be used for measuring absorbance for Lerodalcibep solutions. Sonicator (Ultrasonic sonicator), PH meter (Thermo scientific), Micro balance (Sartorius), Vacuum filter pump, Kromasil C18 column (250 × 4.6 mm, 5 µm); mobile phase comprising 0.1% trifluoroacetic acid and acetonitrile (60:40, v/v); flow rate 1.0 mL/min; detection wavelength 270 nm; and column temperature 30°C.
Diluent: Based up on the solubility of the drugs, diluent was selected, Acetonitrile and Water taken in the ratio of 50:50
Preparation of Standard stock solutions: Accurately weighed 25 mg of Lerodalcibep transferred 25ml and volumetric flasks, 3/4 Th of diluents was added and sonicated for 10 minutes. Flasks were made up with diluents and labeled as Standard stock solution (1000µg/ml of Lerodalcibep)
Preparation of Standard working solutions (100% solution): 1ml of Lerodalcibep from each stock solution was pipetted out and taken into a 10ml volumetric flask and made up with diluent. (100µg/ml of Lerodalcibep)
Preparation of Sample stock solutions: Accurately transfer 1.0 mL of the syringe solution (equivalent to 250 mg of Lerodalcibep) into a 100 mL volumetric flask. Add about 70 mL of diluent and sonicated for 25 min, further the volume was made up with diluent and filtered by HPLC filters. (2500 µg/ml of Lerodalcibep)
Preparation of Sample working solutions (100% solution): 0.4ml of filtered sample stock solution was transferred to 10ml volumetric flask and made up with diluent. (100µg/ml of Lerodalcibep)
Preparation of buffer:0.1%OPA Buffer but then specifies perchloric acid, while the optimized mobile phase is described as trifluoroacetic acid.
Method validation
System suitability and system precision
The 100 µg/mL standard solution was injected six times to assess system suitability. Report individual retention times and peak areas, mean, standard deviation, %RSD, theoretical plate count, tailing factor and any resolution values where relevant. The reported peak-area results were 667224, 664519, 666707, 665701, 664450 and 661750; mean 665059; standard deviation 1971.2; and %RSD 0.3. A separate chromatographic table reports retention times, peak areas, plate counts and tailing factors; reconcile these values with the final system-suitability.
Table 1: System suitability and system precision
|
Injection |
Retention time (min) |
Peak area |
USP plate count |
Tailing factor |
|
1 |
2.465 |
656484 |
2788 |
1.47 |
|
2 |
2.468 |
657909 |
2856 |
1.43 |
|
3 |
2.468 |
653308 |
2770 |
1.42 |
|
4 |
2.470 |
652703 |
2890 |
1.48 |
|
5 |
2.471 |
655078 |
2762 |
1.49 |
|
6 |
2.481 |
654165 |
2890 |
1.46 |
plate counts above 2000 and tailing factors below 2. Include resolution where applicable and clearly identify which injection series supports each reported statistic.
Linearity
A range of 25–150% is reported. Add the nominal and actual concentrations, peak area at each level, replicate count, regression equation, slope, intercept, correlation coefficient and residual assessment, using the original calibration data. The summary reports R² = 0.999, slope = 6733.8, intercept = 961.27 and equation y = 6733.8x + 961.27; verify these against the calibration plot and raw data.
Accuracy
Accuracy was assessed at 50%, 100% and 150%. The reported individual recoveries were 99.40%, 99.44% and 99.50% at 50%; 99.53%, 99.17% and 99.75% at 100%; and 99.56%, 99.53% and 99.08% at 150%. The manuscript reports an overall mean recovery of 99.44%. Confirm the calculation and provide level-wise means and %RSD.
Table 2: Accuracy
|
Level |
Amount spiked (µg/mL) |
Amount recovered (µg/mL) |
Recovery (%) |
|
50% |
50 |
49.70 |
99.40 |
|
50% |
50 |
49.72 |
99.44 |
|
50% |
50 |
49.75 |
99.50 |
|
100% |
100 |
99.53 |
99.53 |
|
100% |
100 |
99.17 |
99.17 |
|
100% |
100 |
99.75 |
99.75 |
|
150% |
150 |
149.33 |
99.56 |
|
150% |
150 |
149.29 |
99.53 |
|
150% |
150 |
148.62 |
99.08 |
Precision
System precision: peak areas 667224, 664519, 666707, 665701, 664450 and 661750; reported mean 665059, SD 1971.2 and %RSD 0.3.
Intermediate precision: peak areas 654576, 650719, 659325, 659160, 657208 and 655128; reported mean 656019, SD 3261.1 and %RSD 0.5. Describe analyst, day, instrument or other changed conditions as applicable.
Sensitivity: LOD and LOQ
The reported LOD and LOQ are 0.08 and 0.24. Confirm and state the units, concentration basis, calculation procedure, equations and supporting data. If calculated from calibration slope and response standard deviation, report those inputs. State whether LOQ was experimentally verified for acceptable precision and accuracy.
Robustness
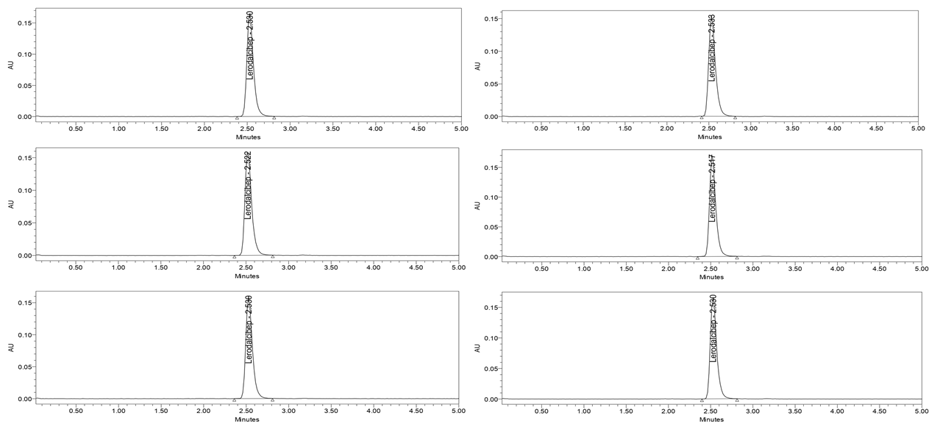
The robustness testing with changes in flow rate, mobile-phase composition and column temperature, with duplicate injections and %RSD values within the stated limit. However, conditions differ between the method narrative and table. The table lists flow at 0.9 and 1.1 mL/min, mobile-phase compositions 55:45 and 45:55, and temperatures 27°C and 33°C; the narrative instead mentions 25°C and 35°C. Verify the actual settings, the meaning of the ± notation, and all results before finalizing.
Tale 3: Robustness
|
Parameter |
Reported nominal condition |
Reported variation |
Reported %RSD |
|
Flow rate |
1.0 mL/min |
0.9 mL/min |
0.1 |
|
Flow rate |
1.0 mL/min |
1.1 mL/min |
0.2 |
|
Mobile phase |
60:40 |
55:45 |
0.4 |
|
Mobile phase |
60:40 |
45:55 |
0.3 |
|
Column temperature |
30°C |
27°C |
0.9 |
|
Column temperature |
30°C |
33°C |
0.4 |
Degradation studies
Confirm experimental details, including reagent concentration, exposure time, temperature, neutralization/dilution steps and whether the reported percentage represents assay remaining or degradation. The oxidation, acid and alkali procedures specify 30 minutes at “600 c”; this has been interpreted nowhere in this report and must be confirmed from the laboratory record.
Table 4: Degradation studies
|
Stress condition |
Drug reported as undegraded (%) |
Drug reported as degraded (%) |
|
Acid |
95.45 |
4.55 |
|
Alkali |
95.92 |
4.08 |
|
Oxidation |
96.28 |
3.72 |
|
Thermal |
97.08 |
2.92 |
|
UV |
98.18 |
1.82 |
|
Water/neutral |
99.17 |
0.83 |
Reported procedures include peroxide treatment with 20% hydrogen peroxide; acid and alkali treatment with 2N hydrochloric acid and 2N sodium hydroxide, respectively; dry heat at 105°C for 6 hours; UV exposure described as 7 days or 200 Wh/m²; and neutral hydrolysis in water under reflux for 6 hours at 60°C. Confirm and standardize these conditions. Include chromatograms, peak-purity evidence where available, mass balance and discussion of degradation-product separation before asserting stability-indicating performance.
ASSAY
The reported individual assay results were 99.86%, 99.75%, 99.78%, 99.62%, 99.74% and 99.33%; mean 99.68%, SD 0.188 and %RSD 0.2. Describe the calculation formula, standard/sample preparation and number of determinations.
Table 5: ASSAY
|
Sample |
Assay (%) |
|
1 |
99.86 |
|
2 |
99.75 |
|
3 |
99.78 |
|
4 |
99.62 |
|
5 |
99.74 |
|
6 |
99.33 |
|
Mean |
99.68 |
|
SD |
0.188 |
|
%RSD |
0.2 |
Reported procedures include peroxide treatment with 20% hydrogen peroxide; acid and alkali treatment with 2N hydrochloric acid and 2N sodium hydroxide, respectively; dry heat at 105°C for 6 hours; UV exposure described as 7 days or 200 Wh/m²; and neutral hydrolysis in water under reflux for 6 hours at 60°C. Confirm and standardize these conditions. Include chromatograms, peak-purity evidence where available, mass balance and discussion of degradation-product separation before asserting stability-indicating performance.
RESULTS AND DISCUSSIONS
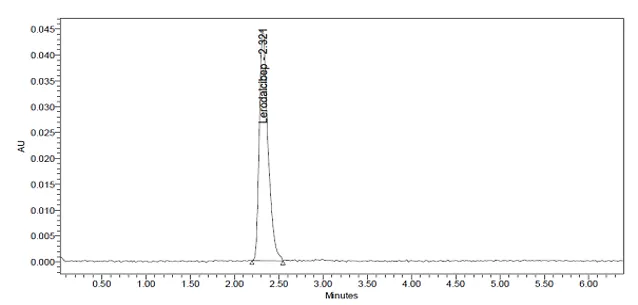
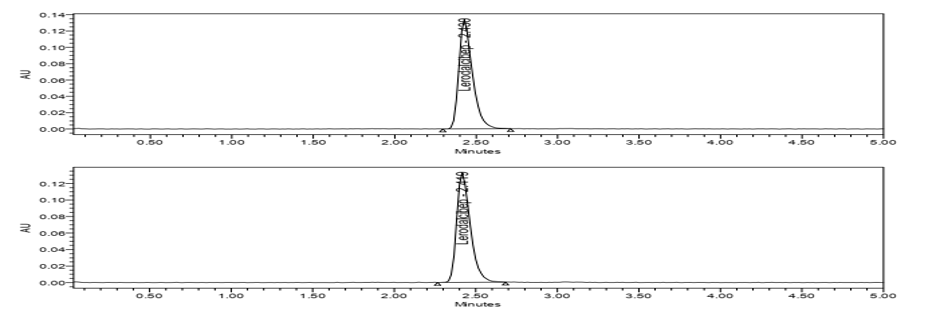
Fig 1: OPTIMIZED CHROMATOGRAM
Specificity:
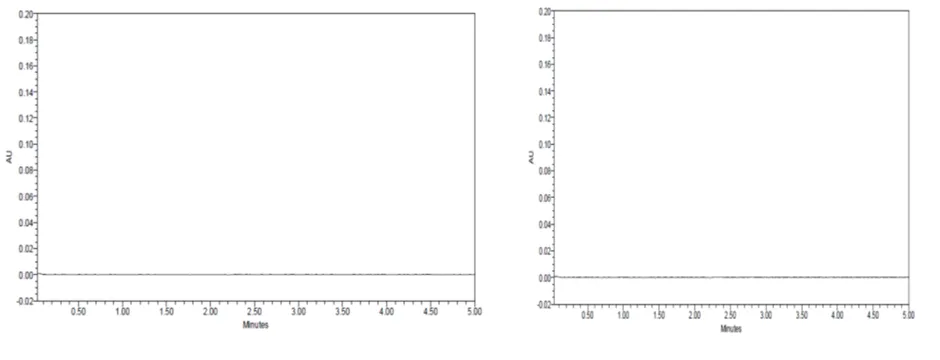
Fig 2: blank Chromatogram Placebo Chromatogram
Linearity:
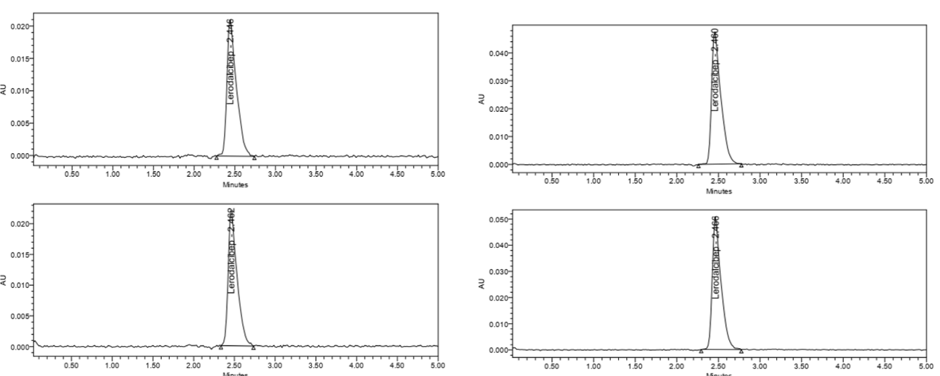
LNT 25% LNT 50%
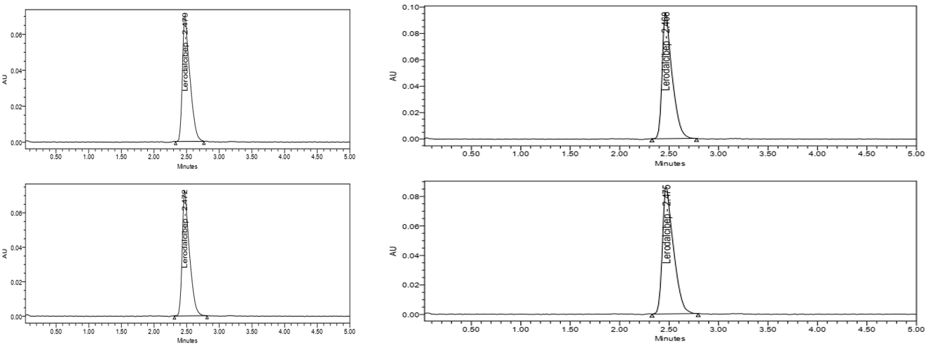
LNT 75% LNT 100%
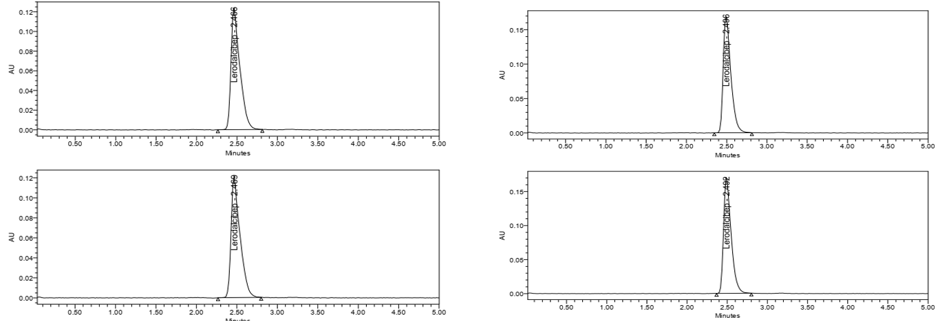
LNT 125% LNT 150 %
Fig 3: Linearity of 25%,50%,75%,100%,125%,150% Chromatogram
Accuracy:
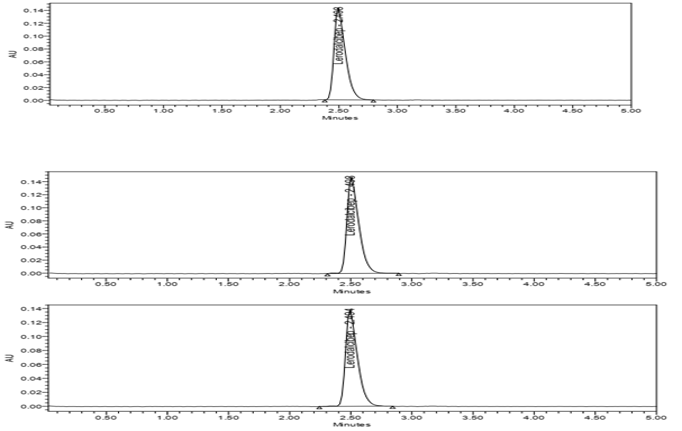
Accuracy 50% Chromatogram
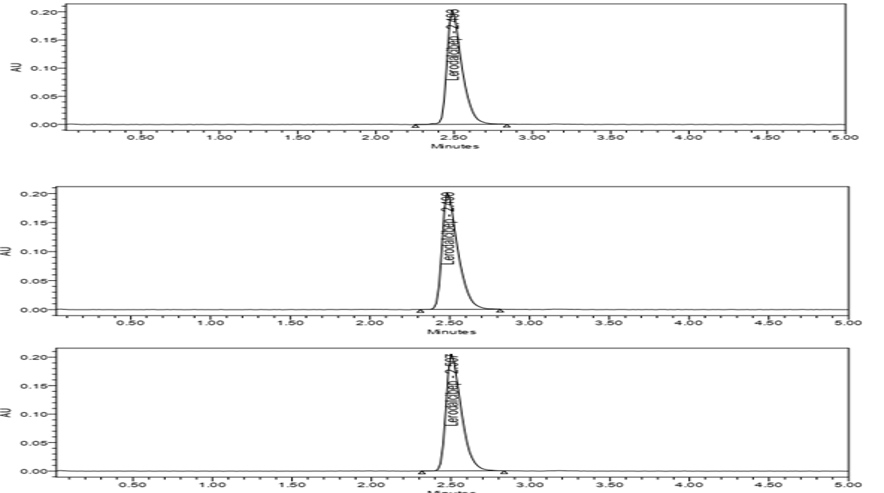
Accuracy 100% Chromatogram
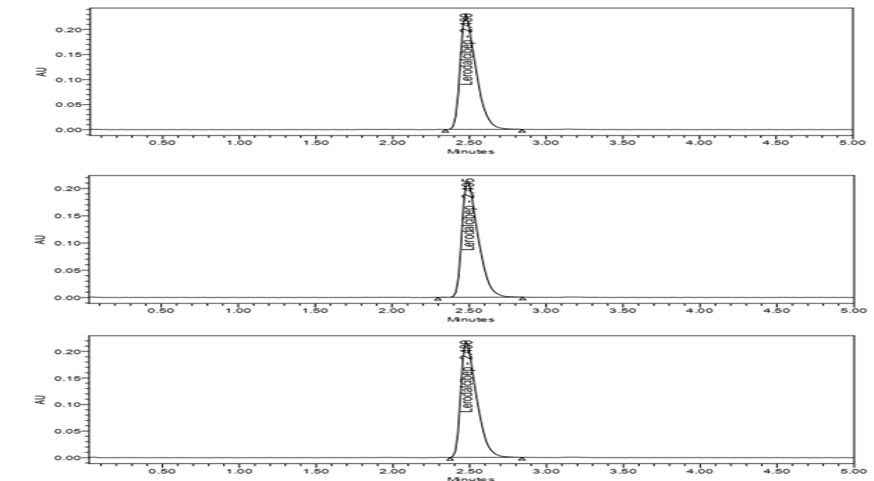
Accuracy 150% Chromatogram
Fig 4: Accuracy of 50%,100%,150% Chromatogram
Precision:
Repeatability:
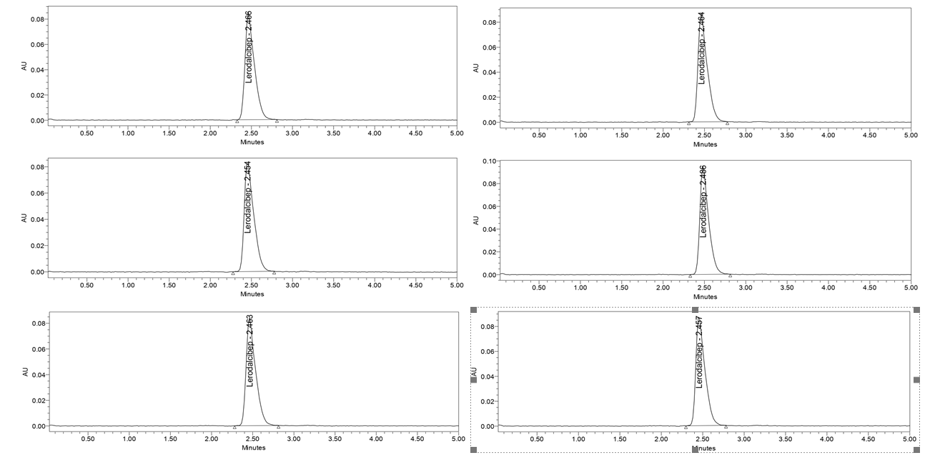
Repeatability Chromatogram
Intermediate precision Chromatogram
Fig 5: Repeatability Chromatogram, Intermediate precision Chromatogram
Sensitivity:
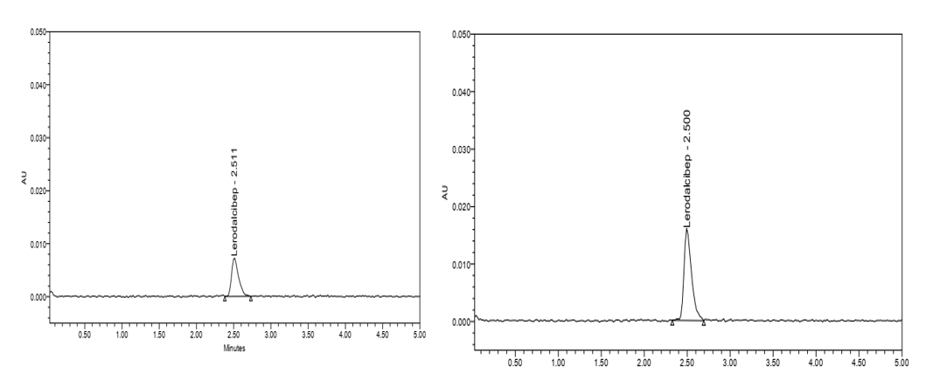
LOD LOQ
Fig 6: LOD, LOQ Chromatogram
Robustness:
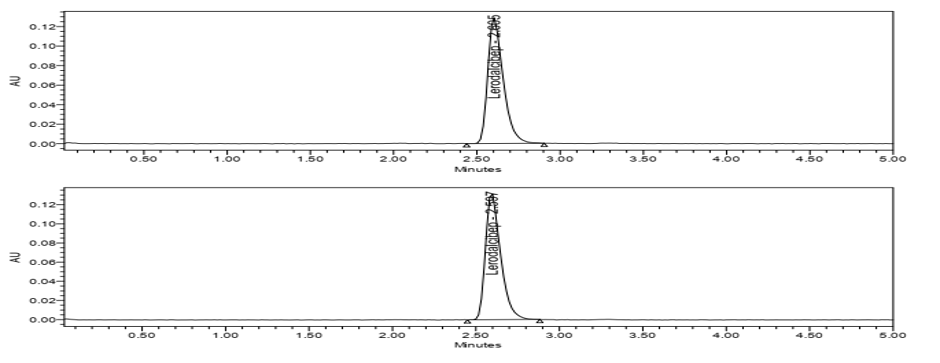
Flow minus Chromatogram of Lerodalcibep
Flow plus Chromatogram of Lerodalcibep
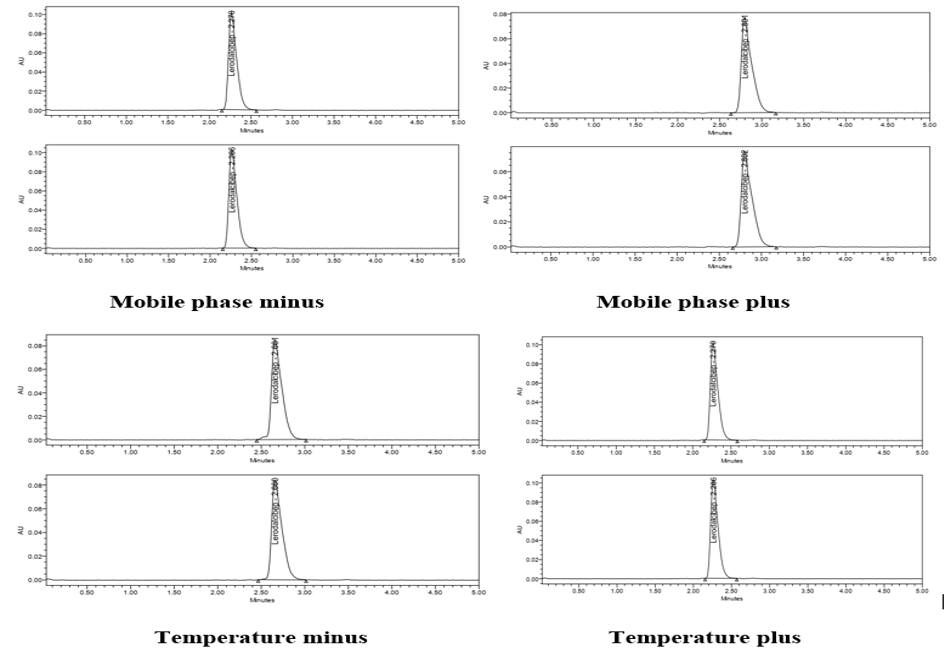
Fig 7: Robustness conditions like Flow minus (0.9ml/min), Flow plus (1.1ml/min), mobile phase minus, mobile phase plus, temperature minus (25°C) and temperature plus(35°C)
ASSAY:
working std working sample
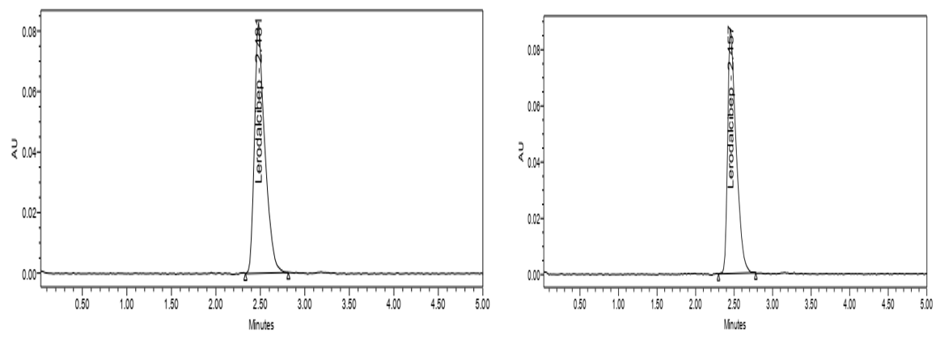
Fig 8: Assay Chromatogram of standard, Assay Chromatogram of sample
Degradation studies:
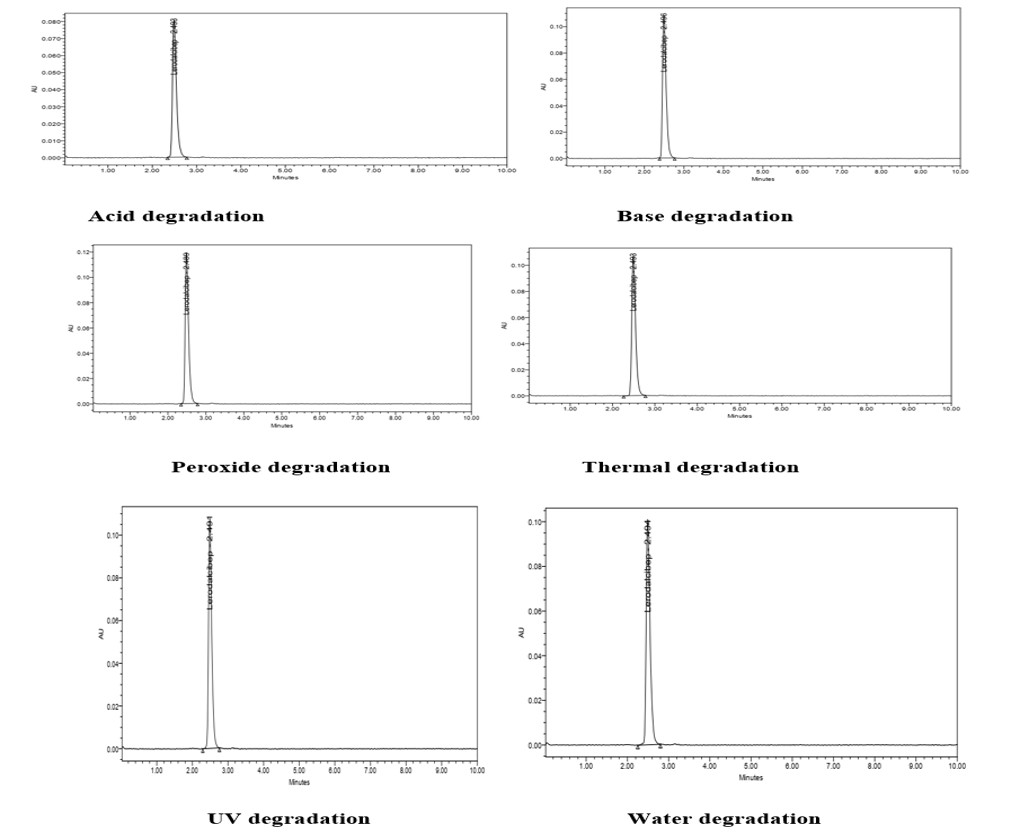
Fig 9: Acid, Base, Peroxide, Thermal, UV, Water degradation chromatogram
The reported chromatographic conditions were a Kromasil C18 column (250 × 4.6 mm, 5 µm), mobile phase of 0.1% trifluoroacetic acid: acetonitrile (60:40, v/v), flow rate 1.0 mL/min, detection at 270 nm and column temperature 30°C. Present representative chromatograms for blank, placebo, standard, linearity levels, precision, accuracy, robustness, assay and each stress condition with legible axes, peak labels and figure numbers.
System-precision and intermediate-precision results are reported as 0.3% and 0.5% RSD, respectively. Mean recovery is reported as 99.44%, and mean assay as 99.68%. Linearity is summarized as R² = 0.999, although the full calibration dataset should be supplied. The stress table reports degradation from 0.83% to 4.55%. These summaries alone do not establish selectivity or stability-indicating capability; the chromatograms and peak-purity/separation evidence should be discussed and supplied.
SUMMARY OF REPORTED VALIDATION RESULTS
|
Parameters |
lerodalcibep |
Limit |
|
|
Linearity Range (µg/ml) |
25-150 µg/ml |
R< 1 |
|
|
Regression coefficient |
0.999 |
||
|
Slope(m) |
6733.8 |
||
|
Intercept(c) |
961.27 |
||
|
Regression equation (Y=mx + c) |
y = 6733.8x + 961.27 |
||
|
Assay (% mean assay) |
99.68%. |
90-110% |
|
|
Specificity |
Specific |
No interference of any peak |
|
|
System precision %RSD |
0.3 |
NMT 2.0% |
|
|
Method precision %RSD |
0.2 |
NMT 2.0% |
|
|
Accuracy %recovery |
99.44% |
98-102% |
|
|
LOD |
0.08 |
NMT 3 |
|
|
LOQ |
0.24 |
NMT 10 |
|
|
Robustness |
FM |
0.1 |
%RSD NMT 2.0 |
|
FP |
0.2 |
||
|
MM |
0.4 |
||
|
MP |
0.3 |
||
|
TM |
0.9 |
||
|
TP |
0.4 |
||
CONCLUSION
Chromatographic conditions used are stationary phase Kromosil c18 250 x 4.6 mm, 5m. Mobile phase 0.1% Trifluoroacetic acid buffer: Acetonitrile in the ratio of 60:40and flow rate was maintained at 1ml/min, detection wave length was 270nm, column temperature was set to Conditions were finalized as optimized method. System suitability parameters were studied by injecting the standard five times and results were well under the acceptance criteria. Linearity study was carried out between 25% to150 % levels, R2 value was found to be as 0.999. Precision was found to be 0.2 for repeatability and 0.5 for intermediate precision. LOD and LOQ are 0.08µg/ml and 0.24µg/ml respectively. By using above method assay of marketed formulation was carried out 99.68% was present.
ACKNOWLEDGEMENT
I express my sincere gratitude to my research guide, Dr. S. Shobha Rani, for her valuable guidance, encouragement, and support throughout my research work.I thank the Head of the Department and all faculty members of the Department of Pharmaceutical Analysis, Centre for Pharmaceutical Sciences, UCESTH, JNTUH, for their support and facilities.
REFERENCES


Mudavath Shobha, Dr. S. Shobha Rani, Stability-Indicating RP-HPLC Method Development and Validation for the Determination of Lerodalcibep in Bulk Drug and Pharmaceutical Dosage Form, Int. J. of Pharm. Sci., 2026, Vol 4, Issue 10, 1235-1246. https://doi.org/10.5281/zenodo.23239992
 10.5281/zenodo.23239992