

We use cookies to ensure our website works properly and to personalise your experience. Cookies policy
Siddhi’s Institute of Pharmacy, Nandgaon, Murbad, Thane-421201, Maharashtra, India.
Millions of people worldwide suffer from diabetes mellitus, a chronic metabolic disease that is mainly treated by anti-diabetic drugs. Therefore, the accurate identification of these medications in pharmaceutical preparations and biological samples is essential. These analytical techniques are required to ascertain the efficacy of treatment, evaluation of drug interactions and pharmacokinetic parameters. In addition, they are essential for ensuring the quality of anti-diabetic drugs during production and after Market release. The process of optimization of analytical methods for anti-diabetic medications is intricate and requires the creation and approval of numerous parameters, including calibration and validation of analytical procedures, assessment of sensitivity and selectivity, and evaluation of accuracy and precision. Different analytical procedures like High-performance Liquid Chromatography (HPLC), Gas Chromatography (GC), and Mass Spectroscopy (MS), have been used to determine anti-diabetic drugs. Furthermore, the use of various chromatographic techniques with mass spectroscopy has improved pharmaceutical analysis's sensitivity and selectivity. The Analytical techniques for identifying anti-diabetic medications are essential to the precision and dependability of the. In general, the production and confirmation of analytical methods for identifying antidiabetic medications are crucial for the appropriate administration of diabetes mellitus.
The pharmaceutical industry relies heavily on analytical chemistry. In the field of pharmaceuticals, various analytical techniques have been utilized for a considerable time. The analytical methods frequently employed in High Performance Liquid, UV-visible spectroscopy, Thin Layer Chromatography, and infrared spectroscopy are all used in the pharmaceutical industry, among others.
Nowadays these analytical techniques have evolved, yielding more precise results in a shorter timeframe. HPTLC (High Performance Thin Layer Chromatography) is a vital instrument for drug analysis, utilizing advanced methodologies. HPTLC offers rapid separation and is also time-efficient. HPLC (High Performance Liquid chromatography) represents an enhanced from of liquid chromatography. It is the most popular technique for separating complex molecular mixtures analytical tool. HPLC is used to quantify various anti-diabetic medications in the pharmaceutical field.[1]
Forecasts indicate that the global population of individuals with diabetes could reach 500 million by 2030 and rise to 700 million by 2045. Type 2 diabetes mellitus is characterized by two primary factors: cell resistance to insulin and the impaired function of pancreatic insulin securing cells, known as Beta cells. Diabetes-related deaths represent over 80% of all facilities in nations with low or middle income Eating a healthy diet, taking part in maintaining a healthy weight, exercising frequently, and quitting smoking are crucial strategies to stop or postpone the onset of diabetes type 2. While type 1 diabetes necessitates insulin treatment, type 2 diabetes can frequently be managed with oral drugs and may also require the use of insulin. The approach for managing diabetes involves keeping blood sugar levels as close to normal as possible, which has demonstrated a reduction in the likelihood of serious complications tied to both types of diabetes.[2]
Type 1 diabetes: Type 1 diabetes which is characterized by the body’s inability to produce insulin. This is because the pancreatic cells that secrete insulin are attacked and killed by the immune system. Young people and children adults are usually impacted by this type of diabetes. Individuals with diabetes are required to receive daily insulin injections.
Type 2 diabetes: A person with type 2 diabetes cannot effectively use insulin to transfer glucose. This kind of diabetes typically affects middle-aged and older adult. Gestational diabetes is the most prevalent types of diabetes in human and is typically found in pregnant women. After the baby is born, this kind of diabetes usually disappears.[3]
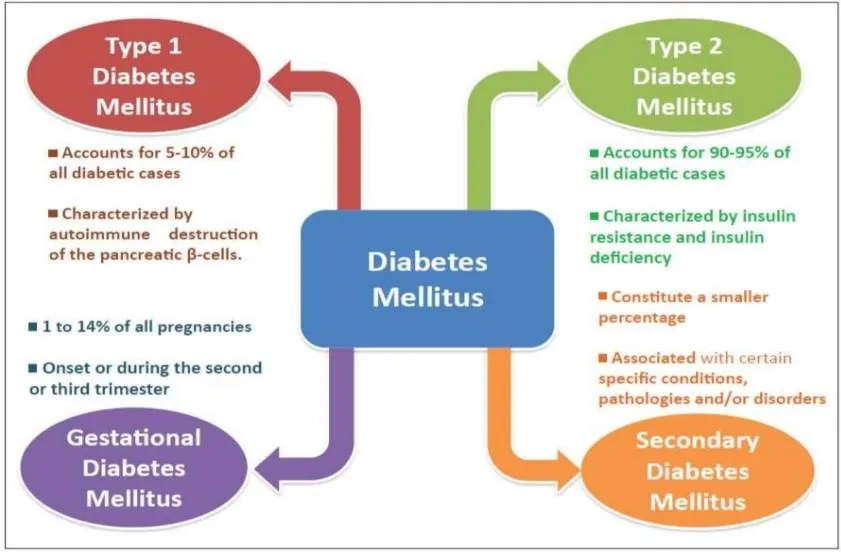
Figure 1: Diabetes Mellitus Types
2. To find anti-diabetic medications, analytical techniques are crucial:
Accurate analytical methods are essential for the identification, quantification, purity assessment, impurity identification, stability assessment, and quality assurance of anti-diabetic medications in pharmaceutical dosage forms. Considering that anti-diabetic drugs must contain the right amount of active pharmaceutical ingredient (API) and remain within established quality specifications throughout their shelf life, reliable analytical procedures are necessary for development, production, release testing, and stability research. ICH Q2 (R2) specifically recognizes analytical procedures for assay, potency, purity, impurity testing, identification, and other quantitative or qualitative measurements, and stipulates that analytical techniques must be proven appropriate for their intended purpose.
2.1) Assay
Assay determines the amount or concentration of the active anti-diabetic drug present in a pharmaceutical dosage form. Accurate assay is important to ensure that tablets, capsules, or other dosage forms contain the drug within the specified strength. ICH Q6A recommends a specific, stability-indicating assay for determining the content or strength of pharmaceutical products and substances.
2.2) Identification
Identification testing confirms that the pharmaceutical product contains the intended antidiabetic drug. It is particularly important to distinguish the drug from closely related compounds, excipients, degradation products, or other substances. According to ICH Q6A, identification tests should be sufficiently specific for the drug substances; techniques such as infrared spectroscopy and appropriately selective chromatographic procedures can be used.
2.3) Purity
Purity testing is performed to determine whether the anti-diabetic drug or pharmaceutical dosage form is free form unacceptable levels of unwanted substances. ICH Q2 (R2) emphasizes specificity/selectivity for analytical procedures used for assay and purity-related measurements.
2.4) Impurity Determination
Raw materials, production procedures, deterioration, storage, or interactions with formulation components. According to ICH Q2 (R2), analytical techniques should be able to discriminating impurities from the analyte and other components of the sample matrix.
2.5) Stability Testing
To ascertain whether an anti-diabetic medication is still of the necessary quality, analytical techniques are crucial requirements while being stored. It is advised by ICH Q1A (R2) to employ verified stability-indicating analytical procedures for stability studies. Stress testing involving conditions such as heat. Humidity, oxidation, photolysis, and hydrolysis can reveal the stability-indicating potential of degradation pathways analytical procedures.
2.6) Quality Control
Analytical methods form an essential part of pharmaceutical quality control. They are used to confirm the identity, strength, purity, and quality of anti-diabetic pharmaceutical products before release and during stability monitoring. According to ICH Q2 (R2), the goal of analytical procedure validation is to show that a procedure is
suitable for its intended use and relates to techniques for stability testing and drug substance release products.[4][5][6]
3. Classification of Anti-diabetic drugs
Table 1: Classification of Anti-diabetic Drugs
| Class of anti-diabetic medication | Drugs | Mechanism of Action |
|---|---|---|
| Insulins | Regular insulin, insulin lispro, glargine | Activate insulin receptors – increase glucose uptake and reduce blood glucose |
| Sulfonylureas | Glimepiride, Glipizide |
Close pancreatic K+ channels – increase insulin secretion |
| Meglitinides | Repaglinide, Nateglinide | Rapidly stimulate insulin release by closing KATP channels |
| Biguanide | Metformin | Mainly decreases hepatic glucose production and improve insulin sensitivity |
| Thiazolidinediones | Pioglitazone | Activate PPAR – improve insulin sensitivity |
| Alpha-Glucosidase inhibitor | Acarbose, Voglibose | Slow carbohydrate breakdown – delay intestinal glucose absorption |
| DPP-4 inhibitors | Sitagliptin, Linagliptin |
Prevent incretin degradation – increase glucose dependent insulin and decrease glucagon |
| SGLT2 inhibitors | Dapagliflozin, Empagliflozin | Reduce renal glucose reabsorption – increase glucose excretion in urine |
4. Analytical Techniques
To evaluate the purity or properties of chemical substances, a variety of analytical techniques are used, including Ultraviolet spectroscopy and Infrared spectroscopy. Chromatography is a method used to analyse mixtures of compounds by segregating them. There are various chromatographic methods, such as High-Pressure Liquid Chromatography, High-Pressure Thin Layer Chromatography, and Liquid Chromatography-Mass Spectrometry.
4.1. UV- Visible spectroscopy
UV-Visible spectroscopy involves the relationship between electromagnetic radiation and organic compounds.[7] In this technique, the incident electromagnetic radiation may be absorbed, emitted, or scattered by the sample.[8] The foundation of UV-visible spectroscopy is the way electromagnetic radiation interacts with molecules. When a substance absorbs UV or visible light, its electrons can move from a lower-energy ground state to a higher-energy excited state. Therefore, UV spectroscopy is associated with electronic transitions within atoms or molecules. In UV–Visible spectroscopy, radiation is absorbed by a chemical compound, causing electrons present in bonding or non-bonding orbitals to move to higher-energy antibonding orbitals.
The fundamental principle of UV–Visible spectroscopy is described by the Beer–Lambert law. In light of this law, a solution's ability to absorb monochromatic light is directly correlated with the concentration of the absorbing substance and the path length through which the radiation passes. The major components of a UV–Visible spectrophotometer include a radiation source, filter, monochromator, sample cell or chamber, detector, and recorder/display system.
Applications of UV–Visible Spectroscopy
The foundation of UV-visible spectroscopy is the way electromagnetic radiation interacts with molecules:
i. Identifying the functional groups that chemical compounds contain.
ii. Determination of the degree of conjugation within a molecule.
iii. Differentiation between conjugated and non-conjugated compounds.
iv. Identification of unknown substances by comparing their absorption spectra.
v. Analysis of polynuclear aromatic hydrocarbons.
vi. Study of the structures of vitamins, particularly vitamins A and K.
Analysis of Glimepiride by UV-Visible Spectroscopy
When glimepiride-containing solutions are exposed to UV light, the medication absorbs light at a particular wavelength. The Beer-Lambert law states that the absorbance generated is correlated with the drug's concentration. Thus, the concentration of glimepiride can be determined by measuring its absorbance at the selected wavelength.
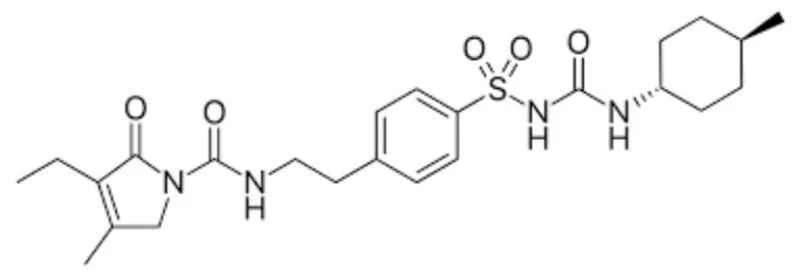
Figure 2: Glimepiride
General procedure:
i. A suitable solvent, like methanol, is used to create a standard stock solution of glimepiride.
ii. Different concentrations are obtained by suitably diluting the stock solution.
iii. The solution is scanned within the suitable UV wavelength range to identify the wavelength of maximum absorption (λmax).
iv. Absorbance values of the standard solutions are recorded at the selected λmax.
v. A calibration plot is prepared by plotting absorbance against concentration.
vi. The pharmaceutical dosage form is accurately weighed and treated with a suitable solvent to obtain the sample solution.
vii. The sample's absorbance is measured at the chosen wavelength.
viii. The glimepiride concentration or amount in the sample is determined using the calibration curve.[9][10]
Spectral characteristics
i. Beer-Lamber's Law states that glimepiride is linear across a range of concentrations (usually 5–30 µg/mL or 2-20 µg/mL depending on the solvent).[11]
ii. Derivative Spectroscopy: When analyzing glimepiride in a complex tablet matrix or multi-drug formulation, first- and second-order derivative spectra (such as N=2 settings) are frequently employed to eliminate excipient interference.[12]
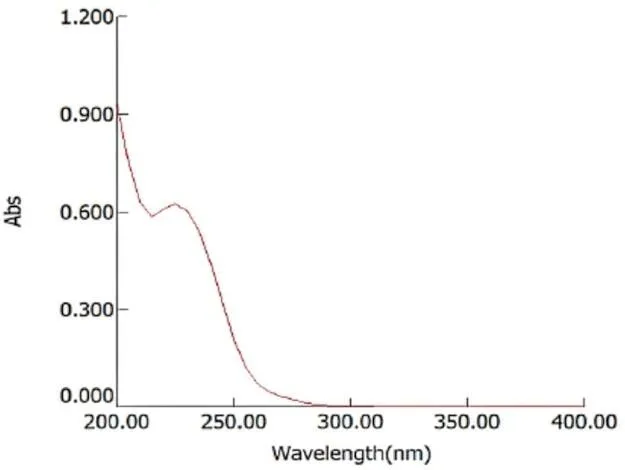
Figure 3: UV-spectra of Glimepiride
Wavelength Ranges
Ultraviolet (UV) Region: 190 nm to 400 nm (used for transitions in double bonds, conjugated systems, and aromatic rings).
Visible (Vis) Region: 400 nm to 800 nm (used for coloured compounds and transition metal complexes).
Overall Range: 190 nm to 800 nm (sometimes extended up to 900 nm) for standard UV-Vis spectrophotometers.
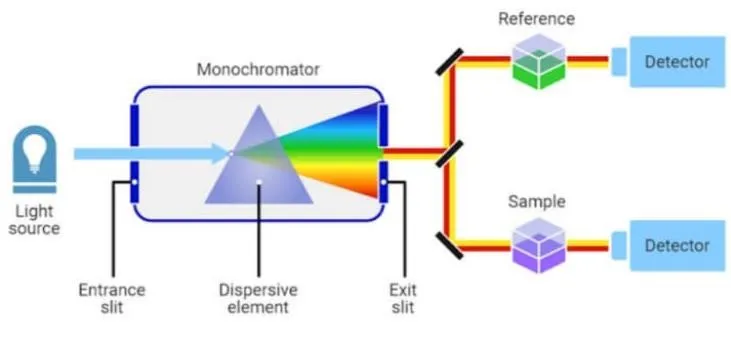
Figure 4: UV Visible Spectroscopy
4.2. HPLC (High-Performance Liquid Chromatography)
One widely used chromatographic technique for the quantitative measurement, identification, and separation of pharmaceutical substances is High-Performance Liquid Chromatography (HPLC). For assay, purity testing, impurity identification, stability research, and drug product quality control, it is very crucial in pharmaceutical analysis.[13]
Principle
The different distribution of analyte components between a stationary phase and a mobile phase serves as the basis of the HPLC principle. After being added to a flowing mobile phase, the sample is moved via a stationary phase-containing column. Because of their differing degrees, different components flow through the column at different rates of communication with the stationary phase. This results in the distinct components being separated. Pharmaceutical analysis frequently uses reversed-phase HPLC (RP-HPLC), in which the mobile phase is comparatively polar and the stationary phase is non-polar, such as C18-bonded silica. Compounds are categorized based on how differently they interact with these phases.[14]
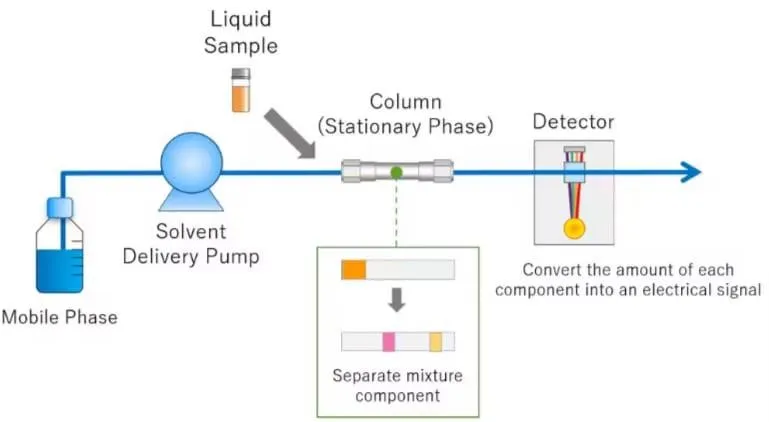
Figure 5: High Performance Liquid Chromatography
Instrumentation of HPLC
A. Mobile-phase reservoir: The mobile phase is kept in one or more solvent reservoirs. To reduce particulate contamination and gas bubbles that could disrupt the chromatographic system, the solvents are typically filtered and degassed before to use.
B. Pump: The pump delivers the mobile phase through the column at a controlled and steady flow rate. Because variations in flow rate or mobile-phase composition might impact retention time and separation, precise solvent delivery is crucial.[14]
C. Injector/Autosampler: The prepared sample is injected in a predefined volume into the flowing mobile phase via the injector. Autosamplers, which enable precise and automated injection of numerous samples, are frequently used in contemporary systems.
D. Column: The HPLC system's primary separating element is the column. It has the stationary phase that separates the compounds. Particle properties, stationary-phase chemistry, and column diameters vary. C18 reversed-phase columns are widely used in pharmaceutical analysis.
E. Detector: As molecules elute from the column, the detector picks them up and transforms their reaction into an electrical signal. UV/visible, photodiode array (PDA), fluorescence, refractive index, electrochemical, and mass spectrometric detectors are examples of common HPLC detectors. ScienceDirect Since many anti-diabetic medications may have appropriate UV-absorbing properties, UV or PDA detection is helpful.
F. Data acquisition and processing system: System for acquiring and processing data.
A computer or chromatographic data system receives the detector signal.[15]
Application in analysis of anti-diabetic drugs
i. Utilization in the evaluation of anti-diabetic medications because HPLC can accurately and selectively determine anti-diabetic medications in pharmaceutical dose forms, it is especially helpful for your review topic.
ii. It can be used for stability-indicating analysis, determining contaminants, assaying individual pharmaceuticals, and simultaneously estimating several medications.
iii. These factors make HPLC a common tool in quality control and pharmaceutical development.[13]
Sample preparation for HPLC Analysis
Aims to convert a sample into its optimal state to achieve precise analytical results. To ensure proper chromatography, the sample must fully dissolve in and be compatible with the mobile phase while remaining suitable for the chosen column without altering the sample's retention time. When dealing with insoluble materials, techniques like filtration, centrifugation, and sonication are standardly applied. Additionally, selecting high-efficiency syringe filters is essential to effectively eliminate interferences and contaminants prior to injection.
HPLC Conditions for Glimepiride
i. Stationary Phase (Column): C18 reverse-phase column (like LiChrosorb RP-18 or Phenomenex Luna C18, 250 × 4.6 mm, 5 μm).
ii. Mobile Phase: Acetonitrile and an aqueous buffer (such as phosphate buffer, acetate buffer, or diluted formic acid/glacial acetic acid) are combined.
iii. Detection Wavelength: Depending on the intended retention time, a typical ratio is between 40:60 and 80:20 (v/v). 228 nm or 230 nm.
iv. Flow Rate: 1.0 mL/min on average
v. Retention Time: Depending on whether an isocratic or gradient elution profile is used, it typically shows up cleanly within early to mid run times.[35]
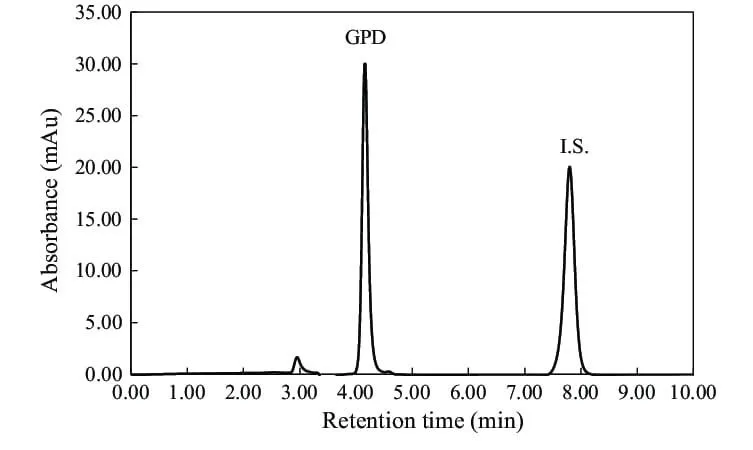
Figure 6: HPLC Chromatogram for Glimepiride
Advantages of High Performance Liquid Chromatography
i. Enhanced Efficiency & Speed: Reversed-phase HPLC enables rapid analysis—such as evaluating paeoniflorin from Paeonia 'Singing in the Rain'—by significantly reducing run times. UPLC further accelerates drug discovery through high-throughput screening while delivering rapid, precise, and reproducible results across both isocratic and gradient analyses.
ii. Higher Sensitivity & Quality: Advanced chromatographic techniques provide superior selectivity, increased sensitivity, a broader dynamic range, and exceptional quantitative accuracy for analysing drugs, related substances, and complex natural or traditional herbal remedies.
iii. Cost & Solvent Reductions: UPLC technology lowers overall operational costs by drastically decreasing mobile phase solvent consumption.[16][17]
4.3. LC-MS (Liquid Chromatography-Mass Spectroscopy)
Principle
The combined analytical method known as liquid chromatography–mass spectrometry (LC–MS) uses liquid the components of a sample are separated using chromatography and then detected using mass spectrometry and recognition. Analytes are split between the stationary phase and mobile phase during LC separation causing them to be separated according to their physicochemical characteristics. The analytes that have been separated are then moved to the mass spectrometer, where they are separated based on their mass and transformed into ions ratio of charge (m/z). Detection of these ions produces characteristic mass spectra that provide useful information about the molecular mass and identity of the analyte, while chromatographic peak responses can be used for quantitative analysis.
In LC-MS, ionization is typically carried out using methods like electrospray ionization (ESI) and atmospheric-pressure chemical ionization (APCI). ESI is widely employed in pharmaceutical analysis because it is suitable for polar, high-molecular-weight, and thermally sensitive compounds and generally produces limited fragmentation. As a result, LC-MS provides excellent sensitivity and selectivity for the detection and measurement of pharmaceutical drugs, impurities, metabolites, and degradation products.[18][19]
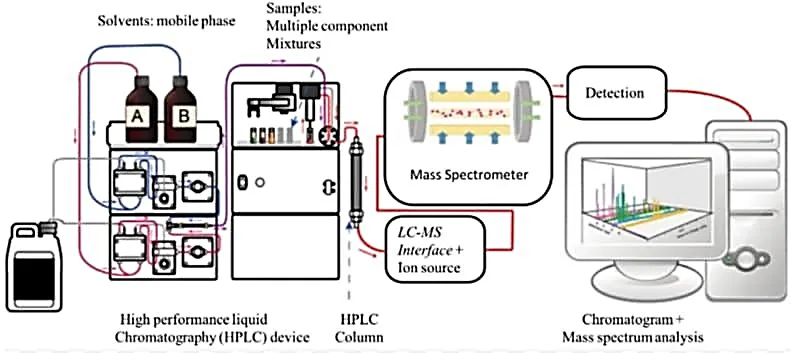
Figure 7: Liquid Chromatography-Mass Spectroscopy Instrumentation of LC-MS
A. Ion source/Ionization source
The sample can be added to the ionization source in mass spectrometry either directly by infusion or via a suitable chromatographic interface. Various ionization techniques are chosen based on the physical and chemical characteristics of the analyte and the required ionization energy. During ionization, neutral molecules may lose or gain electrons to form charged ions, while some techniques produce ions through ion–molecule reactions or adduct formation.
In atmospheric-pressure ionization (API) methods, solvent removal and analyte ionization occur within the ion source under atmospheric-pressure conditions. In contrast, with electron ionization (EI), solvent removal and ion formation occur as separate processes. A particle-beam interface may be used to separate the analyte from the solvent and add the analyte as dry particles to the mass spectrometer. EI is especially helpful for substances that are not readily ionized by API techniques and when a characteristic electron-ionization mass spectrum is required.
Common ionization techniques include electron ionization (EI), chemical ionization (CI), fast atom bombardment (FAB), electrospray ionization (ESI), secondary ion mass spectrometry (SIMS), and matrix-assisted laser desorption/ionization (MALDI). EI and CI are primarily used for gas-phase samples, whereas FAB, SIMS, ESI, and MALDI are suitable for condensed phase samples.
The ionization energy strongly influences the extent of fragmentation produced in the mass spectrum. Soft ionization techniques generally cause little fragmentation and may predominantly produce molecular or quasi-molecular ions, whereas energetic ionization techniques can produce extensive fragmentation. Although fragmentation can make the spectrum more complex, the resulting fragment ions provide valuable structural information, which is useful for identifying unknown compounds and confirming the identity of analytes.
B. Mass Analyzer
One essential part of a mass spectrometer is the mass analyzer (m/z analyzer), which divides ions based on their mass-to-charge ratio (m/z) by making use of their distinctive motion in magnetic and/or electric fields. Advances in ionization techniques, particularly those capable of generating ions from biomolecules, have increased the need for mass analyzers with improved speed, accuracy, and resolution.
Instead of measuring the mass of ions in the gas phase, a mass analyzer uses their m/z value directly. The charge on an analyte is produced through the addition or removal of protons, cations, anions, or electrons. Once the molecule becomes charged, it can interact with electric or magnetic fields, allowing its m/z value to be determined.
A mass analyzer's performance is typically assessed using a number of crucial factors, including mass accuracy, resolving power, mass range, tandem mass spectrometry capabilities, and scanning speed. These features establish whether a specific mass analyzer is appropriate for both qualitative and quantitative analysis of pharmaceutical compounds and biomolecules.[20]
Table 2: Types of Analyzer
| Sr. No. | Types of Analyzer | Basis of separation |
|---|---|---|
| 1. | Electric sector | Kinetic energy |
| 2. | Magnetic sector | Momentum |
| 3. | Quadrople/Ion trap | m/z |
| 4. | Time of flight | Flight time |
| 5. | FT-ion cyclotron resonance | m/z (resonance activities) |
Applications
i. LC-MS is used in pharmacokinetics to investigate drug absorption, metabolism, and excretion. Bio Drugs and their metabolites are quantitatively and structurally elucidated using analytical techniques in the biological samples, such as serum, urine, saliva, and plasma.[21]
ii. Comparative bioequivalency studies where quantitative Pharmacodynamics, clinical trials, and biological matrix measurements are used to determine drugs or metabolites and tests for in vitro dissolution.[22][23]
iii. When calculating molecular weights: LC-MS is used to calculate the molecular weights of known and unidentified substances. It offers details on molecular weight, structure, and identification number of components in the sample. The molecular masses of proteins and nucleic acids are determined using LCMS peptides, polymers, and acids.
iv. The pharmaceutical industry uses LC-MS to determine drug and intermediate assays for assessment of drug substances, drug products, intermediates, and related compounds.
v. It is utilized in the agrochemical and pesticide industries to identify the various components found in the pesticides and fertilizers.
The three most popular ionization techniques in LC-MS
a. Electrospray Ionization (ESI) – Ionization in the condensed phase [24,25]
b. Atmospheric Pressure Chemical Ionization (APCI) – Ionization in the gas phase [26,27]
c. Matrix-assisted Laser Ionization (MALDI)
Several antidiabetic agents have been analyzed using liquid chromatography–mass spectrometry (LC–MS), including vildagliptin, alogliptin benzoate, sitagliptin, linagliptin, glibenclamide, pioglitazone hydrochloride, mitiglinide calcium hydrate, and glimepiride [28]
Sample Preparation for LC-MS
For pharmaceutical and bioanalytical samples, the preparation procedure generally involves sample collection, dilution or dissolution, extraction, filtration/centrifugation, and transfer of the clear extract into an LC–MS vial. Protein extraction techniques are frequently employed, depending on the drug's and matrix's characteristics solid-phase extraction (SPE), liquid-liquid extraction (LLE), and precipitation (PPT).[33]
A. Protein precipitation is an easy and quick technique that works well with plasma and serum samples. Proteins are precipitated by adding an organic solvent, such as acetonitrile or methanol, and then mixing and centrifugation. The clear supernatant containing the analyte is then separated and, when required, diluted or concentrated before injection.
B. Liquid–liquid extraction involves transferring the analyte from an aqueous sample into an immiscible organic solvent. After mixing and phase separation, the organic layer containing the drug is collected and may be evaporated and reconstituted in a suitable mobile phase. This approach can provide effective removal of many matrix components.[34]
C. Solid-phase extraction uses a sorbent material to selectively retain the analyte while unwanted matrix components are removed by washing. The retained drug is subsequently eluted using an appropriate solvent. SPE generally provides cleaner extracts and can improve sensitivity by reducing matrix-related interference, although it may require more time and optimization than protein precipitation.
Solid-phase extraction uses a sorbent material to selectively retain the analyte while unwanted matrix components are removed by washing. The retained drug is subsequently eluted using an appropriate solvent. SPE generally provides cleaner extracts and can improve sensitivity by reducing matrix-related interference, although it may require more time and optimization than protein precipitation.[33]
The mass spectrum of Glimepiride by LC-MS in positive electrospray ionization
i. Precursor ion: m/z 491.20 [M+H]+ of glimepiride.
ii. Product / fragment ion: m/z 351.80
iii. The spectrum is fragmentation of protonated glimepiride from m/z 491.20 to m/z 351.80.
Figure: Chemical Structure of Glimepiride Is Shown in the Middle.
v. X-axis - m/z (mass/charge ratio) vi. Y-axis: relative abundance / intensity.[36]
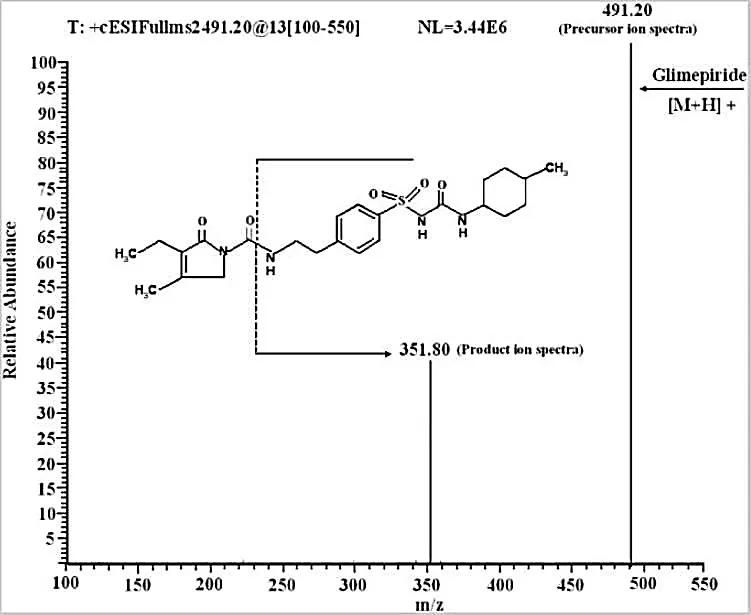
Figure 8: Glimepiride's Lc-Esi-Ms/ms Spectrum Displays the Major Product Ion at M/Z 351.80 and the Precursor Ion at M/Z 491.20 ([M+H]⁺).
Advantages of LC-MS
The highly effective analytical method known as liquid chromatography–mass spectrometry (LC–MS) combines the liquid chromatography's capacity for separation and mass spectrometry's sensitive detection capabilities. The among the main benefits of LC-MS in pharmaceutical analysis are:
i. High sensitivity: LC–MS can detect very small quantities of drugs, making it useful for the determination of compounds present at trace levels.[29]
ii. Outstanding selectivity: Specific identification is made possible by detection based on the mass-to-charge ratio (m/z) of analytes and reduces other substances' interference.
iii. Complex matrix analysis: This method can be used to identify medications, metabolites, contaminants, and degradation products in complicated pharmaceutical and biological samples.[31]
iv. Appropriate for thermolabile compounds: LC-MS is especially helpful for non-volatile compounds, highly polar, have high molecular weight, or are sensitive to heat, as they can be analyzed without conversion into volatile derivatives.[32]
v. Qualitative and quantitative capabilities: LC–MS provides information for both identification and measurement of pharmaceutical compounds, making it useful for comprehensive drug analysis.
vi. Rapid and efficient analysis: LC–MS/MS methods can provide fast and reliable analysis and are suitable for processing a large number of samples.[29][30]
vii. Simultaneous determination of multiple drugs: Several analytes can be detected and quantified in a single analytical run based on their characteristic molecular ions or fragment ions.
viii. Provides structural information: The molecular and fragment ion patterns obtained by mass spectrometry can assist in the identification and structural characterization of drugs, metabolites, impurities, and degradation products.
ix. Broad pharmaceutical applications: LC–MS is widely applied in drug discovery, formulation development, impurity profiling, stability studies, pharmacokinetic investigations, drug metabolism studies, and pharmaceutical quality control.
4.4. GC (Gas Chromatography)
Principle
The separation of substances using a column is the basic concept of gas chromatography. Compounds from a mixture are separated according to how they interact with the polymer stationary phase and the gas mobile phase. A polymer coated inside the column serves as the stationary phase, while a carrier gas like helium, hydrogen, or nitrogen serves as the mobile phase. The way the compound interacts with the stationary phase and vaporizes determines the sample's compounds flow through the column at different rates. Compounds that engage with the stationary stage more frequently travel through the column more slowly than those that interact with it less frequently. Compounds separate as a result of this time difference.[37]
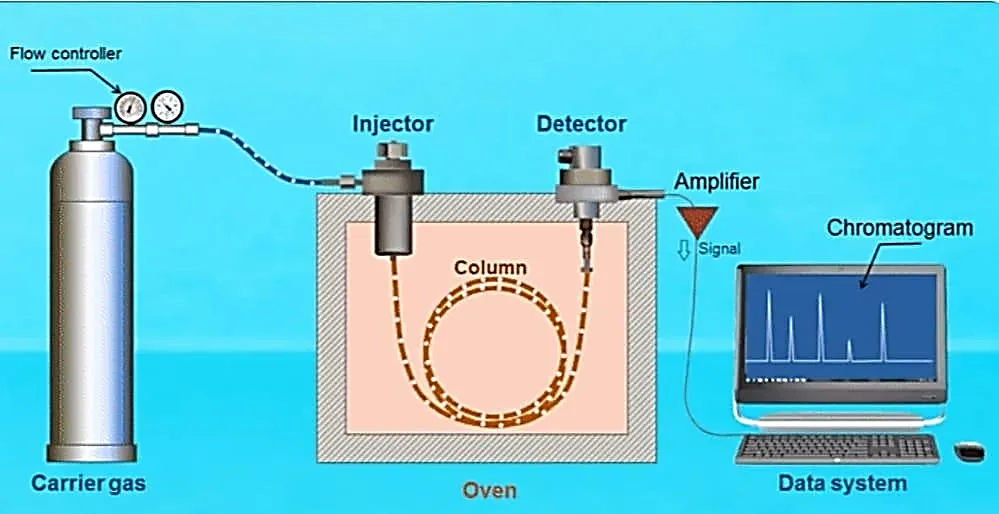
Figure 9: Gas Chromatography
Instrumentation of Gas Chromatography
The major components of a gas chromatography are:
A. Carrier gas system: Provides an inert gas to move the sample through the column, such as hydrogen, nitrogen, or helium.
B. Injector: Adds the sample to the carrier-gas stream and quickly vaporizes it.
C. Column: Holds the stationary phase and is in charge of separating the sample's constituent parts. Capillary columns are frequently employed.
D. Oven: Maintains a controlled temperature in the column. It can function in temperature programmed or isothermal environments.
E. Detector: As the separated compounds exit the column, the detector picks them up. FID, TCD, ECD, and MS are examples of common detectors.
F. Data system/recorder: Provides information like peak area and retention time by converting detector signals into a chromatogram.[37]
Applications of Gas Chromatography
i. Pharmaceutical Analysis: GC detects volatile drug compounds, contaminants, and leftover solvents. It facilitates regulatory compliance, stability testing, and quality control.
ii. Environmental Monitoring: GC helps protect the environment and comply with regulations by identifying industrial pollutants, pesticides, and volatile organic compounds (VOCs) in the air, water, and soil.
iii. Food and Beverage Analysis: GC is used in beverages, spices, oils, and processed foods for quality control, flavour profiling, aroma analysis, and contamination detection.
iv. Petrochemical Industry: GC helps with refining, quality evaluation, and process optimization by analyzing hydrocarbon composition, gas purity, and petroleum products.
v. Forensic Science: GC supports criminal investigations and court cases by identifying drugs, toxins, explosives, and volatile compounds in biological and environmental samples.
vi. Clinical and Biomedical Research: GC helps with metabolic studies and diagnostics by measuring metabolites, fatty acids, and volatile biomarkers in biological fluids.[38]
GC (Gas Chromatography) Sample Preparation
A. Sample collection: The pharmaceutical sample or test material is collected in an appropriate container and protected from contamination.
B. Weighing: A suitable quantity of sample is precisely weighed.
C. Extraction/dissolution: When necessary, the sample is dissolved or extracted with an appropriate volatile organic solvent.
D. Filtration: The extract is filtered to remove insoluble particles that could contaminate the injector or the column.
E. Concentration: The extract can be concentrated using an appropriate method if the analyte's concentration is low method.
F. Derivatization: Derivatization: Chemical derivatization can be applied to improve the thermal stability and volatility of alcohols, carboxylic acids, and amines are examples of highly polar or low volatility compounds.
G. Headspace sampling: To check for volatile substances or leftover solvents, the sample can be sealed in a vial and equilibrated. Next, the GC is filled with the vapor above the sample. As a result, fewer non-volatile matrix components are introduced.[39]
H. SPME: Analytes are extracted from the sample or headspace onto a coated fiber using the SPME technique, which is subsequently thermally desorbed in the GC injector. The use of organic solvents can be decreased or eliminated as a result.[40]
I. Injection: Under the chosen chromatographic conditions, the prepared sample is moved to an appropriate GC vial and injected.
GC-MS spectrum of glimepiride
After proper derivatization, glimepiride can be identified and determined by gas chromatography or be recognized and ascertained using gas chromatography or gas chromatography and mass spectrometry together. Glimepiride is characterized by low volatility and needs to be derivatized for better compatibility for GC analysis. Derivatization of glimepiride: GC-MS method using N-methyl-N-(trimethylsilyl)trifluoroacetamide (MSTFA). The optimized reaction was performed at 80 °C for 1 h. The characteristic mass spectral ion of the trimethylsilyl derivative was seen at m/z 256, and glimepiride was eluted at approximately 3.98 min. The method showed linearity over the range 500–2500 ng/mL with a correlation coefficient (R2) of 0.9924, indicating that it can be used to detect glimepiride in biological samples.[41]
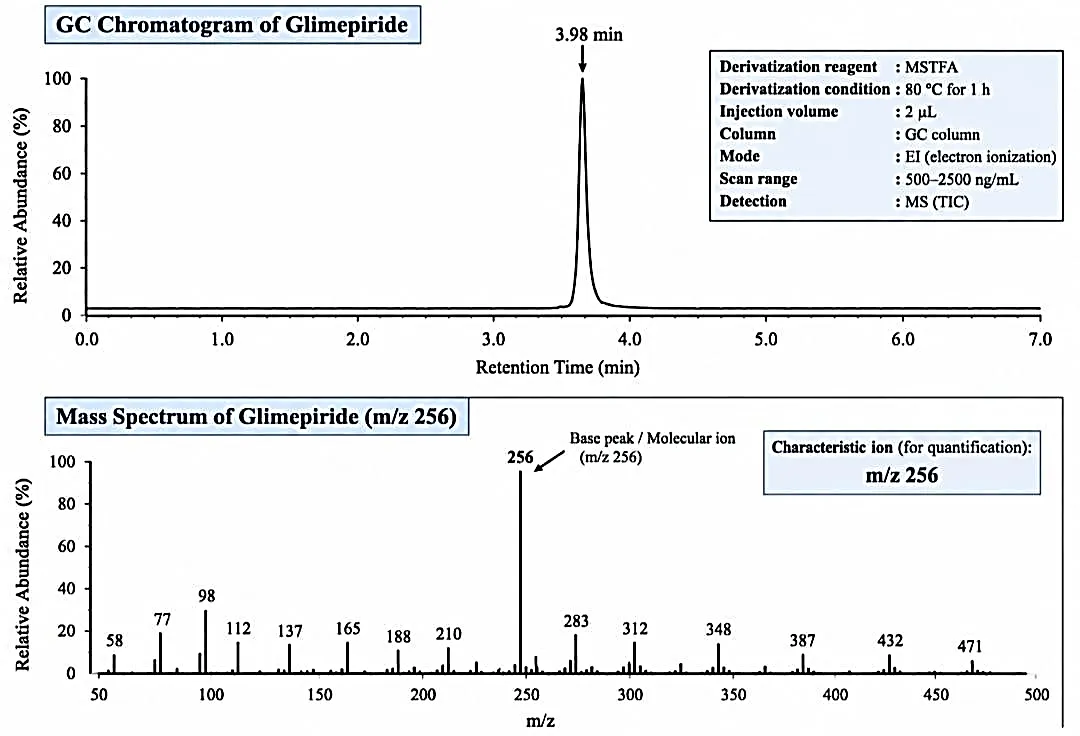
Figure 10: GC-MS Chromatogram and Mass Spectrum of Glimepiride After Derivatization with MSTFA. Retention Time (R1) =3.98 min; Characteristics Ion (M/Z) = 256.
Advantages of GC-MS Chromatography
i. Qualitative and quantitative GC analysis of complex mixtures requires fulfilment of several conditions:
ii. Sufficient resolution as indicated by symmetric peaks with no tailing,
iii. Good reproducibility and repeatability of retention times,
iv. Sufficient accuracy and precision in quantitation based on peak areas, in other words, independence of measurements from sample composition in terms of temperature, composition, and concentration,
v. Minimum thermal and catalytic destruction of sensitive components of the sample.
vi. The utilization of fused-silica capillary columns with better characteristics with respect to surface inertness, thermal stability, and resolution helps accomplish most of these tasks.
vii. In capillary GC the resolution is expressed through its parameters like column efficiency, separation factor, and retention factors.[42]
5. The following parameters which could be examined when validating methods:
a. Precision
b. Accuracy
c. Range and Linearity
d. Limit of detection
e. The limit of quantitation
f. Particularity
g. Sturdiness
h. System suitability determination
i. Stability studies
CONCLUSION
Antidiabetic medication quality assurance in pharmaceuticals still primarily depends on the creation and verification of analytical methods. Antidiabetic drugs in pharmaceutical formulations, bulk materials, and biological matrices have been successfully determined both qualitatively and quantitatively using a variety of analytical methods like RP-HPLC, UPLC-MS/MS, LC-MS/MS, and UV-visible spectroscopy. According to the evidence that is currently available, these techniques meet regulatory requirements for robustness, accuracy, precision, and sensitivity. The most well-documented analytical method development and validation was for glimepiride studies among the antidiabetic medications examined. Its clinical significance, low-dose formulation requirements, as well as the analytical complexity associated with its limited solubility in water, could be the causes of this substantial research activity. In order to aid in the creation of formulations, quality assurance, stability evaluation, and bioanalytical studies, there is a constant need for sensitive and dependable analytical procedures, which is demonstrated by the abundance of methods that have been published. To increase analytical efficiency and regulatory compliance, future research should concentrate on advanced chromatographic techniques, automation, artificial intelligence-assisted method optimization, and environmentally sustainable analytical approaches.[43]
REFERENCES


Sneha Jankar, Pratiksha Pandit, Shreya Tondlikar, Snehal Jadhav, Saurabh Patara, Aditi Bangar, Analytical Methods for the Estimation of Anti-diabetic Drug in Dosage Forms for Pharmaceuticals, Int. J. of Pharm. Sci., 2026, Vol 4, Issue 10, 3964-3979. https://doi.org/10.5281/zenodo.23659180
 10.5281/zenodo.23659180