We use cookies to ensure our website works properly and to personalise your experience. Cookies policy
Sri Venkateswara College of Pharmacy (Autonomous), Chittoor, Andhra Pradesh, India
Background: The United States represents one of the most important regulated pharmaceutical markets and has historically been a major destination for Indian pharmaceutical products. India’s position in this market can be assessed not only through product approvals but also through the breadth of active Drug Master Files (DMFs), generic approvals and trade performance. The dissertation underlying this manuscript identified a need for an integrated assessment of these indicators rather than examining them separately. Objective: To assess India’s regulatory strength and competitive position in the U.S. pharmaceutical market using USFDA Type II DMF data, formulation and generic approval data, and pharmaceutical trade statistics; to characterize company-, molecule- and therapeutic-category-level strengths; and to evaluate the association between regulatory registrations and pharmaceutical imports from India. Methods: A retrospective secondary-data analysis was performed using USFDA/CDER Type II active DMF information available on 24 October 2011, product-approval information from Drugs@FDA, the Electronic Orange Book and the National Drug Code Directory available through 28 December 2010, and U.S.–India pharmaceutical trade data for 1990–2010. Harmonized System (HS) codes were reviewed to characterize the pharmaceutical trade basket. Descriptive statistics, percentage shares, compound annual growth rates (CAGR), year-on-year growth, multiple linear regression and scenario analysis were applied. The regression model used cumulative DMFs and cumulative ANDAs as predictors of U.S. pharmaceutical imports from India. Results: India accounted for 2,667 active Type II DMFs, representing 34.85% of the active DMFs examined, and 632 compounds, or 26.71% of the compounds represented in the dataset. India had 340 holder firms (18.39%). DMF filings increased markedly after 2000, reaching 2,387 cumulative filings by 2010. Prescription generic approvals associated with India increased from 64 products in 2000 to 1,533 in 2010. U.S. pharmaceutical imports from India increased from US$4.61 million in 1990 to US$2,495.92 million in 2010. The regression model reported R=0.993883 and R²=0.9878; cumulative ANDAs showed the stronger positive coefficient in the fitted model. Scenario analysis estimated 2015 exports in a range of approximately US$7.45–13.14 billion, with US$9.07 billion as the most-likely estimate under the dissertation’s assumptions. Conclusion: The integrated evidence indicates substantial Indian strength in U.S. bulk-drug and generic-product registration, supported by broad company participation and growth in pharmaceutical trade. However, the pattern also identifies strategic gaps in complex chemistry, biotechnology, specialized formulations and selected therapeutic categories. Future competitiveness depends on maintaining regulatory compliance while moving from commodity generics toward complex, specialty and value-added products.
1.1 Global pharmaceutical market and the role of regulated markets
The pharmaceutical sector has undergone sustained globalization, characterized by expanding generic markets, international manufacturing, strategic alliances, mergers and acquisitions, increasing regulatory requirements and the movement of production and research activities across borders. The dissertation describes the U.S. as the largest pharmaceutical market in the study period and emphasizes the importance of the United States as a destination for pharmaceutical exports and as a benchmark regulated market [1–10].
The importance of regulated markets extends beyond market size. Entry into a highly regulated jurisdiction requires evidence that manufacturing, product quality, bioequivalence, labeling and other requirements are adequately controlled. Consequently, the number and distribution of regulatory submissions can provide an indirect measure of the international readiness of pharmaceutical manufacturers. In the Indian context, the growth of DMFs and generic applications reflects the industry's ability to participate in regulated supply chains [49,50,52,53].
1.2 Generic medicines and regulatory competition
Generic medicines are intended to provide therapeutically equivalent alternatives to innovator products after the relevant intellectual-property and regulatory protections permit entry. Their economic importance arises from lower development costs and competitive pricing, while their regulatory acceptability depends on demonstration of quality and, where applicable, bioequivalence. The literature reviewed in the dissertation identifies generic utilization as a major mechanism for containing pharmaceutical expenditure and increasing access [11–24,57,60].
The U.S. generic market therefore creates a strategic opportunity for countries with large manufacturing capacities. India developed a particularly strong position because of its chemical-processing capabilities, manufacturing infrastructure, relatively lower operating costs and expanding regulatory experience. The dissertation links these capabilities with the increasing number of FDA-inspected facilities and regulatory filings from Indian companies [32,44–50].
1.3 Evolution of India’s pharmaceutical industry
India’s pharmaceutical sector developed through several historical phases. The dissertation describes a pre-independence period, a period of multinational dominance, an intervention period associated with the 1970 patent framework and domestic industrial policy, and a liberalization period. The process-patent regime enabled Indian companies to develop alternative manufacturing processes for products protected elsewhere, supporting the expansion of domestic manufacturing and generic production [33–36].
The subsequent integration of India into the World Trade Organization framework and compliance with TRIPS altered the strategic environment. Indian companies increasingly had to strengthen product-development capabilities, intellectual-property competence and research and development. This transition was important for the later expansion of Indian firms into regulated markets, including the United States [33,35,36].
1.4 India–U.S. pharmaceutical relationship
The dissertation identifies the United States as a major destination for Indian pharmaceutical exports and as a particularly important market for generic medicines. Indian companies have leveraged manufacturing scale, process chemistry, analytical capabilities and regulatory expertise to supply the U.S. market. The United States was also described as having a large number of FDA-inspected facilities outside its domestic territory located in India, reinforcing the country's role in global pharmaceutical manufacturing [44–50].
Trade data presented in the dissertation demonstrate a pronounced increase in U.S. pharmaceutical imports from India during 1990–2010. Total imports of bulk drugs and formulations increased from US$4.61 million in 1990 to US$2,495.92 million in 2010. This expansion occurred alongside a marked increase in cumulative Indian DMFs and ANDA approvals, providing the basis for the integrated analysis performed in this study [49,50].
1.5 U.S. regulatory framework and the USFDA
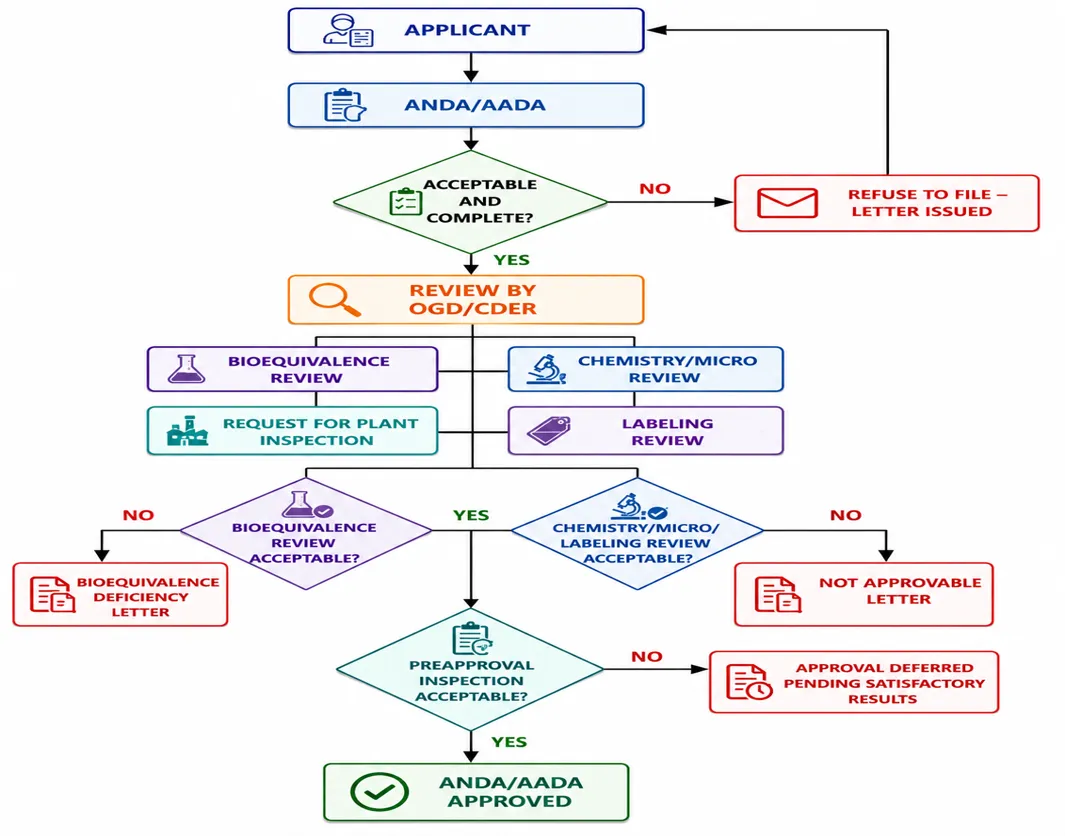
The U.S. Food and Drug Administration (FDA) regulates drugs under the Federal Food, Drug, and Cosmetic Act and related regulations in Title 21 of the Code of Federal Regulations. Within FDA, the Center for Drug Evaluation and Research (CDER) is responsible for human drug products, while the Office of Generic Drugs (OGD) supports the review of generic medicines. The dissertation uses these regulatory structures as the framework for evaluating India's participation in the U.S. drug market [52,53,93–106].
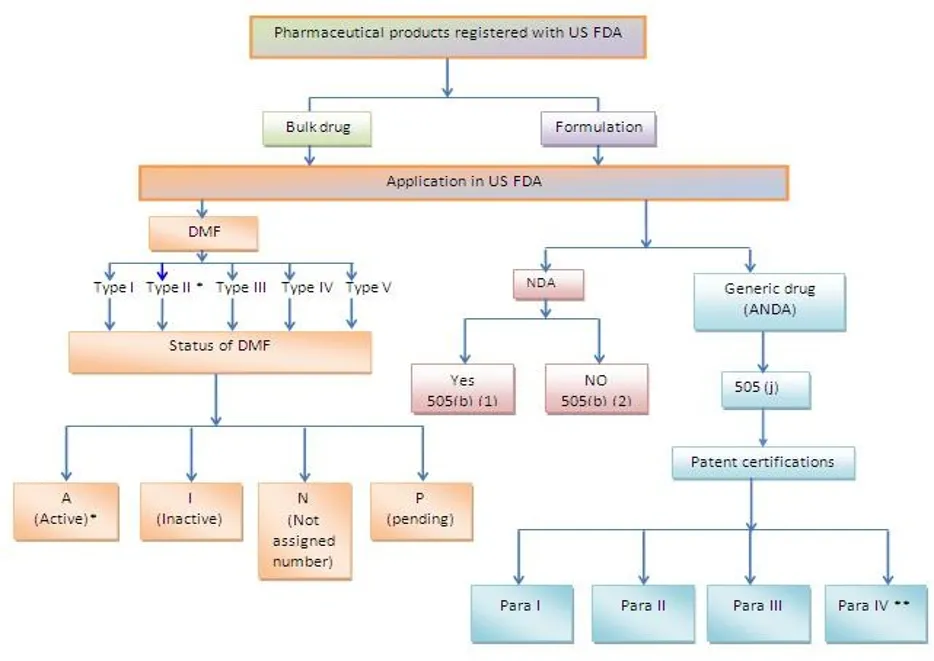
A critical distinction is required between a regulatory submission and an approval. A DMF is a confidential regulatory submission containing information about facilities, processes or articles used in the manufacture, processing or packaging of human drugs. Current FDA information clarifies that a DMF is not itself an application for approval; rather, its contents may be reviewed when referenced by an appropriate application such as an NDA or ANDA [93–99]. This distinction is important when interpreting the dissertation’s use of active DMF counts as an indicator of regulatory participation rather than a direct measure of approved products.
1.6 Drug Master Files and Type II DMFs
Type II DMFs are particularly relevant to pharmaceutical active ingredients and related materials. The dissertation analyzed active Type II DMFs by country, company, compound and therapeutic category. This approach permits assessment of the depth of India's participation in the U.S. API supply chain and provides a complementary measure to finished-product approvals [55,93–99].
1.7 Formulation approvals and ANDAs
An Abbreviated New Drug Application (ANDA) provides the principal pathway for approval of many generic drug products. Generic approval depends on satisfying applicable requirements, including pharmaceutical quality and, where appropriate, bioequivalence. FDA literature emphasizes that bioavailability and bioequivalence are central elements of the generic drug regulatory framework [60–64,107–113].
The dissertation therefore examined ANDAs together with other product categories, including NDAs, NMEs and BLAs, while distinguishing prescription, OTC, discontinued and tentative products. This allowed India’s generic-product contribution to be evaluated in relation to the wider U.S. approval landscape.
1.8 Patent expiry, generic opportunity and market entry
The interaction between patent expiry and generic entry is a major determinant of opportunities in regulated markets. The dissertation identified several high-value molecules whose patents were expected to expire during 2011–2015 and interpreted these expiries as potential opportunities for Indian generic manufacturers. The study also considered Paragraph IV patent challenges and the associated 180-day exclusivity mechanism as strategic tools for early generic entry [57,72–82].
The economic opportunity associated with patent expiry must nevertheless be interpreted cautiously. Patent expiry does not guarantee successful generic entry because market attractiveness is affected by regulatory requirements, manufacturing capability, litigation, competition, pricing and product complexity. Thus, the study’s patent-cliff analysis is best understood as an opportunity indicator rather than a forecast of realized sales.
1.9 Regulatory compliance and warning letters
Participation in the U.S. market requires continuing compliance with manufacturing and quality requirements. The dissertation reviewed FDA warning letters involving Indian companies and used them as a contextual indicator of compliance challenges. Eighteen warning letters involving India were identified in the study period 1996–2011. This number should not be interpreted as a direct rate of non-compliance because warning letters reflect enforcement actions within a broader inspection and compliance system and do not provide a denominator of all inspected establishments [50,93–106].
It also identified lower representation in fermentation products, controlled substances, steroids, biotechnology, complex chemistry, sophisticated dosage forms and certain specialized products. These differences suggest that India's regulatory strength is not homogeneous across the pharmaceutical product spectrum [49,50,89,91].
1.10 Research gap
The central research gap identified in this study was fragmentation of available evidence. Information on the U.S. pharmaceutical market, Indian exports, DMF registrations and formulation approvals existed separately, but an integrated assessment of India's regulatory strength and market position was limited. The dissertation therefore combined regulatory-registration data with trade statistics and statistical modeling [32].
2. AIM AND OBJECTIVES
Aim: To assess India’s drug approval strength and competitive position in the United States pharmaceutical market using USFDA regulatory-registration data, formulation approvals and pharmaceutical trade data.
Specific objectives
3. MATERIALS AND METHODS
3.1 Study design
A retrospective, descriptive and analytical secondary-data study was conducted. The study integrated three major domains: (i) active Type II DMF registrations associated with India; (ii) U.S. FDA product approvals, with particular emphasis on generic prescription products and ANDAs; and (iii) bilateral pharmaceutical trade between India and the United States. The dissertation describes the work as an integrated assessment based on publicly available regulatory and trade databases [32,55].
3.2 Data sources
For bulk-drug registration analysis, the study used the U.S. FDA/CDER Drug Master File database and evaluated Type II active DMFs available as of 24 October 2011. For finished-product approvals, Drugs@FDA, the Electronic Orange Book and the National Drug Code Directory were used, with product approval information examined through 28 December 2010. Trade data for 1990–2010 were obtained from U.S. Trade Stat Express and related Indian trade sources, including DGCI&S data as described in the dissertation [55,93–106].
The Orange Book was used because it provides information on approved drug products and associated patent and exclusivity information. The dissertation examined prescription, OTC, discontinued and tentative products, while products that were withdrawn or only tentatively approved were excluded from the final forecasting analysis where specified [55,67,72].
3.3 Study variables
Number of active Type II DMFs by country and Indian company.
Number of compounds represented by Indian DMFs.
Annual and cumulative Indian DMF filings.
Number and share of Indian prescription generic approvals/ANDAs.
Product approvals by therapeutic category and dosage form.
Indian and competing-country shares of generic approvals.
Warning letters and associated compliance themes.
Annual pharmaceutical imports from India into the United States.
Growth rates, CAGR and regression-based association between regulatory registrations and trade.
3.4 Harmonized System (HS) code review
The dissertation identified limitations in the official Indian basket of HS codes used for drugs, pharmaceuticals and fine chemicals. To improve coverage, HS codes were reviewed and compared with the existing official basket. The identified basket contained 1,150 codes compared with 457 existing codes, including formulations, bulk drugs and intermediates, biologicals, excipients, herbals, fine chemicals, medical and diagnostic equipment, surgical products, medical devices and diagnostic reagents [55].
Table 1. Coverage of identified HS codes compared with the existing official basket (dissertation data).
|
Category |
Codes identified |
Existing codes |
|
Formulations |
164 |
148 |
|
Bulk drugs & intermediates |
211 |
175 |
|
Biologicals |
63 |
52 |
|
Excipients |
34 |
29 |
|
Herbals |
106 |
28 |
|
Fine chemicals |
464 |
6 |
|
Medical & diagnostic equipment |
62 |
2 |
|
Surgical & dressings |
32 |
14 |
|
Medical devices |
9 |
0 |
|
Diagnostic reagents |
5 |
3 |
|
Total |
1,150 |
457 |
3.5 Data validation
Secondary data were reviewed using spreadsheet-based checking and cross-verification. The dissertation states that data were examined, vetted and double-checked after compilation. Because the underlying sources were historical databases, the analysis was restricted to the dates specified in the source datasets rather than treating the results as current regulatory statistics [55].
3.6 Statistical analysis
Descriptive analysis included counts, percentage shares and annual growth rates. CAGR was used to summarize multi-year growth. Multiple linear regression was fitted with U.S. pharmaceutical imports from India as the dependent variable (Y), while cumulative DMFs and cumulative ANDAs were treated as predictor variables. The dissertation reports validation using SAS Institute statistical software, version 9.2, alongside spreadsheet calculations [55].
The fitted equation reported in the dissertation was: Y = −0.01207 × cumulative DMFs + 1.607416 × cumulative ANDAs − 21.5419. The model had R=0.993883 and R²=0.9878, with 21 observations. The analysis was supplemented by scenario/sensitivity analysis using pessimistic, most-likely and optimistic growth assumptions [55,56].
3.7 Scenario assumptions
For DMFs, the dissertation used 15% growth as a pessimistic assumption, 20% as most likely and 30% as optimistic. For ANDAs, the corresponding assumptions were 25%, 30% and 40%. These assumptions were based on observed historical growth, market maturity, patent expiries and expectations regarding Indian manufacturing and generic opportunities [56].
4. RESULTS
4.1 India’s Type II DMF position
As of 24 October 2011, the dataset contained an estimated 7,652 active/current DMFs filed by 1,857 businesses from 53 countries, covering approximately 2,276 drug substances, intermediates, materials or drug products. India had 2,667 active Type II DMFs associated with 340 holder firms and 632 compounds. India therefore accounted for 34.85% of the active DMFs and 26.71% of the compounds in the examined dataset, while Indian holder firms represented 18.39% of the businesses [55].
Table 2. India’s Type II DMF position in the dissertation dataset as of 24 October 2011.
|
Indicator |
India |
Share/ position reported |
|
Active Type II DMFs |
2,667 |
34.85%; highest among countries |
|
Holder firms |
340 |
18.39%; highest among countries |
|
Compounds represented |
632 |
26.71%; second to U.S. by molecular count |
|
Total active/ current DMFs in dataset |
7,652 |
53 countries |
|
Total holder businesses |
1,857 |
53 countries |
|
Approx. substances/ materials/ products |
2,276 |
All countries |
4.2 Temporal growth of Indian DMF filings
The first Indian DMF identified in the dissertation was filed in 1972. Filings remained limited through the early 1980s, followed by progressive growth after 1986. The acceleration became particularly pronounced after 2000. Annual filings increased from 33 in 2000 to 103 in 2003, 247 in 2005, 309 in 2007 and 351 in 2010. Cumulative filings reached 2,387 by 2010 [55].
Table 3. Selected milestones in India’s annual and cumulative Type II DMF filings.
|
Year |
Annual DMF filings |
Cumulative DMFs |
|
1972 |
1 |
1 |
|
1978 |
1 |
2 |
|
1986 |
3 |
6 |
|
1990 |
1 |
19 |
|
1995 |
4 |
38 |
|
1999 |
23 |
104 |
|
2000 |
33 |
137 |
|
2003 |
103 |
342 |
|
2005 |
247 |
753 |
|
2007 |
309 |
1,339 |
|
2008 |
350 |
1,689 |
|
2009 |
347 |
2,036 |
|
2010 |
351 |
2,387 |
4.3 Company-level competition
Company-level analysis showed substantial Indian participation among the leading Type II DMF holders. Eight of the ten companies listed in the dissertation’s top-ten table were Indian. Teva Group ranked first with 200 active Type II DMFs, while Matrix Laboratories, Aurobindo Pharma, Dr. Reddy’s Laboratories, Cadila Pharmaceuticals, Cipla, Lupin, Ranbaxy and Sun Pharmaceutical Industries represented the Indian firms in the leading group [55].
Table 4. Leading companies by active Type II DMFs in the dissertation dataset.
|
Rank |
Company |
Country |
Active Type II DMFs |
Share |
|
1 |
Teva Group |
Israel |
200 |
2.61% |
|
2 |
Aurobindo Pharma Ltd |
India |
147 |
1.92% |
|
3 |
Matrix Laboratories Ltd |
India |
157 |
2.05% |
|
4 |
Dr. Reddy’s Laboratories Ltd |
India |
136 |
1.78% |
|
5 |
Cadila Pharmaceuticals Ltd |
India |
131 |
1.71% |
|
6 |
Cipla Ltd |
India |
123 |
1.61% |
|
7 |
Lupin Ltd |
India |
108 |
1.41% |
|
8 |
Ranbaxy Laboratories Ltd |
India |
100 |
1.31% |
|
9 |
Sun Pharmaceutical Industries Ltd |
India |
98 |
1.28% |
|
10 |
Mallinckrodt Chemical Inc. |
USA |
75 |
0.98% |
4.4 Molecule-level DMF concentration
Among the 632 compounds represented by Indian DMFs, 193 had four or more Indian DMFs. The dissertation highlighted strong Indian participation for several commercially important molecules. Atorvastatin, for example, had 26 Indian DMFs out of 37 DMFs from all countries. Several compounds had 15 or more active Indian DMFs, indicating concentrated competition among Indian manufacturers [55].
Table 5. Selected molecules with high Indian Type II DMF representation.
|
Molecule |
Indian active DMFs |
|
Citalopram hydrobromide |
15 |
|
Esomeprazole magnesium |
15 |
|
Lansoprazole |
15 |
|
Montelukast sodium |
15 |
|
Olanzapine |
15 |
|
Ondansetron |
15 |
|
Rabeprazole sodium |
15 |
|
Rivastigmine |
15 |
|
Carvedilol |
16 |
|
Efavirenz |
16 |
|
Lamivudine |
16 |
|
Lamotrigine |
16 |
|
Levetiracetam |
16 |
|
Sertraline hydrochloride |
16 |
|
Amlodipine bisulfate |
18 |
|
Aripiprazole |
18 |
|
Donepezil HCl |
18 |
|
Omeprazole |
18 |
|
Irbesartan |
19 |
|
Metoprolol succinate |
19 |
|
Pioglitazone hydrochloride |
19 |
|
Telmisartan |
19 |
|
Losartan potassium |
21 |
|
Pantoprazole sodium |
21 |
|
Cefuroxime axetil |
23 |
|
Venlafaxine hydrochloride |
24 |
4.5 Therapeutic-category profile
India showed a broad regulatory footprint in anti-hypertensive, anti-HIV, anti-diabetic, gastrointestinal, antiviral and anti-infective compounds. The dissertation also identified areas of relative weakness, including selected fermentation products, controlled substances and corticosteroids. Examples of compounds for which the dissertation reported limited or absent Indian DMF representation included Penicillin G, Clavulanate, Fludarabine, Heparin, Acarbose and several controlled substances [55].
This distribution indicates that the Indian advantage was concentrated in high-volume generic categories where chemistry and manufacturing scale could be translated into multiple registrations. By contrast, areas requiring specialized biological processes, controlled-substance handling or more complex manufacturing presented greater barriers to entry.
4.6 U.S. product-approval landscape
The dissertation’s review of CDER product approvals through 28 December 2010 identified 26,232 product approvals, of which 14,905 (57%) remained active and 11,327 (43%) were discontinued. Of the active products, 13,555 (91%) were prescription medicines and 531 (4%) were OTC products, with the remainder represented by tentative approvals [55].
Table 6. U.S. product-approval landscape described in the dissertation.
|
Product-approval status |
Number |
Share |
|
Total approvals |
26,232 |
100% |
|
Active |
14,905 |
57% |
|
Discontinued |
11,327 |
43% |
|
Active prescription |
13,555 |
91% of active |
|
Active OTC |
531 |
4% of active |
|
Other/tentative |
Remainder |
— |
4.7 India’s generic approval growth
Indian prescription generic approvals increased markedly during the study period. The dissertation reports growth from 64 products in 2000 to 402 in 2006 and 1,533 in 2010. Across the 2005–2010 interval, prescription generic approvals increased from 171 to 1,363 according to the specific series used in the dissertation [55].
India’s share of prescription generic approvals also increased over time, reaching more than 30% in selected years in the late 2000s in the comparative country table. The data demonstrate increasing Indian participation in the U.S. generic market and a shift from relatively limited historical participation toward a much larger role.
4.8 India’s position relative to competing countries
The comparative approval analysis showed the United States retaining the largest absolute number of approvals, while India emerged as one of the leading non-U.S. contributors. The dissertation reports that India accounted for 12.24% of total product approvals in the examined dataset, second to the United States at 53.61%. India had products corresponding to approximately 35.4% of the compounds in the relevant analysis and accounted for 11.32% of prescription ANDAs and 9.23% of OTC approvals [55].
The findings are particularly notable because the number of Indian companies with ANDAs was substantially smaller than the number of U.S. companies with ANDAs. This suggests that Indian companies were achieving a comparatively broad product footprint through a smaller set of specialized firms, rather than through a very large number of applicants.
4.9 Dosage forms and therapeutic categories
The dissertation examined India's presence across oral, topical and injectable dosage forms and across therapeutic categories. India’s strongest product-approval presence was reported in central nervous system, cardiovascular, anti-infective and gastrointestinal categories. Stronger representation was also reported for antiretrovirals, antimicrobials, anti-diabetics and dermatological products [55].
The analysis identified weaker participation in corticosteroids, oncology, diagnostics, biotechnology, fermentation-derived products, complex chemistry and sophisticated or specialized dosage forms. These gaps are important because regulated-market competitiveness increasingly depends not only on the ability to manufacture conventional tablets and capsules but also on complex formulations, specialty generics and biologically derived products [49,89,91].
4.10 Warning letters and compliance
The dissertation identified 18 warning letters involving Indian companies between 1996 and 2011. Four Indian companies—Ranbaxy, Sun Pharmaceutical, Dr. Reddy’s Laboratories and Lupin—were also identified among major patent-related competitors. The coexistence of extensive regulatory participation and enforcement actions illustrates that market access is a continuing compliance process rather than a one-time achievement [55].
For journal interpretation, warning-letter counts should be regarded as contextual compliance indicators. They do not measure the absolute quality of the Indian industry because the dataset lacks a standardized denominator for all inspections, facilities and regulatory interactions. Nevertheless, the presence of warning letters reinforces the importance of quality systems, data integrity, cGMP implementation and sustained regulatory readiness.
4.11 India’s pharmaceutical trade with the United States
U.S. imports of pharmaceutical products from India increased substantially over the 21-year period studied. Total imports of bulk drugs and formulations rose from US$4.61 million in 1990 to US$2,495.92 million in 2010. The strongest expansion occurred after 2000, coinciding with rapid increases in Indian DMF filings and ANDA registrations [55,56].
Table 7. Integrated regulatory-registration and U.S.–India pharmaceutical trade series.
|
Year |
Cumulative DMFs |
Cumulative ANDAs |
U.S. imports from India (US$ million) |
|
1990 |
19 |
25 |
4.61 |
|
1995 |
38 |
33 |
10.82 |
|
2000 |
137 |
64 |
55.75 |
|
2001 |
180 |
106 |
151.97 |
|
2002 |
239 |
118 |
264.94 |
|
2003 |
342 |
137 |
418.86 |
|
2004 |
506 |
170 |
326.32 |
|
2005 |
753 |
260 |
358.69 |
|
2006 |
1,030 |
402 |
513.12 |
|
2007 |
1,339 |
658 |
995.93 |
|
2008 |
1,689 |
957 |
1,574.56 |
|
2009 |
2,036 |
1,247 |
1,811.79 |
|
2010 |
2,387 |
1,533 |
2,495.92 |
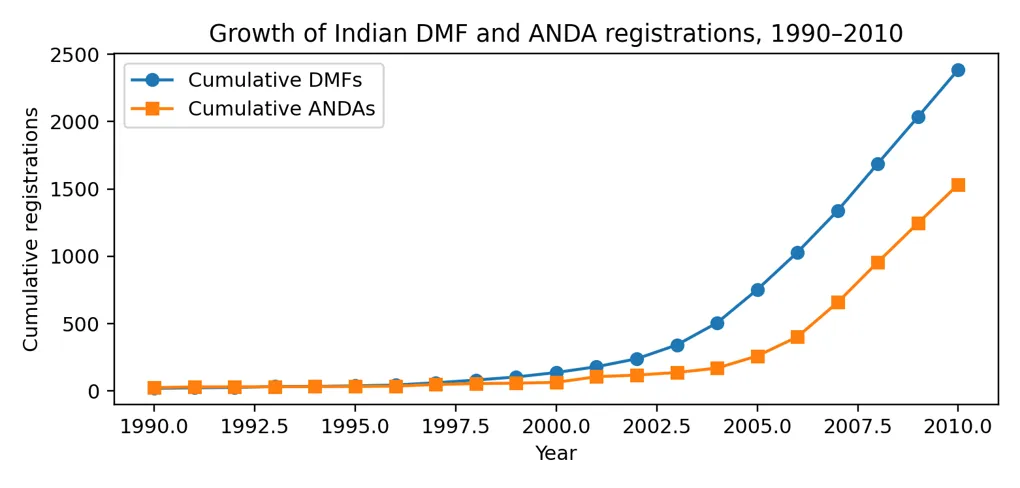
Figure 1. Growth of cumulative Indian DMFs and ANDA registrations, 1990–2010 (dissertation data).
4.12 Regression analysis
A multiple linear regression model was fitted to examine the relationship between cumulative Indian DMF filings, cumulative ANDA approvals and U.S. pharmaceutical imports from India. The dissertation reports 21 observations and a multiple correlation coefficient of 0.993883. The coefficient of determination (R²) was 0.9878, indicating that the two predictors collectively accounted for approximately 98.78% of the variation in the dependent variable within this historical dataset [56].
Table 8. Regression statistics reported in the dissertation.
|
Regression statistic |
Reported value |
|
Multiple R |
0.993883 |
|
R Square |
0.9878 |
|
Root mean standard error |
81.51023 |
|
Dependent mean |
433.78810 |
|
Coefficient of variation |
18.79033 |
|
Observations |
21 |
Table 9. Parameter estimates from the reported multiple linear regression model.
|
Variable |
Parameter estimate |
Standard error |
t value |
p value |
|
Intercept |
−21.5419 |
22.78642 |
−0.95 |
<0.0001 |
|
Cumulative DMF |
−0.01207 |
0.13891 |
−0.09 |
<0.0001 |
|
Cumulative ANDA |
1.607416 |
0.23241 |
6.92 |
<0.0001 |
The fitted equation was: Y = −0.01207(DMF) + 1.607416(ANDA) − 21.5419. The large positive coefficient for cumulative ANDAs indicates a strong positive association between formulation approvals and U.S. pharmaceutical imports in the model. The negative DMF coefficient should not be interpreted as evidence that DMF activity reduces exports; cumulative DMF and ANDA counts are strongly correlated with time and with one another, and the coefficients represent partial associations within a multivariable model [56].
4.13 Model interpretation
The very high R² demonstrates strong in-sample explanatory performance but does not establish causality. Regulatory registrations, exports and time all trend upward across the study period. Consequently, the model may capture common temporal growth and autocorrelation rather than an independent causal effect of approvals on trade. This limitation is especially relevant when the model is used for forecasting beyond the historical sample.
4.14 Growth-rate analysis
The dissertation calculated growth rates for DMFs and ANDAs over 10-year and 5-year windows. For 2001–2010, DMFs showed a CAGR of 33.27% and average year-on-year growth of 33.47%, whereas ANDAs showed a CAGR of 34.56% and average year-on-year growth of 38.71%. During 2006–2010, DMF CAGR was 23.38% with average year-on-year growth of 26.14%, while ANDA CAGR was 39.74% with average year-on-year growth of 43.40% [56].
Table 10. Historical growth rates of Indian DMF and ANDA registrations.
|
Registration measure |
2001–2010 CAGR |
2001–2010 avg YoY |
2006–2010 CAGR |
2006–2010 avg YoY |
|
DMFs |
33.27% |
33.47% |
23.38% |
26.14% |
|
ANDAs |
34.56% |
38.71% |
39.74% |
43.40% |
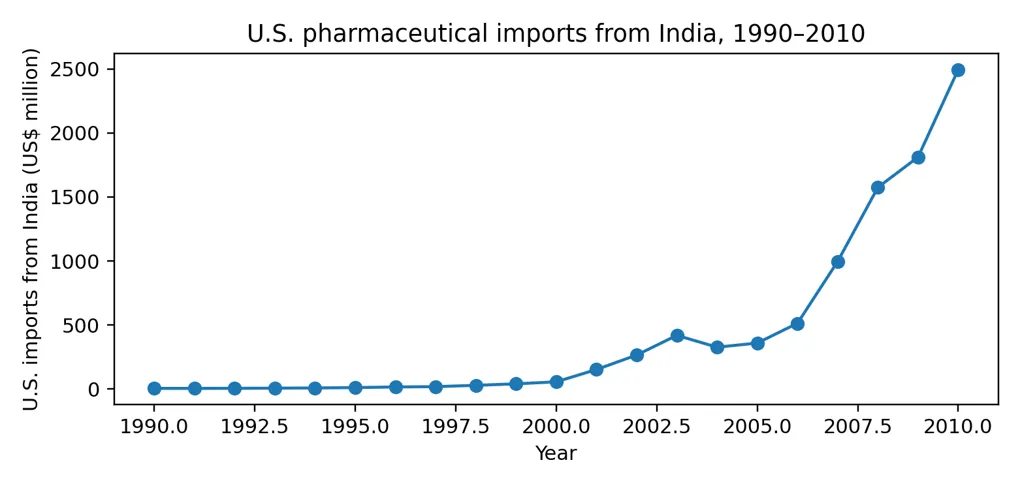
Figure 2. Growth in U.S. pharmaceutical imports from India, 1990–2010.
4.15 Scenario analysis
The dissertation used sensitivity analysis to model three possible growth pathways. For DMFs, pessimistic, most-likely and optimistic growth rates were set at 15%, 20% and 30%, respectively. For ANDAs, the corresponding rates were 25%, 30% and 40%. The model therefore represented uncertainty in future regulatory activity rather than a single deterministic forecast [56].
Table 11. Scenario assumptions and reported export estimates.
|
Scenario |
DMF growth assumption |
ANDA growth assumption |
Reported export outlook |
|
Pessimistic |
15% |
25% |
Approx. US$7.45 billion by 2015 |
|
Most likely |
20% |
30% |
Approx. US$9.07 billion by 2015 |
|
Optimistic |
30% |
40% |
Approx. US$13.14 billion by 2015 |
5. DISCUSSION
5.1 Principal findings
This integrated analysis demonstrates that India had established a substantial position in the U.S. pharmaceutical market by the end of the study period. The strongest evidence was the scale of Type II DMF activity: 2,667 active DMFs associated with Indian facilities represented 34.85% of the examined active DMF dataset. India also represented 632 compounds and 340 holder firms. These findings support the dissertation’s conclusion that India was a leading global source of API-related regulatory submissions to the U.S. market [49,55].
The second major finding was the rapid expansion of generic-product approvals. Indian prescription generic approvals increased markedly during the 2000s, reaching 1,533 cumulative approvals in the dissertation’s 2010 series. This increase occurred alongside the growth of DMF activity and expanding U.S. imports from India. Together, the findings indicate maturation of Indian companies from primarily low-cost manufacturers into sophisticated participants in a regulated generic-drug market [49,53,57,60].
5.2 Why DMFs are an important indicator—but not an approval measure
DMF counts provide a useful indicator of regulatory engagement, API manufacturing breadth and readiness to support finished-product applications. However, the distinction between a DMF and an approved product is essential. FDA guidance states that DMFs are not applications for approval and are reviewed when referenced in an appropriate application [93–99]. Therefore, India's high DMF count should be interpreted as evidence of strong regulatory infrastructure and API participation, not as 2,667 independent drug approvals.
5.3 Growth of Indian regulatory capability
The temporal distribution of DMFs is particularly informative. Only 104 active Indian DMFs were identified from filings before 2000, whereas filings accelerated sharply after 2000. By 2010, cumulative filings had reached 2,387. This pattern is consistent with the dissertation’s interpretation that Indian companies increasingly anticipated the opportunity created by patent expiries, global generic demand and the need to establish regulatory dossiers for U.S. market participation [35,49,55].
The concentration of filings among a relatively small number of leading Indian companies also suggests economies of scale in regulatory affairs. Eight of the ten leading firms in the dissertation’s company-level table were Indian. Such concentration may reflect accumulated expertise in chemistry, analytical development, dossier preparation, manufacturing validation, intellectual property and interactions with regulatory authorities.
5.4 Therapeutic specialization
The strong Indian presence in cardiovascular, anti-infective, anti-HIV, anti-diabetic and gastrointestinal categories is strategically important because these areas contain large generic markets and products amenable to conventional chemical manufacturing. The high number of DMFs for molecules such as losartan, pantoprazole, cefuroxime and venlafaxine illustrates intense competition within established generic categories [55].
However, the same data show that strength in conventional generics does not automatically translate into leadership in complex products. Fermentation products, controlled substances, steroid products, biotechnology, oncology and specialized formulations were identified as areas of weaker representation. Contemporary generic-drug development increasingly emphasizes complex dosage forms, complex active ingredients and advanced quality-by-design approaches, making these gaps strategically relevant [60,61,112].
5.5 Generic approvals and market access
The increase in prescription generic approvals from 64 in 2000 to 1,533 in 2010 represents a major expansion of Indian participation. Generic competition in the United States is supported by a regulatory framework that requires equivalence and quality rather than duplication of the innovator’s entire development program. The literature cited in the dissertation describes the economic rationale for generic substitution and the importance of bioequivalence in demonstrating therapeutic equivalence [12,20,24,60,107–110].
India’s growing share of U.S. generic approvals therefore represents more than an export opportunity. It reflects accumulated competence in regulated product development, manufacturing and regulatory submission. Nevertheless, approval volume should not be equated with profitability because generic markets can experience rapid price erosion and intense competition.
5.6 Relationship between regulatory registrations and exports
U.S. pharmaceutical imports from India increased from US$4.61 million in 1990 to US$2.50 billion in 2010. The parallel increase in cumulative DMFs and ANDAs provides a plausible regulatory-market narrative: greater regulatory participation enabled more Indian products and APIs to enter the U.S. supply chain. The regression model reinforces the strength of the empirical association within the historical dataset [55,56].
However, the association should be interpreted with caution. The model includes cumulative variables that naturally increase over time. In addition, exports depend on factors not included in the regression, including U.S. market demand, product prices, patent litigation, manufacturing capacity, domestic competition, exchange rates, supply disruptions, regulatory enforcement, acquisitions and company-specific strategy. The dissertation itself recognizes these sources of uncertainty and therefore supplements regression with scenario analysis [56].
5.7 Scenario analysis and strategic planning
The scenario framework is one of the useful features of the dissertation because it acknowledges uncertainty. Under the assumptions used in the original study, a most-likely combination of 20% DMF growth and 30% ANDA growth produced a projected U.S. pharmaceutical export value of approximately US$9.07 billion, with pessimistic and optimistic outcomes of approximately US$7.45 billion and US$13.14 billion, respectively [56].
These numbers should be treated as historical scenario projections rather than contemporary forecasts. The assumptions were constructed for the 2011–2015 horizon and cannot be presented as predictions of actual 2026 trade without a new analysis using updated data. Their value in the present manuscript is methodological: they demonstrate how regulatory indicators can be incorporated into strategic market scenarios.
5.8 Regulatory compliance as a competitive capability
The presence of warning letters among some Indian manufacturers highlights the dual nature of regulated-market participation. Regulatory access creates commercial opportunity, but continued access depends on quality-system performance. A mature regulatory strategy therefore requires ongoing cGMP compliance, data integrity, deviation management, process validation, supplier qualification, change control and effective regulatory intelligence [50,93–106].
The dissertation’s relatively small number of warning letters compared with the large number of Indian regulatory filings was interpreted as evidence of substantial compliance capability. A more conservative interpretation is that warning-letter counts alone are insufficient to quantify industry-wide compliance. Nevertheless, the findings support the importance of treating regulatory quality as a strategic asset rather than simply a cost of market entry.
5.9 Patent expiry and the shift from commodity to specialty generics
The dissertation identified patent expiries of major products during 2011–2015 as a major opportunity. Generic entry after patent expiry can create rapid market opportunities, but commodity products often face severe price competition. The dissertation consequently recommended movement toward specialty and super-generics, complex formulations and value-added products [57,72–82].
This recommendation remains conceptually important. The long-term sustainability of an export-oriented pharmaceutical industry is strengthened when firms can compete on formulation technology, manufacturing complexity, regulatory know-how and product differentiation rather than price alone. Advanced delivery systems, difficult-to-manufacture APIs, complex injectables and selected biosimilar or biopharmaceutical opportunities can potentially provide higher barriers to entry, although they require substantially greater technical and regulatory investment [91,112].
5.10 India’s capability gaps
The dissertation identified biotechnology, fermentation products, complex chemistry, specialized dosage forms, corticosteroids, oncology and certain diagnostic products as areas requiring additional capability. These gaps can be understood as technology and regulatory-capability gaps rather than simply shortages of approvals. Moving into these segments requires investment in specialized facilities, analytical methods, process development, clinical evidence where applicable and experienced regulatory personnel.
5.11 Implications for policy and industry
Strengthen national and company-level cGMP and quality systems so that regulatory compliance remains sustainable as export volumes grow.
Expand advanced formulation, complex-API, sterile manufacturing, biotechnology and specialized analytical capabilities.
Develop regulatory-science and intellectual-property expertise, including patent strategy and Paragraph IV capabilities.
Promote structured collaboration among industry, academic institutions, regulatory experts and specialized research organizations.
Improve the quality and completeness of pharmaceutical trade classification systems so that exports can be measured consistently across formulations, APIs, biologicals and related products.
Use scenario planning rather than single-point forecasts when regulatory and market conditions are uncertain.
6. STRENGTHS, LIMITATIONS AND FUTURE RESEARCH
6.1 Strengths of the study
Integration of three complementary indicators—DMFs, formulation/generic approvals and pharmaceutical trade—rather than relying on a single measure of market strength.
Use of regulatory databases and trade statistics covering multiple years.
Country-, company-, molecule- and therapeutic-category-level analyses that reveal heterogeneity within India’s overall performance.
Application of regression and scenario analysis to examine the relationship between regulatory participation and exports.
Explicit recognition of uncertainty and limitations in forecasting.
6.2 Limitations
The study has several limitations that should be considered when interpreting the findings. First, the regulatory datasets are historical. Type II DMFs were assessed as of 24 October 2011 and product approvals as of 28 December 2010. Therefore, the results describe India’s regulatory position during that period and should not be interpreted as current approval counts [55].
Second, the analysis primarily focused on human drugs within CDER. The dissertation excluded or did not comprehensively evaluate several categories, including biologicals outside the defined dataset, veterinary products, herbal products, nutraceuticals and radioactive medicines. Third, publicly available data did not permit complete analysis of market size by molecule, technology intensity, company-level R&D expenditure, manufacturing complexity or all intellectual-property factors [55].
Fourth, the regression model has only 21 observations and uses cumulative time-trending variables. The high R² therefore demonstrates strong in-sample association but does not prove causation. Future studies should use annual rather than cumulative variables where appropriate, test stationarity and autocorrelation, consider lagged relationships, and include macroeconomic and market variables.
Fifth, warning letters were used descriptively and cannot provide a standardized compliance rate because the denominator of inspections and facilities was not established. Finally, the scenario projections are assumption-dependent and were intended for 2011–2015; they should not be extrapolated to the current market without updated data.
6.3 Future research directions
Future research should update the analysis using contemporary FDA databases, current ANDA and DMF information, current U.S.–India trade statistics and modern time-series methods. A longitudinal panel at company or molecule level could evaluate whether regulatory filings precede changes in export value and whether the effect differs by therapeutic category. Additional research should also examine complex generics, biosimilars, sterile products, device-drug combinations and advanced manufacturing.
A future regulatory-strength index could combine active DMFs, ANDAs, inspection outcomes, warning-letter history, approval persistence, product complexity and export value, with appropriate weighting and sensitivity analysis. Such an index would provide a more comprehensive and reproducible measure of international regulatory competitiveness.
7. CONCLUSION
India demonstrated substantial regulatory and commercial strength in the U.S. pharmaceutical market during the historical period analyzed. The country was the leading source of active Type II DMFs in the examined dataset, with 2,667 active DMFs, 632 represented compounds and 340 holder firms as of 24 October 2011. The rapid acceleration of DMF filings after 2000 indicates a major expansion of Indian participation in the U.S. API supply chain.
Finished-product participation also increased markedly. Indian prescription generic approvals expanded during the 2000s, reaching 1,533 in the dissertation’s 2010 series. India developed a strong presence in cardiovascular, CNS, anti-infective, gastrointestinal, anti-HIV and anti-diabetic products, while remaining comparatively weaker in biotechnology, fermentation-derived products, complex chemistry, specialized formulations, selected steroids and oncology.
Trade performance showed a parallel expansion. U.S. pharmaceutical imports from India increased from US$4.61 million in 1990 to US$2,495.92 million in 2010. The reported regression model showed a very high association between cumulative DMFs, cumulative ANDAs and U.S. imports, with R²=0.9878. However, this result should be interpreted as an historical association rather than causal evidence because of common time trends and omitted market factors.
The dissertation’s scenario analysis estimated that, under its 2011–2015 assumptions, U.S. pharmaceutical exports from India could reach approximately US$9.07 billion under the most-likely scenario, with a range of approximately US$7.45–13.14 billion. These projections are historical scenario outputs and should not be treated as contemporary forecasts.
Overall, India’s competitive advantage during the study period was built on manufacturing scale, chemistry expertise, cost efficiency, regulatory experience and a strong generic-product portfolio. The next stage of competitiveness requires a shift toward complex and specialty products, advanced manufacturing, biotechnology, stronger intellectual-property capabilities and sustained quality-system performance. The central policy implication is that regulatory strength should be treated as an evolving strategic capability encompassing product development, manufacturing quality, regulatory science and market intelligence [49,50,93–112].
DECLARATIONS
Ethics approval and consent
Not applicable. The study used secondary, publicly available regulatory and trade data and did not involve human participants, patient records or identifiable personal data.
Data availability
The analysis was based on the historical regulatory and trade databases described in the dissertation. The original study sources include FDA/CDER DMF data, Drugs@FDA, the Electronic Orange Book, the National Drug Code Directory and U.S.–India pharmaceutical trade statistics [55].
Conflict of interest
The manuscript should be accompanied by the authors’ journal-specific conflict-of-interest declaration at submission. No conflict was reported in the underlying dissertation.
Funding
No specific external funding information was reported in the underlying dissertation.
REFERENCES

Sarada Gaudel, S. Rajasekhar, Dr. D. Jothieswari, Assessment of India’s Drug Approval Strength and Competitive Position in the United States Pharmaceutical Market: An Integrated Analysis of USFDA Drug Master Files, Generic Approvals and Pharmaceutical Trade, Int. J. of Pharm. Sci., 2026, Vol 4, Issue 9, 1719-1740. https://doi.org/10.5281/zenodo.22753232
 10.5281/zenodo.22753232