

We use cookies to ensure our website works properly and to personalise your experience. Cookies policy
Bhagwan Mahavir College of Pharmacy, Bhagwan Mahavir University.
Pharmacokinetics (PK) is the study of the absorption, distribution, metabolism, and elimination of drugs, and provides the rationale for designing appropriate dosage regimens. Traditional compartmental and physiologically based pharmacokinetic (PBPK) models are often used to understand drug disposition and predict exposure. Nevertheless, multiple factors, including age, body weight, organ function, genetic variations, disease severity, concurrent therapies, and other variables, may impact the relationship above and contribute to inter individual variability, making dose selection challenging. With its powerful pattern recognition and predictive capabilities, artificial intelligence (AI) has been increasingly adopted in pharmaceutical research and development. This review focuses on the principles and applications of PK modelling and analysis using AI. The key topics include data preparation, feature selection, hybrid models, model evaluation, model interpretation, and model-informed precision dosing. Applications of AI in drug discovery and development were discussed, with an emphasis on published studies that employed machine learning (ML) algorithms for voriconazole dosing prediction, sitafloxacin PK/PD modeling , extraction of drug–drug interaction features, and prediction of unbound drug exposure in the brain. The discussion demonstrated that computational approaches offer modelling flexibility to address diverse research questions but require careful consideration of data characteristics, analysis endpoints, and evaluation criteria to ensure utility and reliability. By combining AI with conventional pharmacometric tools, valuable insights can be uncovered from heterogeneous and often sparse data domains to facilitate decision-making in dose selection and patient care. At the same time, proper validation strategies, informative model reporting, uncertainty analysis, and patient population evaluation are needed to guide the clinical implementation of AI-enabled models and analyses. In summary, AI-enabled PK modelling and analysis should be regarded as an auxiliary to conventional pharmacological principles and clinical decision-making.
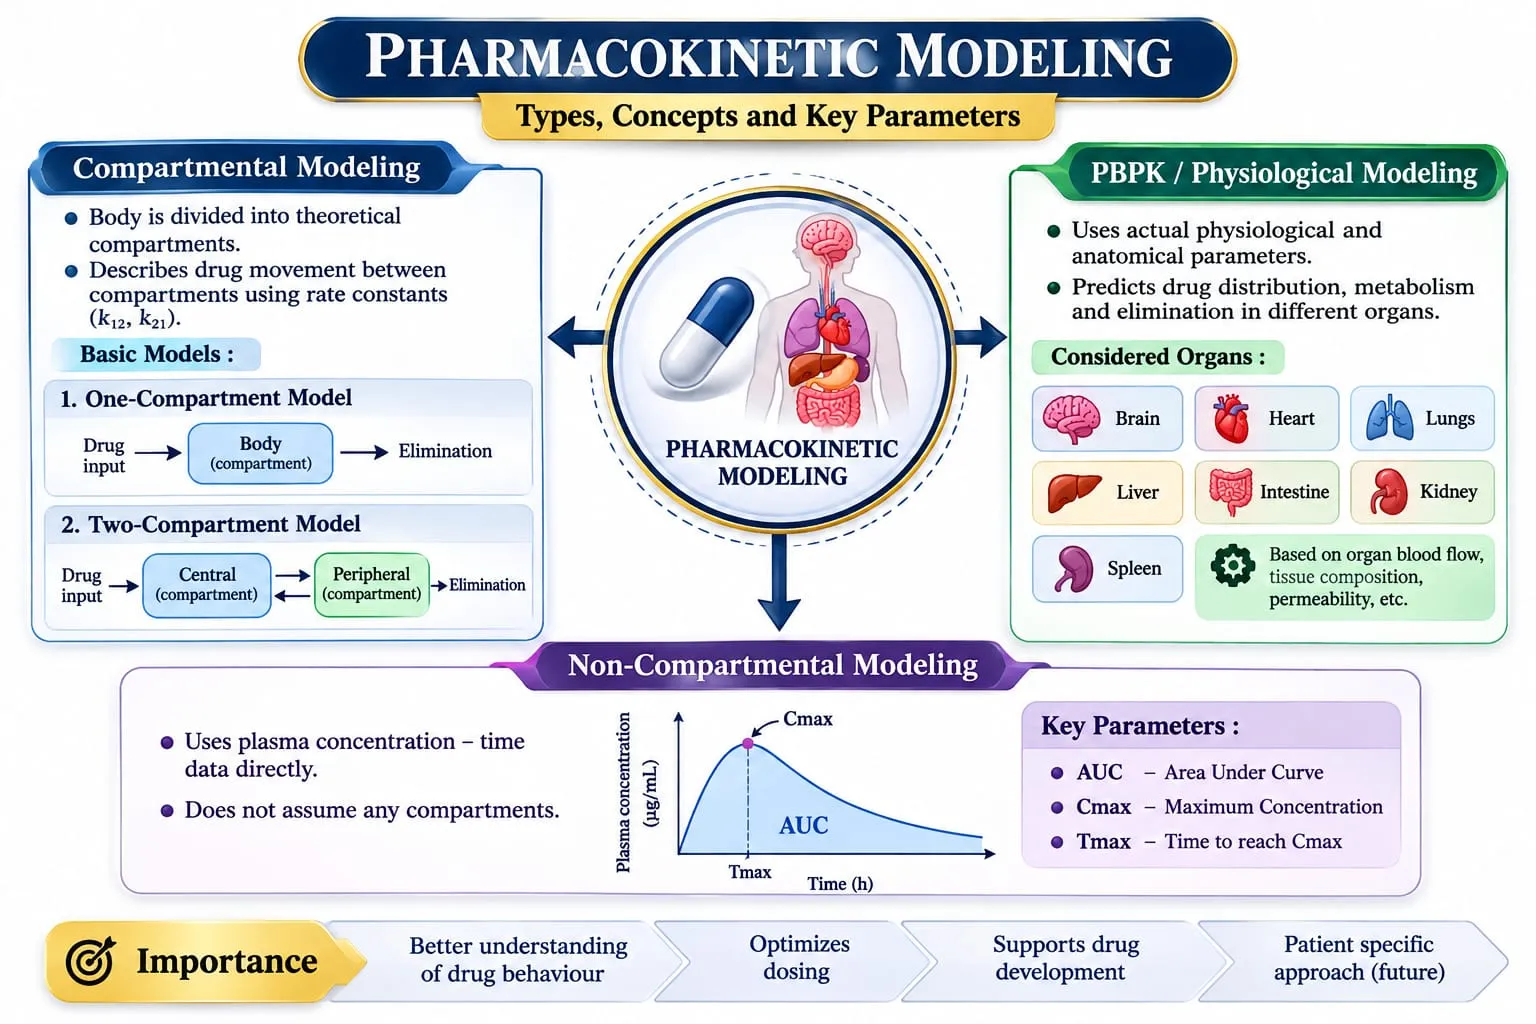
Figure 1: Classification of Pharmacokinetic Modeling Approaches
Pharmacokinetic modelling plays a vital role in drug development and clinical pharmacology because it can describe the temporal changes in drug concentrations after administration. Conventional pharmacokinetic approaches employ mathematical relationships to characterize absorption, distribution, metabolism, and elimination processes. Compartmental models represent the body as a set of interconnected compartments, whereas physiologically based pharmacokinetic (PBPK) models account for physiological and drug-specific information, which enables predicting drug disposition. Pharmacokinetics contribute to dose selection/exposure assessment and may elucidate inter-individual differences in drug response [1, 4, 32, 50].
Pharmacokinetic models may be limited by the presence of physiological or clinical variability in the target patient population. This phenomenon may be associated with critical conditions, extreme age, extreme body weight, impaired renal/hepatic function, genetic variants, disease severity, and concurrent medication use.
The aforementioned factors should be considered for drugs with a narrow therapeutic window or when dosing critically ill patients [17-22, 26, 51]. Artificial intelligence has gained increasing attention owing to its capacity to learn patterns within a large and diverse set of data points. Within the field of pharmacokinetics, machine learning (ML) algorithms have the potential to capture features in diverse datasets, which may aid in quantifying drug concentration, predicting selected pharmacokinetic parameters, identifying covariates, and optimizing posology. Their performance relies on the quality of data, the appropriateness of the algorithm, the availability of informative observations, and the chosen validation approach. [1, 2, 32, 44, 45]
The application of AI methods alongside conventional pharmacokinetic methods may have the potential to complement each other. Mechanistic models provide a pharmacological basis for the process, while machine learning methods provide a more flexible representation of selected non-linearities, which would be absent in a given model structure. Improved prediction should be demonstrated through an appropriate comparison instead of postulating from a given AI method application [32, 44, 47, 48, 50].
This review explores pharmacokinetic modelling assisted by AI and its potential to support precision dosing by considering various modelling approaches, relevant literature, validation, explainability, and challenges in clinical implementation.
2. ARTIFICIAL INTELLIGENCE AND MACHINE LEARNING
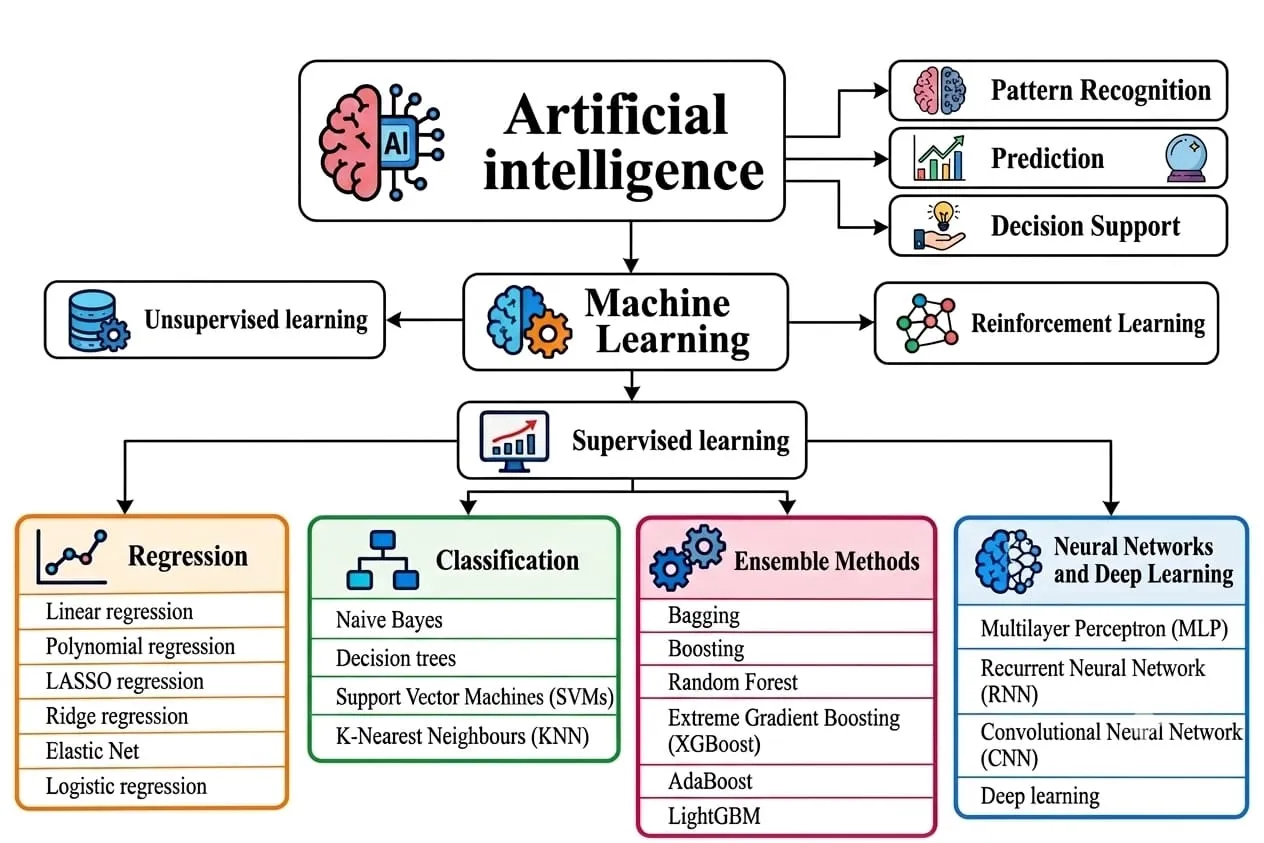
Figure 2: Artificial Intelligence and Machine Learning Classification/Structure
Artificial intelligence (AI) encompasses computational approaches that accomplish functions such as pattern recognition, prediction, and decision support. Machine learning (ML) is a domain of AI that involves algorithms that learn associations from datasets and apply the learned patterns to make predictions or classify observations. In pharmacokinetic applications, ML approaches can examine the associations among patient demographics, drug properties, dosing histories, sampling times, and drug concentrations. [1, 2, 4, 32]
2.1. Machine Learning
ML algorithms learn associations between input variables and defined endpoints. For pharmacokinetic purposes, the input space encompasses demographic characteristics, laboratory findings, drug properties, dosing regimens, and measured concentrations. Depending on the objective, the algorithm can predict a continuous value, classify an observation, identify subgroups, or support a sequential decision-making process.
The choice of ML approach depends on the prediction target, data characteristics, availability of reliable outcome measurements, and intended application. A model developed for a certain drug or population cannot be directly applied to other drugs or populations. [32, 44, 45, 47]
2.2. Types of Machine Learning
ML approaches can be broadly categorized into supervised, unsupervised, and reinforcement learning.
[45, 46, 72]
These approaches aim to address different objectives and should be chosen based on pharmacological questions and available data.
2.3. Supervised Learning
A. Regression
Regression algorithms estimate continuous outcomes, such as drug concentrations or selected pharmacokinetic parameters.
B. Classification
Classification algorithms classify observations into distinct categories.
The performance of the classification algorithms is dictated by the classification endpoint, dataset structure, and choice of validation strategy.
C. Ensemble Methods
Ensemble methods combine the predictions of multiple algorithms or data segments to improve their performance. They often yield more reliable results than the individual classifiers.
Ensemble approaches can improve prediction accuracy for specific tasks; however, their performance should be validated using an appropriate approach.
D. Neural Networks and Deep Learning
Neural networks comprise interconnected computational nodes and can be useful in learning associations between input variables and outcomes. This paradigm has been further expanded to deep learning, where multiple stages of processing are combined to yield improved results.
These approaches can be powerful tools but are often limited by sample size, amount of missing information, data imbalance, and lack of external validation.
[1, 2, 32, 44, 47]
3. AI-ASSISTED PHARMACOKINETIC MODELLING FRAMEWORK
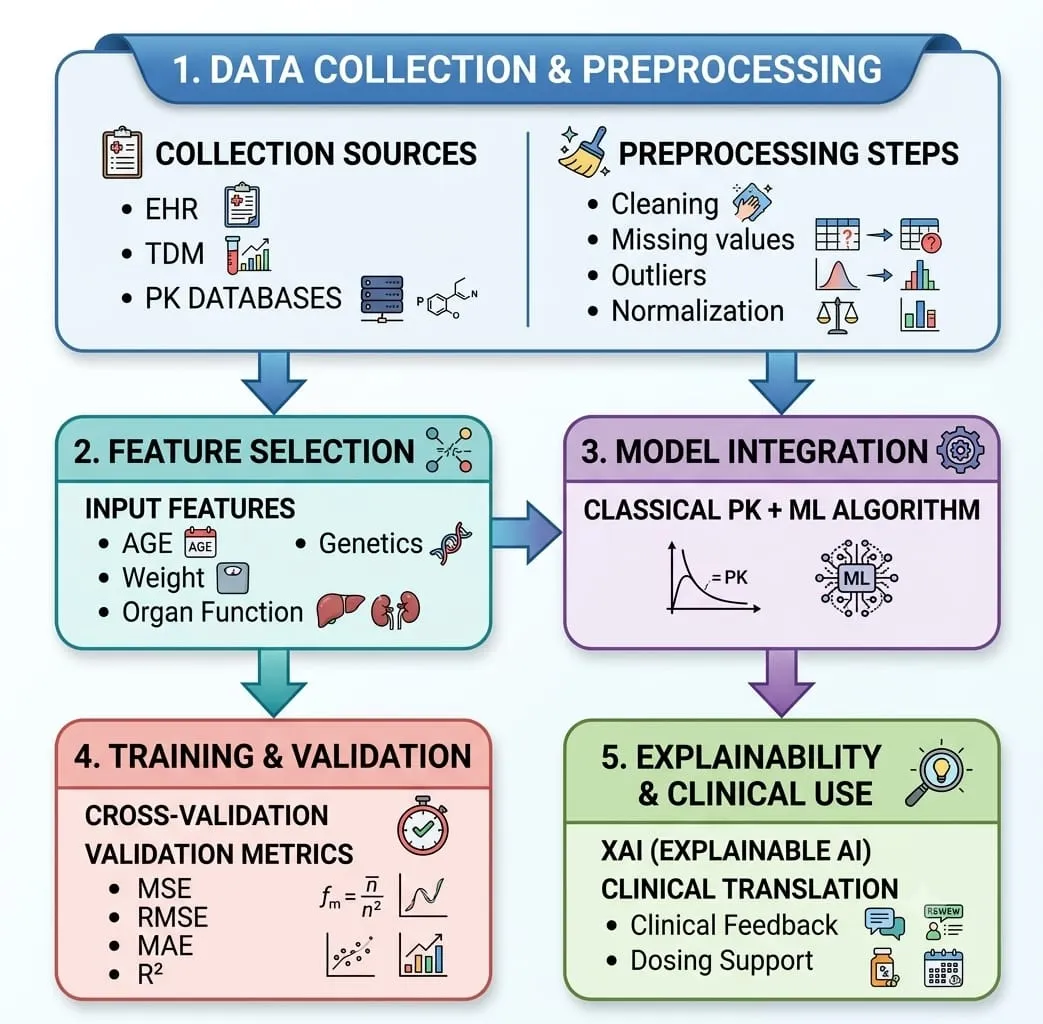
Figure 3: Conceptual Workflow for AI-assisted Pharmacokinetic Modelling.
AI-assisted pharmacokinetic modelling includes pharmacological knowledge, patient or experimental data, statistical analysis, and predictive computation. The design of a modelling framework is determined by the nature of the data that are to be predicted and the structure of the accompanying data. [32, 44, 45, 48, 50]
3.1 Data Collection and Preprocessing
Pharmacokinetic studies can utilize clinical trial data, electronic health records (EHRs), therapeutic drug monitoring (TDM), laboratory measurements, and pharmacokinetic databases. The datasets can include patient demographics, dosing histories, sampling times, measured drug concentrations, laboratory results, and clinical outcome information. [18, 26, 29–31,51] Preprocessing included assessing data completeness, unit harmonization, examining missing values, identifying data-entry inconsistencies, and variable codification. The approaches used to address missing or extreme observations must be rationalized and justified according to the structure and content of the dataset. Data quality is a critical factor, as inaccuracies in dose histories, sampling times, or measured concentrations would impact model development or evaluation. The separation of model development and final test data can also be critical, especially considering that patients are often represented multiple times within a given dataset.
3.2 Feature Selection
Feature selection identifies variables that may be informative for the prediction task. The selection should be informed by pharmacological knowledge and appropriate statistical or machine-learning methods. [32, 44, 45, 48, 50]
The predictors could include:
Regularization methods, such as LASSO, can be used to reduce the number of predictors. However, statistical importance or algorithmic feature importance do not imply a causal relationship or clinical relevance
3.3 Integration of Pharmacokinetic Models and Machine Learning
Hybrid modeling combines a mechanistic pharmacokinetic (PK) model with a machine-learned (ML) component. A compartmental or physiologically based PK model provides a mechanistic framework, and an ML component can be used to estimate selected model parameters, predict residual relationships, or capture nonlinear associations between covariates and drug disposition. [32, 44, 47, 48, 50, 67, 68, 71].
The specific architecture of a hybrid model depends on the drug, available data, target endpoints, and assumptions of the mechanistic component.
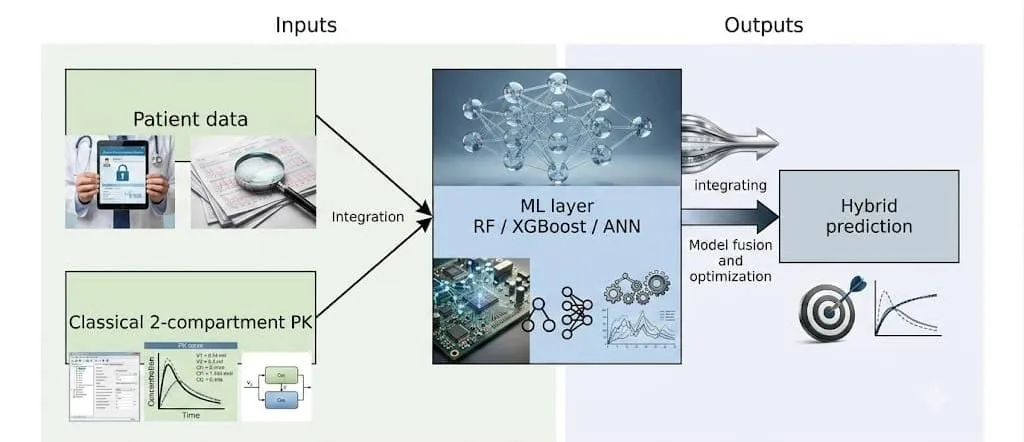
Figure 4: Conceptual Inputs and Outputs of a Two-Compartment PK Hybrid Model
Its performance should be benchmarked against relevant baseline approaches through appropriate evaluation protocols
3.4 Model Training and Validation
The model parameters must be estimated using the development dataset. One or more validation datasets can be used to select the model or tune its parameters, whereas a held-out test set should be used for assessing the final performance. Cross-validation, if applied, should be considered for the selected study designs, provided the data-splitting procedure is compatible with the intended application. [44–50] The evaluation should define the prediction target, comparator, evaluation metrics, and validation design, whereas data leakage should be prevented, and observations from the same patient should be handled with care if patient-level separation is required. The model performance can be evaluated using the mean absolute error (MAE), root mean squared error (RMSE), mean squared error (MSE), and coefficient of determination (R²). The selected metrics need to be consistent with the prediction objective and should be reported along with the relevant units and evaluation context, if applicable.
3.5 Explainability and Clinical Integration
Explainable artificial intelligence (XAI) comprises methods designed to enable users to understand how the model inputs inform the predictions. Feature-importance summaries and partial-dependence plots can provide information about the model's behavior.
However, they cannot ascertain causality, clinical validity, or enhanced patient outcomes. [10, 11, 32, 44] It can be evaluated in conjunction with pharmacological expertise and appropriate clinical judgment.
4. CLINICAL PHARMACOKINETIC DATA
Clinical pharmacokinetic datasets may include drug concentration-time information. Dose administration records, sampling time points, demographic characteristics, and laboratory measurements. Such data are fit for purpose depending on the quality of measurements, study design, populations represented, and type of predictions sought. [18, 19, 26, 29-31, 51]
Clinical trials may provide data from controlled experiments that can be used for model building. However, populations and doses may be restricted, and data from critically ill patients may be complicated by physiological changes, organ dysfunction, concomitant therapy, and variations in sampling schedules. [17, 19, 20, 22, 27, 28]
Therapeutic drug monitoring provides measured concentrations for specific medicines, allowing evaluation of exposure and supporting dose individualization. The information content depends on the timing of sampling, analytical performance, dose history, and other patient factors.
ML or model-informed approaches might help interpretation of such data but do not replace essential aspects such as analytical quality control or clinical judgement. [26, 29-32, 51]
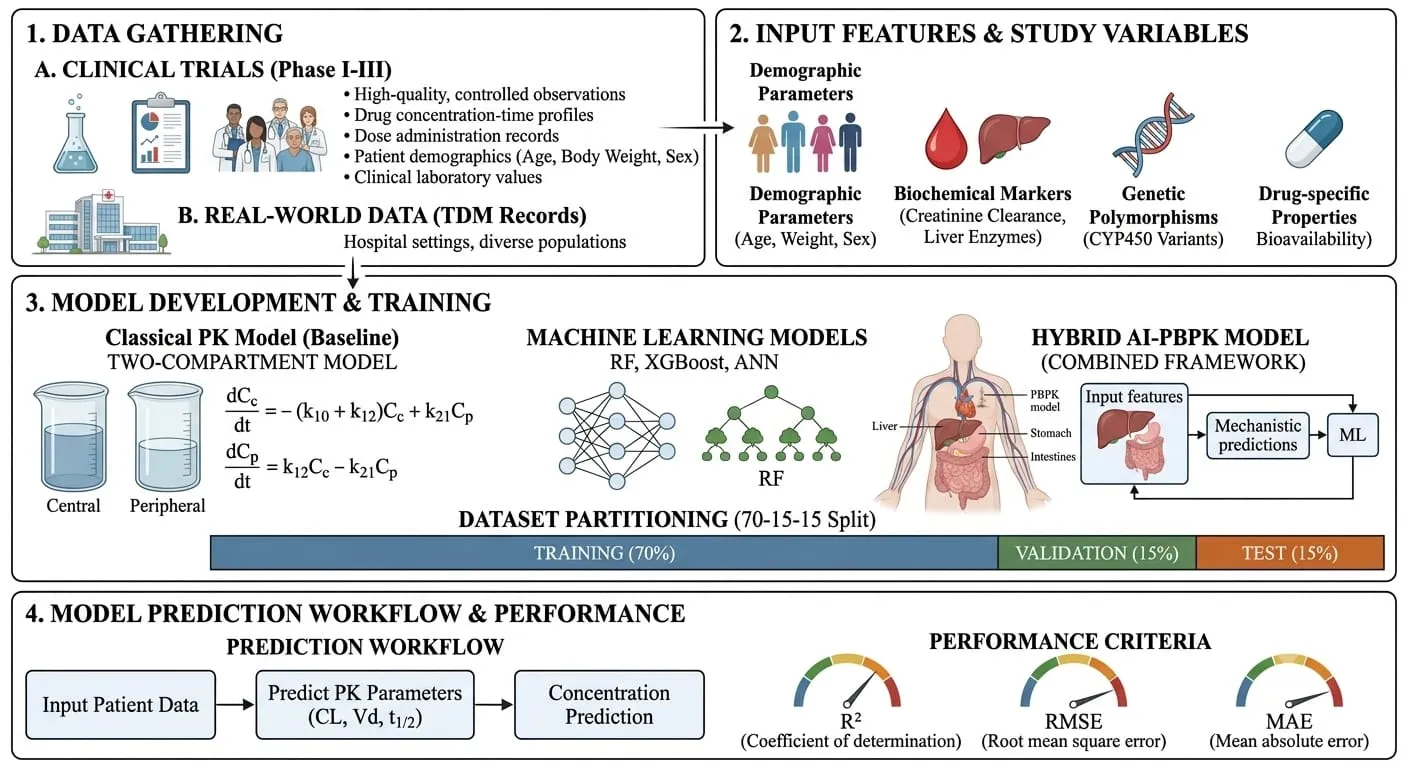
Fig.5 clinical Pharmacokinetic data integration & model-evaluation workflow.
4.1 Study Variables
Potential input variables include demographic, biochemical, genetic, and treatment-related characteristics.Their relevance depends on the drug and the prediction objective.
[32, 44, 45, 48, 50]
Table 1: Category of Variable and Their PK Relevance
| CATEGORY | VARIABLE | PK RELEVANCE/ EFFECT |
|---|---|---|
| Demographics | Age, Body Weight, BMI, Sex | May influence clearance, distribution, or dose requirements |
| Renal Function | Creatinine Clearance & relevant renal markers | May inform renal elimination |
| Hepatic function | Liver-function markers | May inform hepatic drug metabolism |
| Genetics | Relevant CYP450 or other genetic variants |
May influence drug metabolism for selected medicines |
| Dosing Information | Dose, Dosing interval, Administration Timing |
Defines treatment exposure |
| Sampling Information | Sampling time & measured concentration | Required for interpreting concentration–time data |
| Concomitant medicines | Relevant co-administered drugs |
May indicate potential interactions |
| Drug-Specific variables | Relevant known Pk Parameters | May support model development or comparison |
These variables should be selected according to pharmacological relevance and data availability rather than included automatically in every model.
4.2. Classical Pharmacokinetic Models
Classical compartmental models describe drug disposition as a set of mathematical relationships between compartments, representing central and peripheral tissues. A two-compartment model, for instance, characterizes drug distribution between the central and peripheral compartments, with elimination being a function of the appropriate model parameters.
PBPK models provide a more detailed mechanistic analysis by incorporating physiological and drug-specific information and can be used to investigate drug exposure, specific drug interactions, and interindividual differences. The choice between different modeling approaches is dictated by the scientific question, data at hand, and intended application.
[67-77]
4.3 Machine Learning Models
Methods such as random forest, XGBoost, neural networks, and other machine learning (ML) approaches have been explored for drug discovery, pharmacometrics, and prediction of pharmacokinetic parameters. [32, 44–50]
The hybrid approach can potentially employ a combination of a mechanistic model and an ML component. However, the benefits of such a combination are not guaranteed and must be demonstrated using an appropriate comparator, adequate validation, and a well-defined prediction target.
4.4 Dataset Partitioning
Training, validation, and test sets are frequently used to separate the data used to train machine learning models from the data used to evaluate their performance, and the size of each set is often determined by the study design and sample size. I believe that a specific division (e.g., 70% training, 15% validation, and 15% test) is not always optimal and should not be used as a universal rule. In some cases, other methods, such as cross-validation or patient-based separation, might be more rational and efficient; therefore, their use should be justified and mentioned.
Table 2: Dataset Partitioning Strategy
| Dataset Partition | Percentage Share (%) | Primary Purpose / Function in Model Development |
|---|---|---|
| Training Set | 70% | Model training and parameter learning |
| Validation Set | 15% | Model selection and hyperparameter tuning |
| Testing Set | 15% | Final evaluation of model performance |
4.5 Performance criteria
The commonly used performance measures are as follows:
No single metric determines clinical usefulness. Evaluation should consider the prediction task, uncertainty, performance across relevant subgroups, and the consequences of prediction errors.
4.6 Concentration prediction Workflow
A typical process for predicting drug concentrations usually includes collecting relevant information about patients and their treatments, ensuring data quality, using a specific pharmacokinetic model, predicting concentrations or related parameters, and comparing these predictions with appropriate observations
Figure 6: Precision Dosing Work Flow
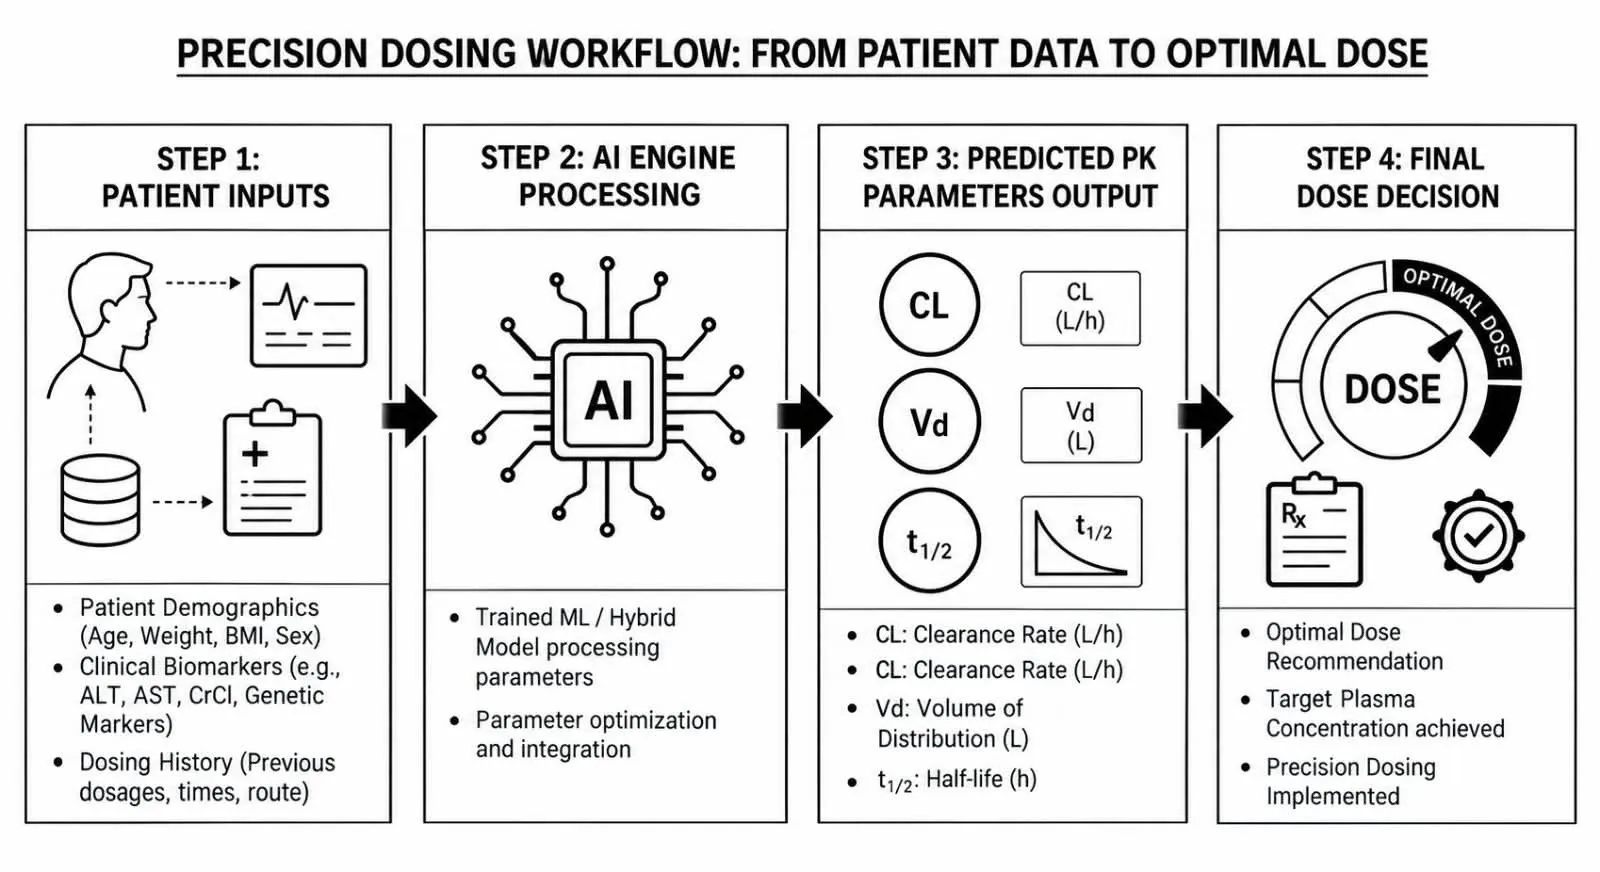
Figure 6: General Workflow for pk Prediction and Precision Dosing
RESULTS
5.1 Predictive Accuracy
The accuracy of pharmacokinetic models that use artificial intelligence is determined by the amount and representativeness of the data used for their development, the choice of methodology, and the characteristics of the drug and patient cohort. It is essential to evaluate the use of models using statistical metrics and specific measurements of pharmacokinetic parameters. Several metrics can be applied to assess the quality of prediction models described above. The most common statistical metrics for evaluating prediction models are the coefficient of determination (R2), mean absolute error (MAE), and root mean square error (RMSE). These three metrics describe the variance of the modeled data set and the accuracy of the algorithm’s prediction. While R2 shows what portion of the total variance of the data set is explained by a particular model, MAE and RMSE describe the average deviation of the predicted values from the observed values. However, the lower the values of these metrics, the better the algorithm performs. Notably, RMSE is more sensitive to large errors than MAE, which makes it a more accurate metric for error measurement. The choice of which metric to use depends on the specifics of the task and the potential impact of errors. To compare the performance of conventional approaches to developing pharmacokinetic models with artificial intelligence solutions, it is necessary to apply them to the same datasets and use consistent definitions of input and output variables and validation strategies. Because these factors affect the results of the models, their differences undermine the possibility of a reliable comparison. In addition, when assessing the performance of algorithms to predict pharmacokinetic parameters, it is also essential to evaluate their performance using external validation. This allows researchers to determine whether the algorithm can generalize the data and perform consistently when applied to patients not included in the original dataset. The application of artificial intelligence algorithms allows researchers to identify associations between patient characteristics, drug doses, and pharmacokinetic parameters. However, such conclusions require validation before being used in practice. The high performance of the algorithms in some cases does not necessarily mean that they will consistently show accurate results. Therefore, when selecting an approach to develop pharmacokinetic models, it is essential to consider not only the accuracy of the results but also other factors that affect the quality of the predictions.
Table 3: Performance Metrics for Evaluating Pharmacokinetic Prediction Models
| Evaluation metric | Purpose in model evaluation | Interpretation |
|---|---|---|
| Coefficient of determination (R²) | Assesses the model's fit to observed data | Higher values may indicate a better fit, but do not independently establish clinical accuracy |
| Mean absolute error (MAE) | Quantifies the average absolute difference between predicted and observed values | Lower values indicate smaller average absolute errors |
| Root mean square error (RMSE) | Quantifies prediction error while giving greater weight to larger errors | Lower values generally indicate smaller prediction errors |
| External validation | Evaluates model performance on independent data | Helps assess generalizability beyond the development dataset |
| Clinical relevance | Assesses whether prediction performance is adequate for the intended dosing application | Requires consideration of drug-specific targets and the consequences of prediction errors |
5.2. Subgroup Analyses
Subgroup analysis can inform performance differences between a model in clinically relevant populations. Subgroups may be defined by age, renal function, hepatic function, disease severity, or other characteristics.
The interpretation of subgroup performance requires knowledge of subgroup definitions, sample sizes, measures, and uncertainty. Differences in model performance could reflect differences in the underlying population, the amount of data available, or the appropriateness of a model for a given subgroup. Subgroup evaluation should be included in the validation where clinically relevant for the indicated use. [5, 17-22, 26, 51]
5.3. Explainability and User Feedback
Explainability methods can identify features that influence a model's outputs. Their utility depends on the model, data, and method of explanation. Feature importance should not be assumed to indicate causality.
Clinical implementation also requires an appropriate evaluation of usability, uncertainty, and consequences of incorrect recommendations. Explainability can support communication with clinicians but does not replace clinical validation or evidence of improvement in patient outcomes. [10, 11, 32, 44]
5.4. Comparative Performance
Comparisons between conventional pharmacokinetic models and AI-assisted approaches should be based on well-defined outcome measures, appropriate comparators, and validated procedures. Models evaluated on different data or for different predictions cannot be reliably compared based only on their reported metrics.
Hybrid approaches may have complementary strengths by incorporating mechanistic pharmacology with machine learning. Their value for a particular drug or population should be demonstrated by appropriately designed comparative studies, and if required, clinical evaluation. [32, 44-50, 67-77]
6. APPLICATION OF PHARMACOKINETIC MODELS
6.1. Model-Guided Sitafloxacin Dosing
Wu et al. evaluated the pharmacokinetic/pharmacodynamic (PK/PD) cut-offs for sitafloxacin against the selected pathogens. The investigators applied a population PK (PopPK) model that was developed using data from 342 patients. Combined with the in vitro pharmacodynamic data and PK/PD targets, the obtained information was implemented in Monte Carlo simulations to estimate the probability of target attainment (PTA) and cumulative fractions of response (CFR). [7] The regimens of 50 mg every 12 hours, 100 mg every 24 hours, and 100 mg every 12 hours were assessed. The authors concluded that the regimens were “associated with the predicted clinical efficacy against S. pneumoniae infections, but further clinical investigation is warranted to confirm their efficacy against P. aeruginosa infections” for the target attainment and pathogens under the considered model. The interpretation of the results depends on the pathogens, PK/PD targets, minimum inhibitory concentrations, and the assumptions of the analysis. [7]
This study is an example of how population pharmacokinetics combined with Monte Carlo simulations can be used to assess exposure targets and corresponding dosing regimens. This study demonstrates the concept of model-guided analysis rather than proves the superiority of one particular approach over another.
6.2. Multimodal Approaches to Drug-Drug Interaction Detection
The analysis of drug–drug interactions (DDIs) is a vital area in clinical pharmacology because the concurrent use of two or more medications can lead to altered exposure, efficacy, and toxicity of drugs. The application of machine learning and natural language processing methods to tackle biomedical questions and extract interaction-related information from the available literature has been extensively studied. However, identifying a DDI relationship is not equivalent to predicting the concentration–time profile of a drug in a patient who receives multiple medications. [24, 25, 39–41]
Yu and colleagues proposed BiGGT, a multimodal framework for DDI extraction that employs a combination of methods related to the Transformer and bidirectional gated recurrent unit (BiGRU) architectures. The model uses information from various representations of drug-related and relevant biomedical data to identify DDI relationships between two drugs. The investigators reported that their method achieved 78.22% precision for the task of DDI extraction. [8]
The precision of 78.22% was demonstrated for the specified task under the chosen evaluation framework.
This cannot be used as a substitute for pharmacokinetic predictions, dose selection, or a direct measure of clinical efficacy. An additional analysis is required to apply such information for patient-specific dose selection.
6.3. Predicting Unbound Drug Bioavailability in the Brain
Predicting central nervous system (CNS) exposure is a critical step in the process of drug discovery and development. The unbound brain-to-plasma ratio at steady state, denoted as, can be used to characterize the distribution of unbound drug between the brain and plasma, where a value of 1 suggests that the drug distribution is similar in the two tissues.
Morales et al. employed machine learning to predict the unbound drug bioavailability in the brain for a set of 157 compounds using data from a manually curated database. The investigators used a series of supervised learning algorithms and demonstrated that extreme gradient boosting achieved an accuracy of 85.1% on the test set for the specified classification task. The authors also validated their performance claims on a prospective basis for a few compounds. [9]
The accuracy of 85.1% was demonstrated for the task of classification for a particular dataset and a particular evaluation framework. The value cannot be directly generalized to other molecules and used as a substitute for clinical efficacy. This work highlights the possibility of using machine learning for a specific task of predicting drug distribution and the necessity of prospective validation.
6.4. Model-Informed Precision Dosing
Model-informed precision dosing (MIPD) is an umbrella term that encompasses the use of pharmacokinetic data, patient-specific considerations, drug concentration measurements, and various models to inform precision dosing in clinical practice. MIPD can be especially useful when drugs demonstrate large interindividual variability in exposure or require tight control over exposure to achieve optimal efficacy and safety. [19, 21, 22, 26, 32, 50, 51]
Machine learning can be used in combination with traditional pharmacometric tools to build models that identify patterns in high-dimensional datasets or highlight important drivers of specific endpoints. For model-informed precision dosing, it is especially important to remember that the appropriateness of a certain approach depends on the drug, population, purpose, and supporting evidence.
A recommendation that comes from a model should always be evaluated in the context of clinical and pharmacological information.
6.5. Future Applications
Additional investigations are needed to explore the potential of applying machine learning techniques alongside compartmental and physiologically based PK (PBPK) models, the use of real-time data, and the performance of such models across different populations. Other key areas of research include opportunities for model interpretation, model sensitivity analysis, data quality, external validation, and various sources of bias that may affect model performance. [32, 44–50, 67–77]
From a clinical perspective, model performance should be evaluated prospectively, and sufficient methodological transparency should be demonstrated to support the claimed indication or indications. If the goal is to demonstrate that a certain AI-driven approach to dosing is superior to the currently available alternatives, it might be necessary to conduct a series of trials to prove the concept.
CONCLUSION
AI-Assisted Pharmacokinetics Modeling is Additional Method for Data Analysis Pharmacokinetics Essay
AI-assisted pharmacokinetic modelling offers additional analytical approaches to address specific issues concerning drug analysis and dosing individualization. Machine learning methods can identify complex relationships, and conventional compartmental and PBPK models can ameliorate the mechanistic understanding of drug disposition. Thus, using both approaches in unison can be a synergistic combination for certain pharmacokinetic analyses.
The published works describe the applications of AI-based pharmacokinetic modelling approaches, from population pharmacokinetic modelling and antimicrobial PK/PD analyses to drug – drug interaction extraction and unbound brain exposure prediction. However, since these applications analyze diverse sets of data with various endpoints, it is crucial to evaluate them individually for each case using appropriate statistical measures.
The value of data obtained via AI-assisted pharmacokinetic modelling can only be determined by the quality of input data, model development, transparency of the created algorithm, external validation, and application to the relevant population. The explainability of the model can aid the interpretation but will not confirm clinical validity or provide assurance of outcome improvement. It is vital to remember that AI technologies should be employed as an addition to the current pharmacological knowledge and not replace it. Pharmacological and clinical analyses using AI should be validated for the specific drug and population intended for use.
LIST OF ABBREVIATIONS
| ABBREVIATION | FULL FORM |
|---|---|
| ADR | Adverse Drug Reaction |
| ADRs | Adverse Drug Reactions |
| AI | Artificial Intelligence |
| ANN | Artificial Neural Network |
| AHR | Androgen Receptor |
| BCRP | Breast Cancer Resistance Protein |
| BiGRU | Bidirectional Gated Recurrent Unit |
| BMI | Body Mass Index |
| CNS | Central Nervous System |
| CL | Clearance |
| CNN | Convolutional Neural Network |
| CYP450 | Cytochrome P450 |
| DL | Deep Learning |
| DT | Decision Tree |
| DDI | Drug-Drug Interactions |
| EGB | Extreme Gradient Boosting |
| EHR | Electronic Health Record |
| GBM | Gradient Boosting Machine |
| GCN | Graph Convolutional Network |
| ICU | Intensive Care Unit |
| KNN | K-Nearest Neighbors |
| LASSO | Least Absolute Shrinkage and Selection Operator |
| LDA | Linear Discriminant Analysis |
| MAE | Mean Absolute Error |
| ML | Machine Learning |
| MLP | Multilayer Perceptron |
| MSE | Mean Squared Error |
| MIPD | Model-Informed precision Dosing |
| NN | Neural Network |
| PBPK | Physiologically Based Pharmacokinetic |
| PD | Pharmacodynamic |
| PK | Pharmacokinetic |
| PK/PD | Pharmacokinetic/Pharmacodynamic |
| PLS | Partial Least Squares |
| PPK | Population Pharmacokinetic |
| QSAR | Quantitative Structure-Activity Relationship |
| R² | Coefficient of Determination |
| RF | Random Forest |
| RL | Reinforcement Learning |
| RMSE | Root Mean Square Error |
| RNN | Recurrent Neural Network |
| SHAP | SHapley Additive exPlanations |
| STX | Sitafloxacin |
| SVM | Support Vector Machine |
| TDM | Therapeutic Drug Monitoring |
| Vd | Volume of Distribution |
| XAI | Explainable Artificial Intelligence |
| XGBoost | Extreme Gradient Boosting |
REFERENCES


Bhavini Gharia, Kishan Ajay Kumar Gupta, Kishan Agrahari, Development of AI-Driven Pharmacokinetic Models for Optimizing Drug Dosing, Int. J. of Pharm. Sci., 2026, Vol 4, Issue 10, 4260-4277. https://doi.org/10.5281/zenodo.23686400
 10.5281/zenodo.23686400