

We use cookies to ensure our website works properly and to personalise your experience. Cookies policy
1Research Scholar, Gujarat Technological University, Ahmedabad, Gujarat, India cum Assistant Professor, Department of Pharmaceutics and Pharmaceutical Technology, L M College of Pharmacy, Ahmedabad - 380009, Gujarat, India.
2Principal, Shree S K Patel College of Pharmaceutical Education & Research, Executive Dean, Faculty of Pharmacy & Faculty of science, Ganpat University, Mehsana-984012, Gujarat, India.
Efonidipine hydrochloride ethanolate (EF) is a dihydropyridine calcium channel blocker that acts on both L- and T-type calcium channels. Its aqueous solubility is very low, which restricts dissolution and oral absorption and makes it a suitable candidate for a lipid-based drug delivery system. Before such a system is optimised, the chemical compatibility of the drug with the selected oil, surfactant and co-surfactant must be confirmed. In the present work, Fourier transform infrared (FTIR) spectroscopy was used to study the compatibility of Efonidipine with Capmul MCM (oil), Tween 80 (surfactant) and Transcutol HP (co-surfactant). Physical mixtures were prepared by trituration and stored in sealed glass vials at 25–28 °C and about 55% relative humidity for one month. Spectra of the pure drug, each excipient and the physical mixture were recorded between 4000 and 400 cm?¹ at a resolution of 4 cm?¹, and each excipient was examined separately against the drug. Pure EF showed characteristic bands at 3410.87 cm?¹ (dihydropyridine N–H), 1704.01 cm?¹ (conjugated ester C=O), 1525.49 and 1348.35 cm?¹ (asymmetric and symmetric NO2), 1221.23 cm?¹ (P=O) and 1058.40 cm?¹ (P–O–C). Each excipient showed bands consistent with its chemical composition. The spectrum of the physical mixture showed no new absorption band, and the resolvable drug bands did not shift beyond the instrumental resolution; the symmetric nitro band appeared at 1349.09 cm?¹. Weaker drug bands were partly masked by intense excipient absorptions, which was attributed to dilution and spectral overlap.
Efonidipine is a 1,4-dihydropyridine calcium channel blocker used in the management of hypertension and angina. Unlike most members of its class, it blocks T-type as well as L-type calcium channels. The T-type component is linked to a reduction in heart rate, lower plasma aldosterone and protection of renal function, and it may also explain why reflex tachycardia and pedal oedema are reported less often than with conventional dihydropyridines[1]. Structurally, the molecule carries a 3-nitrophenyl ring at the 4-position, a cyclic 5,5-dimethyl-1,3,2-dioxaphosphorinane (phosphonate) group at the 5-position and a 2-(N-benzylanilino)ethyl ester at the 3-position. The commercial salt is the hydrochloride ethanolate.
From a formulation standpoint, EF is a difficult molecule. It is highly lipophilic (log P about 5.35), is practically insoluble in water (below 10 µg/mL) and is treated as a Biopharmaceutics Classification System (BCS) class II compound, so its oral absorption is governed by dissolution.[2,3] Several groups have tried to overcome this limitation through solid dispersions prepared by microwave treatment or with enteric polymers, nanosuspensions made by wet milling, co-crystals, co-amorphous systems and mesoporous silica carriers[2] [3] [4] [5] [6] [7] [8] These studies agree on one point: once the solubility barrier is lowered, systemic exposure rises considerably. Lipid-based delivery, however, has received far less attention for this drug.
Lipid-based formulations improve the oral performance of poorly soluble drugs by presenting the drug in a pre-dissolved state, by sustaining solubilisation as the formulation is digested, and, for some lipophilic molecules, by encouraging lymphatic transport[9] [10] [11]. Lipid-based systems of this type are isotropic mixtures of oil, surfactant and co-surfactant that form fine oil-in-water microemulsions on gentle agitation in gastrointestinal fluids[12][13]. In the lipid formulation classification system proposed by Pouton, such systems fall under types III and IV, depending on the proportion of water-soluble components[14][15]. Their performance depends heavily on the choice of excipients, and decades of work on lipid vehicles have shown that the excipients themselves can influence drug stability as much as drug solubility[16] [17].
This is why compatibility testing is a required step in preformulation. ICH Q8 (R2) expects the developer to justify the selection of excipients and to show that they do not compromise the quality of the drug product[18]. Excipients are not always inert. Ester-rich lipids may promote hydrolysis or transesterification, while polyoxyethylene surfactants and glycol ethers may carry trace peroxides, aldehydes and formic acid that can attack susceptible functional groups[19][20][21][22]. Dihydropyridines deserve particular attention because the 1,4-dihydropyridine ring is readily oxidised to its pyridine analogue, a change that removes pharmacological activity.
FTIR spectroscopy is widely used for compatibility screening because it is fast, needs very little sample and does not destroy it. A chemical interaction usually leaves a mark on the spectrum, such as a shift in a characteristic band, loss of a band or the appearance of a new one[23] . In a preceding solubility screening, Capmul MCM (29.22 mg/mL), Tween 80 (79.09 mg/mL) and Transcutol HP (61.11 mg/mL) showed among the highest solubilising capacities for EF within their respective excipient classes and were therefore selected as the oil, surfactant and co-surfactant for an EF-loaded lipid-based formulation. The aim of the present study was to establish, by FTIR spectroscopy, whether EF remains chemically intact in the presence of these excipients after one month of storage under ambient conditions, and thereby to confirm that they are suitable for further formulation work.
MATERIALS AND METHODS:
2.1. Materials:
Efonidipine hydrochloride ethanolate was received as a gift sample from Ajanta Pharma Ltd. (Bharuch, India). Capmul MCM (glyceryl caprylate/caprate) was a gift sample from ABITEC Corporation (Columbus, OH, USA). Labrafil M, Captex 200P, Miglyol, Tween 20, Tween 80, Span 80, Labrasol, Cremophor EL, Transcutol HP, polyethylene glycol 400 and propylene glycol were of pharmaceutical grade and were purchased from JSK Chemicals (Ahmedabad, India). Potassium bromide of spectroscopic grade was used for sample preparation. All other chemicals were of analytical grade and were used without further purification.
2.2. Preparation of physical mixtures:
Physical mixtures of EF with each selected excipient were prepared in a 1:1 (w/w) ratio. A physical mixture of EF with all three excipients was also prepared to represent the composition of the intended formulation. Accurately weighed quantities of drug and excipient were blended in a glass mortar with a pestle for about 5 min to obtain a uniform mixture. The mixtures were transferred to glass vials, sealed and stored at 25–28 °C and about 55% relative humidity for one month before analysis[23] [24].
2.3. FTIR spectroscopy:
FTIR spectra of the pure drug, the individual excipients and the physical mixture were recorded on an IRTracer-100 spectrophotometer (Shimadzu, Kyoto, Japan). Solid samples were prepared by the potassium bromide (KBr) pellet method: a small quantity of sample was mixed with dry KBr at about 1:100 and compressed into a transparent pellet with a hydraulic press. Liquid excipients and the semi-solid mixture were examined as thin films held between two KBr plates[25]. Each spectrum was collected over 4000–400 cm⁻¹ at a resolution of 4 cm⁻¹.
2.4. Spectral interpretation:
Bands were assigned to functional groups using standard correlation tables[25][26][27]. The spectrum of pure EF served as the reference. The spectrum of the physical mixture was then compared with those of the drug and the excipients, and each diagnostic EF band was checked for (i) a shift in position larger than the instrumental resolution, (ii) disappearance or marked broadening, and (iii) the appearance of a new band that could not be explained by either component[23]. Changes in relative intensity alone were not taken as evidence of interaction, because dilution of the drug and overlap with excipient bands are expected to alter intensities in multicomponent samples.
RESULTS AND DISCUSSION:
3.1. FTIR spectrum of efonidipine hydrochloride ethanolate:
The FTIR spectrum of pure EF is shown in Figure 1, and the band assignments are listed in Table 1. A band at 3410.87 cm⁻¹ was assigned to N–H stretching of the dihydropyridine ring. A second band at 3189.48 cm⁻¹ is consistent with hydrogen-bonded N–H/O–H stretching, which may reflect the ethanol of solvation and hydrogen bonding in the crystal lattice. Weak aromatic C–H stretching appeared between 3100 and 3000 cm⁻¹, and aliphatic C–H stretching of the methyl and methylene groups appeared at 2966.86 and 2883.81 cm⁻¹. The broad absorption centred near 2349.90 cm⁻¹, which spans roughly 2600–2200 cm⁻¹, is typical of the N⁺–H stretching envelope of an amine hydrochloride salt[25][26].
In the double-bond region, the strong band at 1704.01 cm⁻¹ was attributed to the carbonyl stretch of the ester at C-3, which is conjugated with the dihydropyridine ring and therefore appears at a lower wavenumber than a saturated ester. The band at 1644.02 cm⁻¹ arises from the C=C stretch of the dihydropyridine ring, with a likely contribution from N–H bending. The nitro group gave its two characteristic bands at 1525.49 cm⁻¹ (asymmetric) and 1348.35 cm⁻¹ (symmetric), and aromatic ring C=C stretching appeared at 1495.47 cm⁻¹. The phosphonate group, which is unusual among dihydropyridines, produced a P=O stretching band at 1221.23 cm⁻¹ and P–O–C stretching bands at 1058.40 and 1008.83 cm⁻¹. The band at 1294.07 cm⁻¹ was assigned to C–N stretching, and bands at 791.30 and 697.03 cm⁻¹ to out-of-plane C–H bending of the meta-disubstituted and monosubstituted aromatic rings[26][27]. Together, these bands form a clear fingerprint for the intact molecule, and the ester carbonyl, nitro, phosphonate and N–H bands were treated as the key markers for the compatibility assessment.
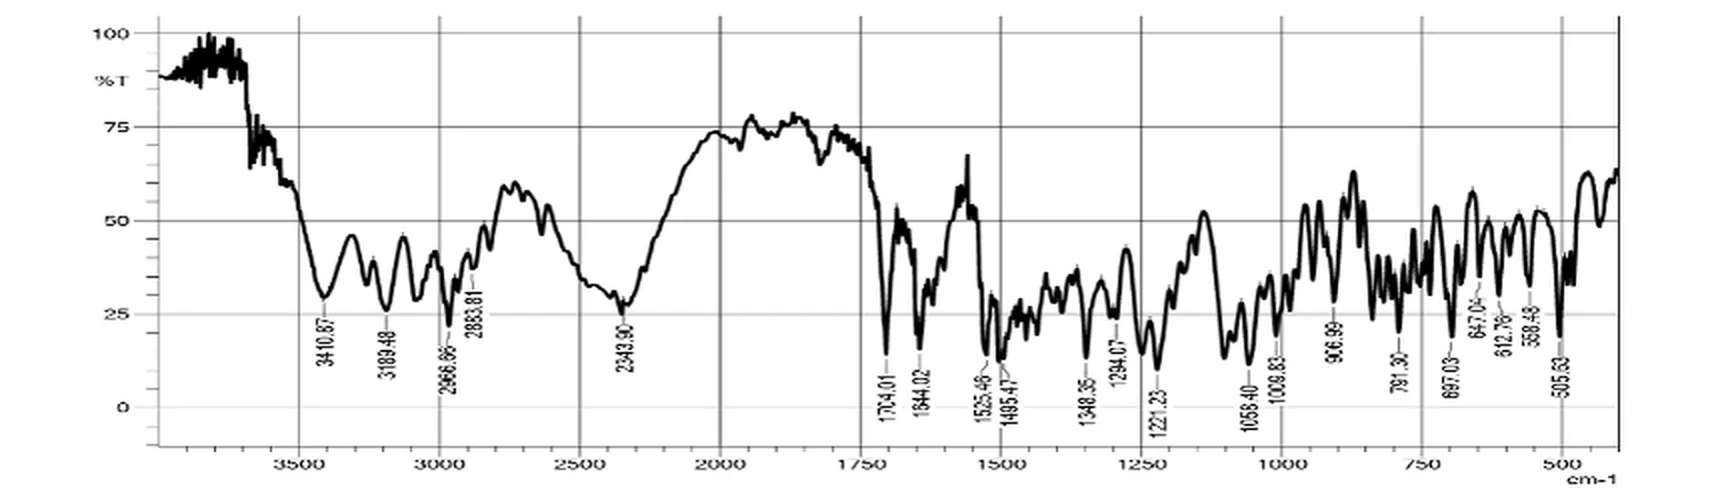
Figure 1: FTIR Spectrum of Pure Efonidipine Hydrochloride Ethanolate
Table 1: Characteristic FTIR Absorption Bands of Efonidipine Hydrochloride Ethanolate
| Observed band (cm⁻¹) | Assignment | Typical range (cm⁻¹) |
|---|---|---|
| 3410.87 | N–H stretching (1,4-dihydropyridine ring) | 3500–3300 |
| 3189.48 | Hydrogen-bonded N–H/O–H stretching (ethanolate, lattice H-bonding) | 3300–3100 |
| 3100–3000 | Aromatic C–H stretching (weak) | 3100–3000 |
| 2966.86, 2883.81 | Aliphatic C–H stretching (CH3, CH2) | 3000–2850 |
| 2349.90 (broad) | N⁺–H stretching of amine hydrochloride | 2700–2250 |
| 1704.01 | C=O stretching of conjugated ester | 1730–1700 |
| 1644.02 | C=C stretching of dihydropyridine ring / N–H bending | 1680–1620 |
| 1525.49 | Asymmetric NO2 stretching | 1550–1500 |
| 1495.47 | Aromatic C=C ring stretching | 1600–1450 |
| 1348.35 | Symmetric NO2 stretching | 1390–1330 |
| 1294.07 | C–N stretching | 1350–1250 |
| 1221.23 | P=O stretching (cyclic phosphonate) | 1300–1200 |
| 1058.40, 1008.83 | P–O–C stretching | 1100–950 |
| 791.30, 697.03 | Aromatic C–H out-of-plane bending | 900–690 |
3.2. Compatibility with Capmul MCM (oil phase):
Capmul MCM is a mixture of mono- and diglycerides of caprylic and capric acids[28]. Its spectrum (Figure 2; Table 2) showed strong aliphatic C–H stretching bands at 2924.84 and 2856.39 cm⁻¹, an intense ester carbonyl band near 1740 cm⁻¹, CH2 scissoring at 1460.28 cm⁻¹, CH3 bending at 1378.99 cm⁻¹ and C–O stretching at 1106.62 and 1049.58 cm⁻¹. The band at 724.44 cm⁻¹ corresponds to the CH2 rocking mode of the long acyl chains, and the broad band near 3450 cm⁻¹ arises from the free hydroxyl groups of the partial glycerides.
With respect to the drug, the most relevant feature of Capmul MCM is its ester carbonyl, which lies about 35 cm⁻¹ above the conjugated ester carbonyl of EF (1704.01 cm⁻¹) and is therefore expected to dominate the carbonyl region of any mixture. Its C–H stretching bands overlap the aliphatic C–H bands of the drug (2966.86 and 2883.81 cm⁻¹), whereas the nitro (1525.49 and 1348.35 cm⁻¹) and P=O (1221.23 cm⁻¹) regions of EF remain largely free of strong Capmul MCM absorption. Medium-chain glycerides carry free hydroxyl groups and ester linkages, so in principle they could take part in hydrogen bonding or transesterification with the drug ester[20] [21]. Such interactions would be expected to shift the drug carbonyl or nitro bands, or to produce a new carbonyl band. No such change was observed in the mixture (Section 3.5), which indicates that Capmul MCM does not react chemically with EF.
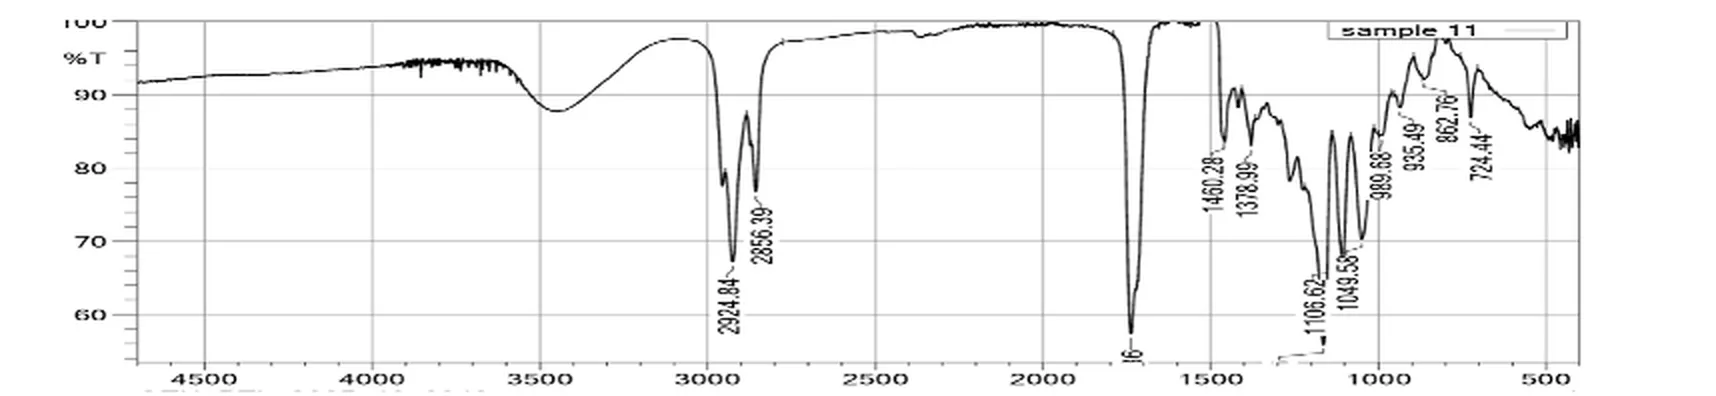
Figure 2: FTIR Spectrum of Capmul MCM (Oil)
Table 2: FTIR Absorption Bands of Capmul MCM
| Observed band (cm⁻¹) | Assignment |
|---|---|
| ≈3450 (broad) | O–H stretching of partial glycerides |
| 2924.84, 2856.39 | Asymmetric and symmetric C–H stretching |
| ≈1740 | Ester C=O stretching |
| 1460.28, 1378.99 | CH2 scissoring, CH3 bending |
| 1106.62, 1049.58 | C–O stretching |
| 724.44 | CH2 rocking of acyl chains |
3.3. Compatibility with Tween 80 (surfactant):
The spectrum of Tween 80 (polysorbate 80; Figure 3; Table 3) showed a broad O–H stretching band near 3450 cm⁻¹, C–H stretching at 2927.79 cm⁻¹, a strong ester carbonyl band at 1728.44 cm⁻¹, C–H bending at 1448.92 and 1381.90 cm⁻¹, and C–O stretching at 1240.71 cm⁻¹. The polyoxyethylene chains gave an intense, broad C–O–C stretching envelope between about 1150 and 1030 cm⁻¹, with resolved components at 1143.74 and 1029.65 cm⁻¹, together with weaker bands at 948.36 and 849.96 cm⁻¹[22].
Tween 80 is the excipient most likely to affect drug stability through its impurities. Polysorbates undergo auto-oxidation of the polyoxyethylene chain and of the oleate double bond, producing peroxides and aldehydes, and they can also hydrolyse at the ester bond[20][22]. For a dihydropyridine, peroxide-driven oxidation of the 1,4-dihydropyridine ring to its pyridine analogue is the main risk. In the infrared spectrum, this change would remove the N–H stretching band and the dihydropyridine C=C band near 1644 cm⁻¹ and introduce aromatic C=N ring bands. The C–O band of Tween 80 at 1240.71 cm⁻¹ lies close to the P=O stretch of EF (1221.23 cm⁻¹), so this region must be read as a composite band in the mixture. The dihydropyridine C=C and nitro bands of EF remain diagnostic and were retained in the mixture without shift, so no evidence of oxidative degradation by Tween 80 was found.
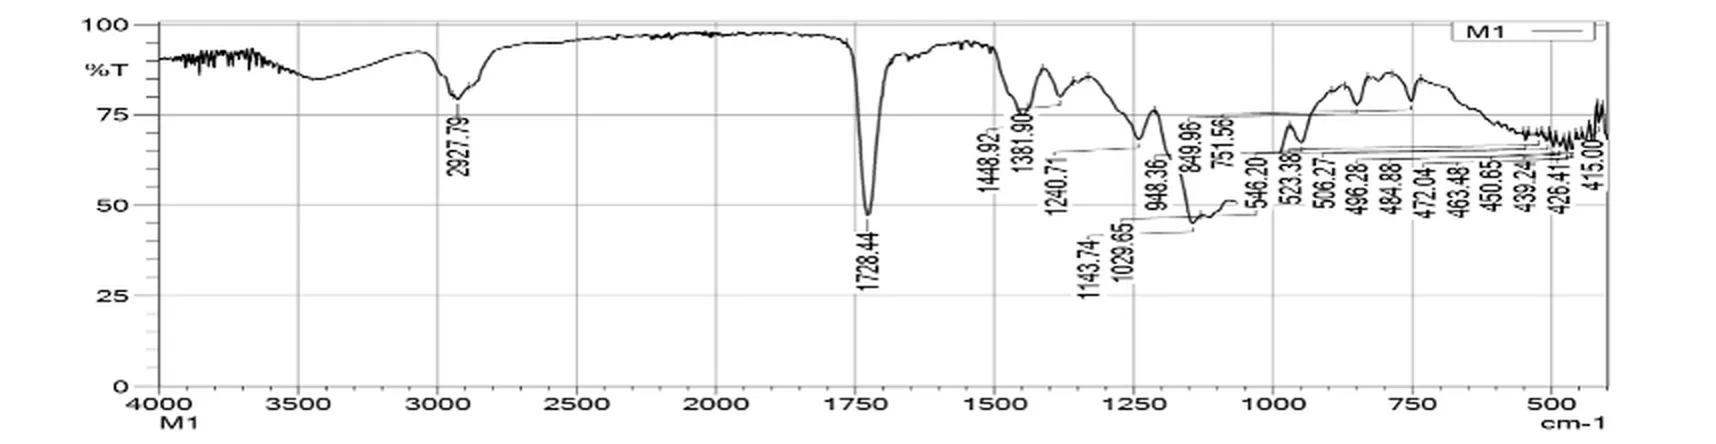
Figure 3: FTIR Spectrum of Tween 80 (Surfactant)
Table 3: FTIR Absorption Bands of Tween 80
| Observed band (cm⁻¹) | Assignment |
|---|---|
| ≈3450 (broad) | O–H stretching |
| 2927.79 | C–H stretching |
| 1728.44 | Ester C=O stretching |
| 1448.92, 1381.90 | C–H bending |
| 1240.71 | C–O stretching (ester) |
| 1143.74, 1029.65 | C–O–C stretching (polyoxyethylene chains) |
| 948.36, 849.96 | C–O–C / CH2 rocking (polyoxyethylene) |
3.4. Compatibility with Transcutol HP (co-surfactant):
Transcutol HP (diethylene glycol monoethyl ether; Figure 4; Table 4) gave a broad O–H stretching band near 3450 cm⁻¹, C–H stretching at 2912.11 cm⁻¹, C–H bending at 1448.92, 1380.47 and 1349.09 cm⁻¹, and a strong C–O–C ether stretching band centred near 1100 cm⁻¹. These features are consistent with its glycol ether structure[28][29].
Because Transcutol HP has no ester group, it cannot take part in transesterification with the drug. Its terminal hydroxyl group could in principle form hydrogen bonds with the N–H or carbonyl groups of EF, which would broaden or shift those bands. Glycol ethers can also contain trace peroxides and aldehydes, which are a recognised source of incompatibility. One practical point affects interpretation: the C–H bending band of Transcutol HP at 1349.09 cm⁻¹ coincides with the symmetric nitro stretch of EF (1348.35 cm⁻¹). The retention of a sharp band at this position in the mixture is therefore supporting, rather than conclusive, evidence. It is consistent with the absence of any new band and the preservation of the dihydropyridine C=C band, both of which point to no chemical interaction with Transcutol HP.
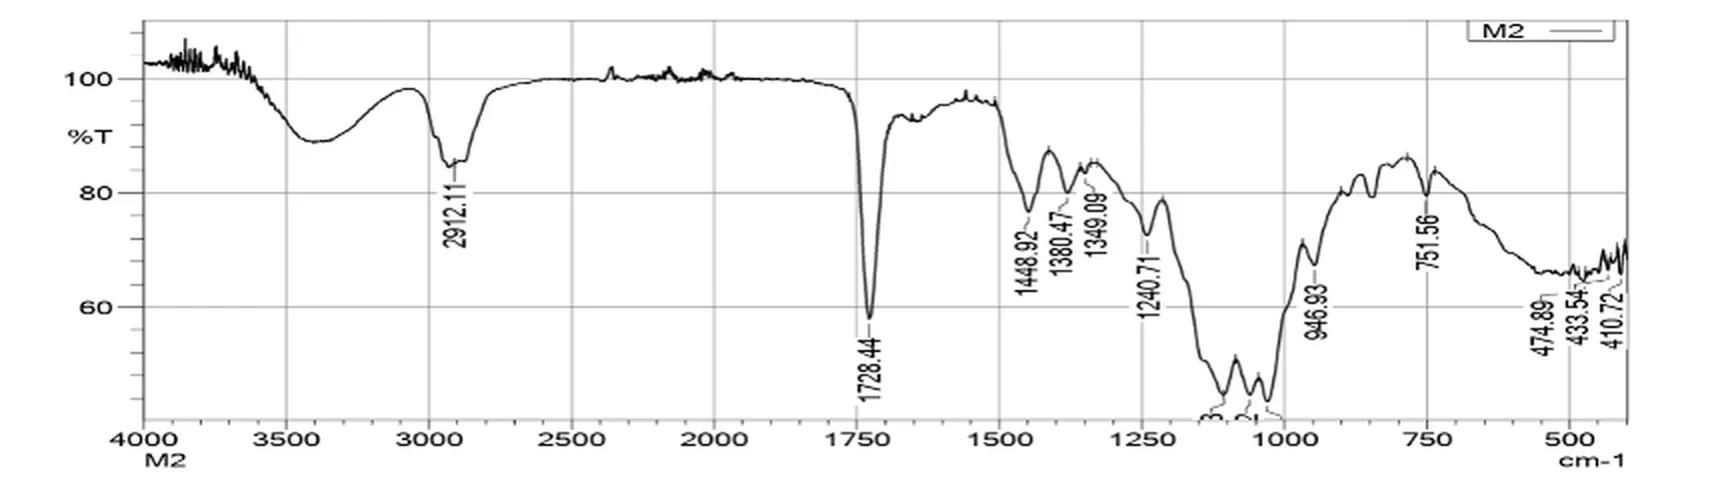
Figure 4: FTIR Spectrum of Transcutol HP (Co-Surfactant)
Table 4: FTIR Absorption Bands of Transcutol HP
| Observed band (cm⁻¹) | Assignment |
|---|---|
| ≈3450 (broad) | O–H stretching |
| 2912.11 | C–H stretching |
| 1448.92, 1380.47, 1349.09 | C–H bending |
| ≈1100 (broad, strong) | C–O–C ether stretching |
3.5. FTIR spectrum of the physical mixture:
The spectrum of the physical mixture of EF with Capmul MCM, Tween 80 and Transcutol HP is shown in Figure 5, and Table 5 compares the diagnostic bands with those of the pure drug (Figure 1). Because the three liquid excipients make up most of the sample and absorb strongly in the C–H, carbonyl and C–O regions, the mixture spectrum is dominated by excipient bands, namely aliphatic C–H stretching at 2922.09 and 2856.49 cm⁻¹, ester carbonyl stretching at 1734.14 cm⁻¹, CH2 bending at 1456.05 cm⁻¹ and a broad C–O–C envelope with its maximum near 1100 cm⁻¹. This pattern is expected and does not by itself indicate an interaction.
The more important question is whether the drug bands that remain visible have moved, and whether anything new has appeared. The symmetric nitro stretching band of EF (1348.35 cm⁻¹) was present in the mixture at 1349.09 cm⁻¹, a difference of less than 1 cm⁻¹, which is well within the 4 cm⁻¹ resolution of the measurement. Its unchanged position indicates that the nitrophenyl moiety was not altered. Overlap with a C–H bending band of Transcutol HP at the same position should, however, be kept in mind. A weak feature near 1645 cm⁻¹ matched the dihydropyridine C=C band of the drug. The band at 1249.27 cm⁻¹ lies in the region where the P=O stretch of EF (1221.23 cm⁻¹) overlaps with the C–O stretching of the ester excipients (1240.71 cm⁻¹ in Tween 80), so it is best read as a composite band rather than a shifted drug band. No absorption appeared in the mixture that could not be traced to either the drug or one of the excipients.
Several weaker EF bands, including the N–H stretch near 3410 cm⁻¹, the ester carbonyl at 1704 cm⁻¹, the asymmetric nitro stretch at 1525 cm⁻¹ and the aromatic out-of-plane bands below 800 cm⁻¹, were not resolved as separate peaks in the mixture. They were masked by the broad O–H band of the excipients, by the intense excipient ester carbonyl at 1734 cm⁻¹ and by the general rise in the baseline at low wavenumbers. This loss of definition follows from the reduced proportion of drug in the sample and from spectral overlap, which are well-recognised limitations of FTIR when a minor solid component is dispersed in strongly absorbing liquid excipients[23]. A true chemical interaction would normally show up differently, for example as a new carbonyl band from hydrolysis or transesterification products, a clear shift of the nitro bands, or the appearance of the aromatic C=N bands typical of an oxidised pyridine derivative. None of these changes was seen.
Taken together, the results suggest that EF does not undergo any detectable chemical change in contact with Capmul MCM, Tween 80 and Transcutol HP over one month at ambient temperature and humidity. This is useful practical information, because medium-chain glycerides, polysorbates and glycol ethers are among the excipients most often used in lipid-based formulations, and their reactive impurities have been implicated in the degradation of other drugs[20][21] [22]. The same excipient classes have been combined successfully in lipid-based systems for other poorly soluble drugs[30] [31]. The present findings therefore support their use for EF.
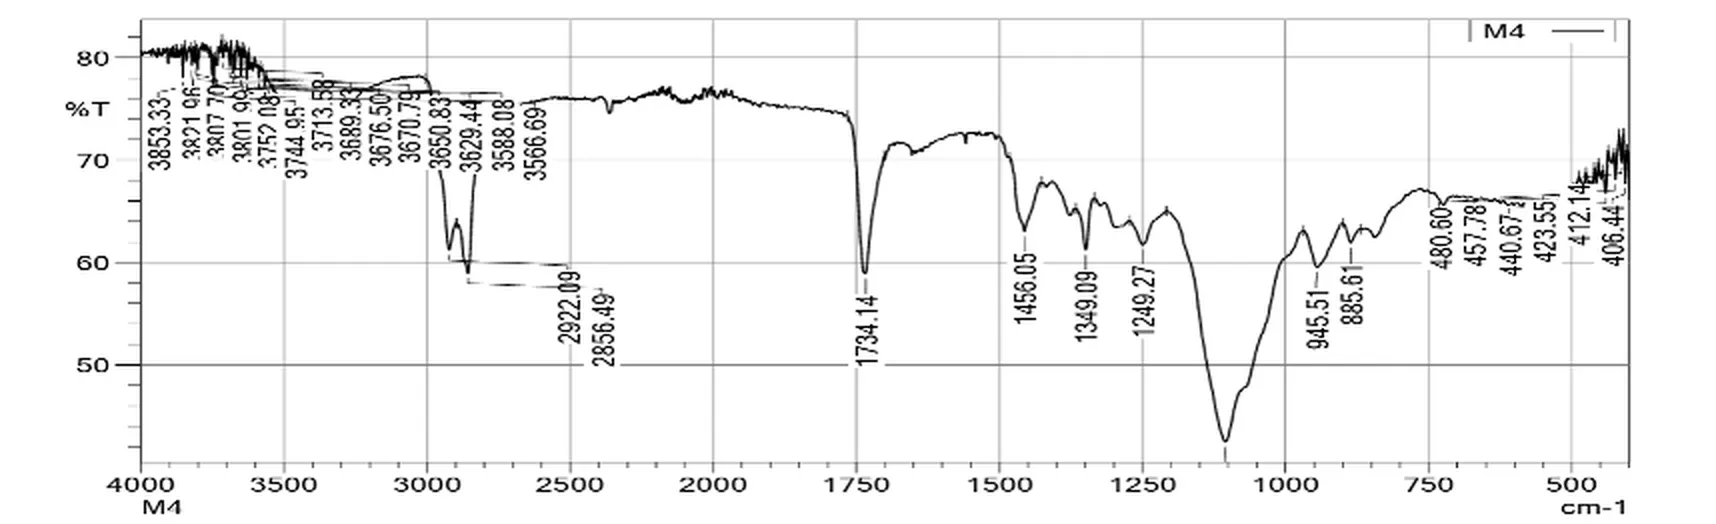
Figure 5: FTIR Spectrum of the Physical Mixture of Efonidipine Hydrochloride Ethanolate with Capmul MCM, Tween 80 and Transcutol HP After One Month of Storage at 25–28 °C and About 55% RH
Table 5: Comparison of Diagnostic Efonidipine Bands in the Pure Drug and in the Physical Mixture
| Functional group | Pure EF (cm⁻¹) | Physical mixture (cm⁻¹) | Interpretation |
|---|---|---|---|
| N–H stretching | 3410.87 | Not resolved | Overlapped by broad excipient O–H band |
| Aliphatic C–H stretching | 2966.86, 2883.81 | 2922.09, 2856.49 | Merged with intense excipient C–H bands |
| Ester C=O stretching | 1704.01 | Not resolved (excipient C=O at 1734.14) | Masked by excipient carbonyl; no new carbonyl band |
| Dihydropyridine C=C | 1644.02 | ≈1645 (weak) | Retained; no shift |
| NO2 asymmetric stretching | 1525.49 | Not resolved | Reduced intensity due to dilution |
| NO2 symmetric stretching | 1348.35 | 1349.09 | Retained; Δ < 1 cm⁻¹ |
| P=O stretching | 1221.23 | 1249.27 (composite) | Overlaps excipient C–O band |
| New bands | — | None observed | No evidence of chemical interaction |
3.6. Limitations:
FTIR spectroscopy detects changes in functional groups. It is less sensitive to low levels of degradation and to purely physical changes such as loss of crystallinity or solubilisation of the drug in the excipient phase. Because several minor EF bands were obscured by excipient absorption in the multicomponent mixture, the conclusion of compatibility rests mainly on the absence of new bands and on the unchanged position of the resolvable drug bands. For a fuller picture, the FTIR data should be supported by differential scanning calorimetry, by a stability-indicating HPLC assay of the stored mixtures, and preferably by spectral subtraction or analysis of binary mixtures, as is commonly recommended for compatibility screening[19][20][21] [22][23].
CONCLUSION:
FTIR spectroscopy was used to evaluate the compatibility of efonidipine hydrochloride ethanolate with Capmul MCM, Tween 80 and Transcutol HP, the oil, surfactant and co-surfactant selected for a lipid-based formulation. The pure drug showed well-defined bands for its dihydropyridine N–H, conjugated ester, nitro and phosphonate groups. After one month of storage as a physical mixture, no new absorption band was observed and the resolvable drug bands did not shift beyond the instrumental resolution. The weakening of some drug bands could be explained by dilution and overlap with excipient absorptions. On this basis, the three excipients are considered chemically compatible with efonidipine and suitable for the development and optimisation of an efonidipine-loaded lipid-based formulation aimed at improving its oral bioavailability.
Acknowledgements:
The authors thank L. M. College of Pharmacy, Ahmedabad, for providing the laboratory facilities and institutional support needed for this work. The authors are also grateful to Ajanta Pharma Ltd., Bharuch, for the gift sample of efonidipine hydrochloride ethanolate and to ABITEC Corporation for the gift sample of Capmul MCM.
Funding:
This research did not receive any specific grant from funding agencies in the public, commercial or not-for-profit sector.
Conflict of Interest:
The authors declare that there is no conflict of interest.
REFERENCES

Mitalkumari Patel, Praful Bharadia, FTIR Spectroscopic Investigation of Drug–Excipient Interactions in a Lipid-Based Formulation of a Calcium Channel Blocker, Int. J. of Pharm. Sci., 2026, Vol 4, Issue 10, 4910-4919. https://doi.org/10.5281/zenodo.23830258
 10.5281/zenodo.23830258