

We use cookies to ensure our website works properly and to personalise your experience. Cookies policy
Department of Pharmacy Practice, Visveswarapura Institute of Pharmaceutical Sciences, Bengaluru-560070, Karnataka, India.
Background: Diabetes mellitus and hypertension require long-term treatment, regular monitoring and sustained medication adherence. Drug-related problems and inadequate patient education may affect treatment outcomes and healthcare utilization. Clinical pharmacists may support chronic disease management through medication review, counselling and follow-up. Objective: To evaluate the impact of clinical pharmacist intervention on hospital readmission, medication adherence, drug-related problems, patient satisfaction and healthcare costs among patients with diabetes mellitus and hypertension. Materials and methods: A six-month hospital-based study was conducted in the General Medicine department of KIMS Hospital and Research Centre, Bengaluru. The thesis reports 100 participants, with 50 in the control group and 50 in the intervention group. Interventions included medication review, medication optimization, patient education, discharge counselling, lifestyle modification counselling and follow-up. Outcomes included readmission, medication adherence, drug-related problems, satisfaction with counselling and selected direct medical costs. Results: At one-month follow-up, readmission was reported in 3% of the control group and 1% of the intervention group. At two months, the results table recorded good medication adherence in 48% of the control group and 49% of the intervention group. In the intervention group, dose too high/low (38%) and cost issues (24%) were the most frequently listed drug-related problems. Patient counselling was rated excellent by (69.4%) of intervention-group respondents. Cost measures varied between groups and did not show a consistent reduction in the intervention group.
Diabetes mellitus is a major non-communicable disease that requires long-term treatment, regular monitoring and continuous medical care. Poor control may lead to complications in several organs and increase the need for healthcare services 1,2.
Hypertension is a chronic condition that requires appropriate drug treatment, regular blood pressure monitoring and long-term follow-up. Good management reduces the risk of cardiovascular and renal complications 3,4. When both conditions occur together, patients usually take several medicines, which makes the regimen more complex and increases the chance of medication-related problems.
Hospital readmission is an important concern in chronic disease. It may follow disease progression, complications or problems that arise after discharge, and it places an extra burden on patients and health services 5. Adverse events after discharge are common, and many are related to medicines 6.
Non-adherence and drug-related problems interfere with effective management of diabetes and hypertension. Medication discrepancies may arise when patients move between hospital and home, which makes medication reconciliation and review an important part of care 7,8.
Clinical pharmacists can help through medication review, identification of drug-related problems, patient education, discharge counselling and follow-up. A randomised clinical trial of a multifaceted in-hospital pharmacist intervention examined its effect on readmission risk 9, and a review of pharmacist roles in reducing readmissions found that effects were greatest when reconciliation, education and follow-up were combined 10. A meta-analysis of pharmacist-led medication reconciliation at hospital transitions also reported fewer readmissions and emergency department visits 11.
Repeated hospitalisation increases expenditure through bed charges, investigations, medicines and other treatment costs. Evaluating pharmacist interventions together with readmission outcomes can show their possible contribution to reducing avoidable use of healthcare. The present study therefore assessed the impact of clinical pharmacist intervention on hospital readmission and costs in patients with diabetes mellitus and hypertension at a tertiary care hospital. Medication adherence, drug-related problems and patient satisfaction with counselling were also evaluated.
MATERIALS AND METHODS
Study design and setting
This was a prospective, controlled study with a pharmacist intervention, conducted in the in-patient wards of the General Medicine department of Kempegowda Institute of Medical Sciences (KIMS) Hospital and Research Centre, Bengaluru, over six months. Patients in the control group received standard care during the 30-day follow-up and were offered pharmacist counselling after it ended.
Study population
Adults (18 years or older) admitted with diabetes mellitus and/or hypertension, with or without comorbidities, and willing to complete 30-day follow-up after discharge were eligible. Patients were excluded if they were admitted for less than 24 hours, admitted for palliative care or terminal illness, had severe psychiatric illness or cognitive impairment that prevented participation (unless a legally authorised representative was available), refused consent, were transferred to another hospital, could not be contacted, or were discharged against medical advice and could not be followed up.
Inclusion criteria
Patients were eligible for inclusion if they:
Exclusion criteria
Patients were excluded if they met any of the following criteria.
Sample size
Sample size was calculated with the formula n = Z²pq/d², using Z = 1.96 (95% confidence), expected proportion p = 0.5, q = 0.5 and allowable error d = 0.10, which gives 96.04. This was rounded up to 100 participants, 50 per group.
Clinical pharmacist intervention
Intervention-group patients received medication review, medication optimisation including dose adjustment where appropriate, patient education, discharge counselling, lifestyle modification counselling, a written medication schedule and follow-up counselling.
Data collection and outcomes
A structured data collection form was used to record data from in-patient case records and follow-up. Variables included demographics, medication history, previous hospitalisation, history of adverse drug reactions, adherence before admission and reasons for non-adherence, self-medication, number and type of pharmacist interventions, length of stay, medicines prescribed, readmission, adherence at one and two months, drug-related problems, satisfaction with counselling and direct medical costs (bed, laboratory and pharmacy charges and drug cost). The primary outcome was hospital readmission within 30 days; the secondary outcomes were the other variables listed.
Ethics and statistical analysis
The study was approved by the Institutional Ethics Committee of KIMS Hospital and Research Centre (Ref. No. KIMS/IEC/D799/P/2026). Written informed consent was obtained from all participants and confidentiality was maintained. Data were entered in Microsoft Excel and analysed with SPSS version 26. Categorical variables are shown as number (percentage) and continuous variables as mean ± standard deviation. Categorical outcomes were compared with the chi-square test (Fisher exact test when expected counts were small). A p-value below 0.05 was considered significant.
RESULTS
Table 1: Distribution of Study Participants Based on Group
| SL No | Group | Frequency(Percentage %) |
|---|---|---|
| 1 | Control Group | 50 (100%) |
| 2 | Intervention Group | 50 (100%) |
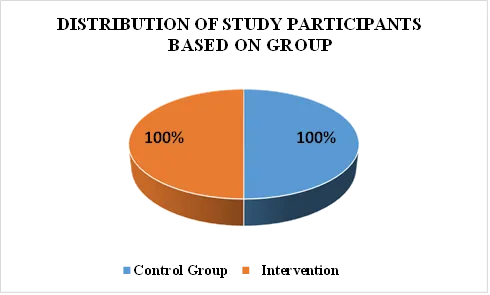
Figure 1: Distribution of Study Participants Based on Group
DISTRIBUTION OF STUDY PARTICIPANTS BASED ON GROUP
The study involved a total of 100 participants, with 50 participants assigned to the control group and 50 participants assigned to the intervention group. The participants were equally distributed between the two groups, allowing for comparison of hospital readmission rates, medication adherence, drug-related problems, and treatment costs to assess the impact of clinical pharmacist intervention.
Table 2: Age-Wise Distribution of Study Participants
| SL No | Age | Control Group N (%) | Intervention Group N (%) |
|---|---|---|---|
| 1 | 29-39 | 4(4%) | 6(6%) |
| 2 | 40-50 | 12(12%) | 8(8%) |
| 3 | 51-61 | 14(14%) | 9(9%) |
| 4 | 62+ | 20(20%) | 27(27%) |
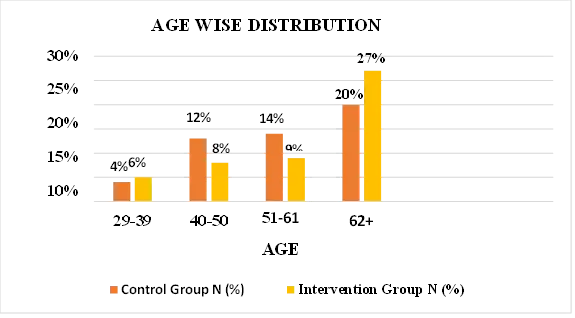
Figure 3: Age-Wise Distribution of Study Participants
The age-wise distribution of study participants showed that the control group had the highest proportion of participants aged 62 years and above, accounting for 20% (n = 20), while the intervention group also had the highest proportion of participants aged 62 years and above, accounting for 27% (n = 27). The 29–39 years’ age group accounted for 4% (n = 4) in the control group and 6% (n = 5) in the intervention group. Overall, the distribution showed that participants aged 62 years and above constituted the highest proportion in both study groups.
Table 3: Gender- Wise Distribution
| SL No | Gender | Control Group n (%) | Intervention Group n(%) |
|---|---|---|---|
| 1 | Male | 18(19%) | 26(26%) |
| 2 | Female | 32(32%) | 24(24%) |
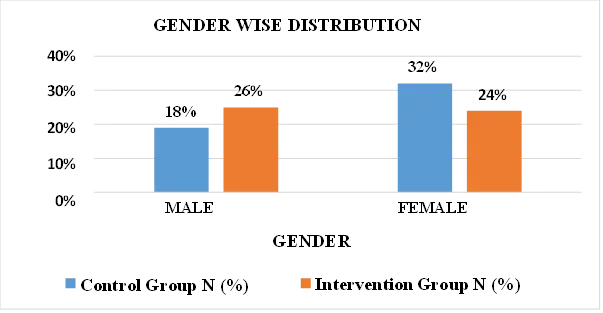
Figure 3: Gender- Wise Distribution
The graph shows the gender-wise distribution of study participants in the control and intervention groups. In the control group, females constituted 32%, while males constituted 18%. In the intervention group, males constituted 26%, whereas females constituted 24%. Overall, females were more predominant in the control group, while the intervention group had a slightly higher proportion of males. This indicates that the gender distribution varied between the two study groups.
Table 4: Distribution of Socioeconomic Status
| SL No | Socio-Economic Status |
Control Group n (%) | Intervention Group n (%) |
|---|---|---|---|
| 1 | Lower | 2 (2%) | 2 (2%) |
| 2 | Lower-Middle | 40 (40%) | 41 (41%) |
| 3 | Upper-Lower | 3 (3%) | 3 (3%) |
| 4 | Upper-Middle | 5(5%) | 4 (4%) |
[Figure - see the formatted PDF]
Figure 4: Distribution of Socioeconomic Status
The graph shows the socioeconomic status of study participants in the control and intervention groups. The lower-middle socioeconomic group had the highest proportion of participants, accounting for 40% in the control group and 41% in the intervention group. The lower socioeconomic group represented 2% in both groups. The upper-lower group accounted for 3% in both groups, while the upper-middle group comprised 5% in the control group and 4% in the intervention group. Overall, most participants belonged to the lower-middle socioeconomic status, with a similar distribution between the two study groups.
Table 5: Distribution of Study Participants Based on Diagnosis
| SL No | Diagnosis | Control Group n (%) | Intervention Group n (%) |
|---|---|---|---|
| 1 | DM | 4 (4%) | 9 (9%) |
| 2 | DM, HTN | 15 (15%) | 12 (12%) |
| 3 | DM, HTN, Co-morbidities |
16 (16%) | 17 (17%) |
| 4 | DM, Co-morbidities | 5 (5%) | 6 (6%) |
| 5 | HTN | 4 (4%) | 2 (2%) |
| 6 | HTN, Co-morbidities | 6 (6%) | 4 (4%) |
[Figure - see the formatted PDF]
Figure 5: Distribution of Study Participants Based on Diagnosis
The graph shows the distribution of study participants based on diagnosis in the control and intervention groups. The highest proportion of participants had DM with hypertension and co-morbidities, accounting for 16% in the control group and 17% in the intervention group. Participants with DM and hypertension accounted for 15% in the control group and 12% in the intervention group. DM alone was present in 4% of the control group and 9% of the intervention group, while DM with co-morbidities accounted for 5% and 6%, respectively. HTN alone accounted for 4% in the control group and 2% in the intervention group, whereas HTN with co-morbidities accounted for 6% and 4%, respectively. Overall, DM with hypertension and co-morbidities was the most common diagnosis in both groups.
Table 6: Distribution of Study Participants Based on Medication Adherence (Before Admission)
| Sl No | Medication Adherence(Before Admission | Control group (%) | Intervention group(%) |
|---|---|---|---|
| 1 | Fair | 35 (35%) | 33 (33%) |
| 2 | Good | 10 (10%) | 8 (8%) |
| 3 | Poor | 5 (5%) | 9 (9%) |
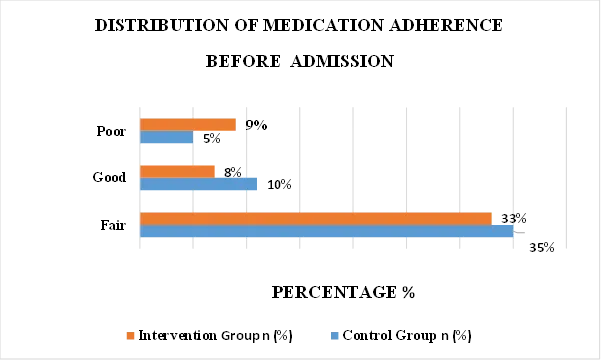
Figure 6: Distribution of Study Participants Based on Medication Adherence (Before Admission)
The distribution of medication adherence before admission showed that fair medication adherence was the most common category in both groups, accounting for 35% in the control group and 33% in the intervention group. Good medication adherence was observed in 10% of the control group and 8% of the intervention group, while poor medication adherence was reported in 5% of the control group and 9% of the intervention group. Overall, both groups showed a predominantly fair level of medication adherence before admission, with a slightly higher proportion of poor adherence in the intervention group.
Table 7: Distribution of Study Participants Based on Reasons for Medication Non-Adherence
| SL No | Reason for Non adherence | Control Group n (%) | Intervention Group n (%) |
|---|---|---|---|
| 1 | Cost | 13(13%) | 16(16%) |
| 2 | Forgetfulness | 37(37%) | 34(34%) |

DISTRIBUTION OF REASONS FOR MEDICATION NON-ADHERENCE
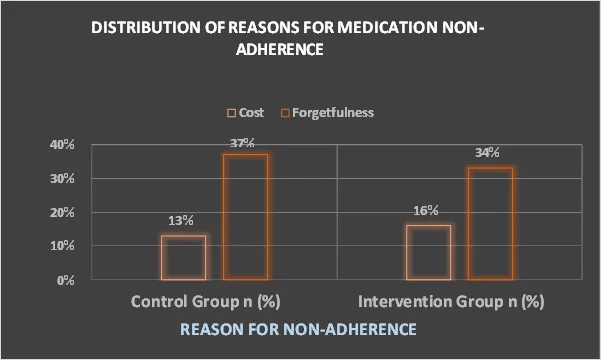
Figure 7: Distribution of Study Participants Based on Reasons for Medication Non-Adherence
The distribution of reasons for medication non-adherence showed that forgetfulness was the most common reason in both groups, accounting for 37% in the control group and 34% in the intervention group. Cost was reported as a reason for non-adherence by 13% of participants in the control group and 16% in the intervention group.
Overall, forgetfulness was the predominant reason for medication non-adherence, while cost was a less frequently reported reason in both groups.
Table 8: Distribution of Study Participants Based on Types of Interventions
| SL No | Number of Interventions | Control Group n (%) | Intervention Group n (%) |
|---|---|---|---|
| 1 | Mean ± SD | - | 3.31±0.58 |
| 2 | Minimum | - | 2 |
| 3 | Maximum | - | 5 |
The mean number of clinical pharmacist interventions was 3.31 ± 0.58 in the intervention group. The minimum number of interventions was 2, while the maximum number was 5. Number of interventions were provided to the control group. Overall, the findings indicate that participants in the intervention group received multiple clinical pharmacist interventions during the study period.
Table 9: Distribution of Study Participants Based on Patient Counselling
| SL No | Patient Counselling | Control Group n (%) | Intervention Group n (%) |
|---|---|---|---|
| 1 | Adherence | - | 2(3%) |
| 2 | Diet And Lifestyle | - | 32(65.3%) |
| 3 | Disease Education | - | 12(24.5%) |
| 4 | Drug name, Dose ,Timing |
- | 4(8.2%) |
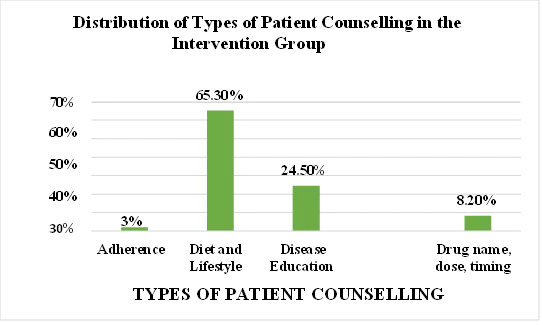
Figure 8: Distribution of Study Participants Based on Patient Counselling
The distribution of types of patient counselling in the intervention group showed that 65.3% of patients received counselling on diet and lifestyle modifications, followed by 24.5% who received disease education. Counselling regarding drug names, dosage, and timing was provided to 8.2% of patients, while 3% received counselling on medication adherence. These findings indicate that diet and lifestyle counselling was the most commonly provided type of patient counselling in the intervention group.
1-MONTH FOLLOW-UP
Table 10: Distribution of Study Participants Based On
| SL No | Follow-up(1 month) | Control Group n (%) | Intervention group n (%) |
|---|---|---|---|
| 1 | No readmission | 47 (47%) | 49 (49%) |
| 2 | Readmission | 3(3%) | 1 (1%) |
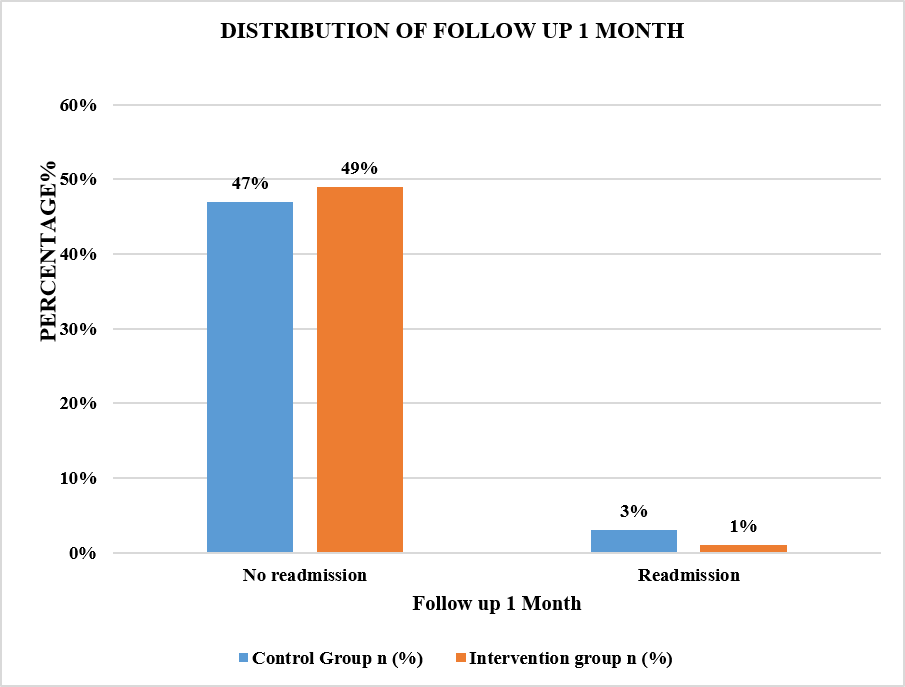
Figure 9: Distribution of Study Participants Based on 1-Month Follow-Up
Table 11: Distribution of Study Participants Based on Medication Adherence at 1-Month
| SL No | Medication adherence at 1 month | Control Group n (%) | Intervention group n (%) |
|---|---|---|---|
| 1 | Fair | 32 (32.3%) | 31 (31.3%) |
| 2 | Good | 17 (17.2%) | 15(15.2%) |
| 3 | Poor | 1 (1%) | 4 (4%) |
[Figure - see the formatted PDF]
Figure 10: Distribution of Study Participants Based on Medication Adherence at 1-Month
The distribution of medication adherence at one month showed that, in the control group, 32.3% of patients had fair adherence, 17.2% had good adherence, and 1% had poor adherence. In the intervention group, 31.3% of patients had fair adherence, 45.2% had good adherence and 4% had poor adherence. These findings indicate that good medication adherence was higher in the intervention group than in the control group at the one-month follow-up.
Table 12: Distribution of Study Participants Based on Medication Adherence at 2-Months
| SL No | Medication adherence at 2 months |
Control Group n (%) | Intervention group n (%) |
|---|---|---|---|
| 1 | Fair | 2(2%) | 1(1%) |
| 2 | Good | 48(48%) | 49(49%) |
[Figure - see the formatted PDF]
Figure 11: Distribution of Study Participants Based on Medication Adherence at 2-Months
The distribution of medication adherence at two months showed that 49% of patients in the intervention group and 48% of patients in the control group had good medication adherence. Fair medication adherence was observed in 1% of the intervention group and 2% of the control group. These findings indicate that good medication adherence was slightly higher in the intervention group than in the control group at the two-month follow-up.
Table 13: Distribution of Study Participants Based on Satisfaction with Clinical Pharmacist (cp) Counselling
| SL No |
Patient satisfaction with CP counselling |
Control group n (%) | Intervention group n (%) |
|---|---|---|---|
| 1 | Excellent | 0 | 34 (69.4%) |
| 2 | Good | 0 | 12 (23.4%) |
| 3 | satisfactory | 0 | 4 (8.2%) |
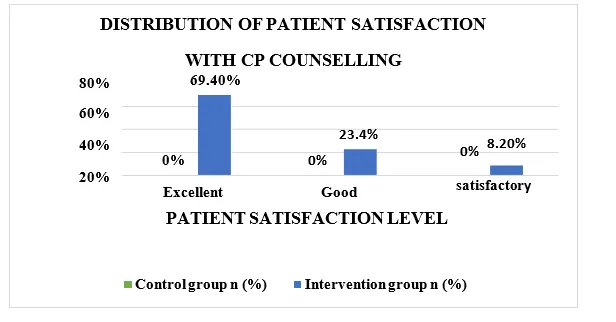
Figure 12: Distribution of Study Participants Based on Satisfaction with Clinical Pharmacist (cp) Counselling
The distribution of patient satisfaction with clinical pharmacist (CP) counselling showed that, in the intervention group, 69.4% of patients rated the counselling as excellent, 23.4% rated it as good, and 8.2% rated it as satisfactory. In the control group, 0% was recorded in all three categories. These findings indicate that most patients in the intervention group were highly satisfied with the counselling provided by the clinical pharmacist.
Table 14: Healthcare Costs
| SL No | Cost Components | Control | Intervention | P –value |
|---|---|---|---|---|
| 1 | Bed charges | 623.53 ± 320.84 | 682.65 ± 296.95 | 0.34 |
| 2 | Laboratory charges | 1,441 ± 324.46 | 1,394 ± 430.19 | 0.54 |
| 3 | Pharmacy charges | 787 ± 319.57 | 749 ± 412.99 | 0.61 |
| 4 | Drug cost per day | 404 ± 140.26 | 399 ± 180.99 | 0.88 |
| 5 | Drug cost at discharge | 597.20 ± 336.60 | 747 ± 518.67 | 0.09 |
No cost component differed significantly between groups. Bed charges and drug cost at discharge were higher in the intervention group, and laboratory and pharmacy charges were slightly lower. The data therefore show no consistent cost saving.
Table 15: Distribution of Study Participants Based on Drug-Related Problems Identified
| SL No | Drug-related Problems Identified |
Intervention group n (%) |
|---|---|---|
| 1 | Cost issue | 24% |
| 2 | Dose too high/low | 38% |
| 3 | Drug interaction | 4% |
| 4 | Drug without indication | 12% |
| 6 | Untreated indication | 10% |
| 7 | Non-adherence | 5% |
| 8 | Wrong dose | 7% |
[Figure - see the formatted PDF]
Figure 13: Distribution of Study Participants Based on Drug-Related Problems Identified
The distribution of drug-related problems identified in the intervention group showed that dose too high/low was the most common problem (38%), followed by cost issues (24%), drugs without indication (12%), untreated indications (10%), wrong dose (7%), non-adherence (5%), and drug interactions (4%). These findings indicate that inappropriate dosing and medication affordability were the major drug-related problems, highlighting the importance of clinical pharmacist intervention to optimize medication therapy and improve patient safety.
DISCUSSION
The present study evaluated the impact of clinical pharmacist intervention on hospital readmission rates and healthcare costs among patients with diabetes mellitus and hypertension. A total of 100 participants were included, with 50 in the control group and 50 in the intervention group.
The findings showed that hospital readmission was numerically lower in the intervention group compared to the control group during the one-month follow-up. Medication adherence at two months was also slightly higher in the intervention group (98%) than in the control group (96%).
The clinical pharmacist intervention helped identify various drug-related problems, among which inappropriate dosing (38%) and cost-related issues (24%) were the most common. Patient counselling played an important role in improving awareness regarding medication use, disease management, diet and lifestyle modifications. Most patients (69.4%) rated the clinical pharmacist counselling as excellent, indicating good patient satisfaction.
In the cost analysis, laboratory and pharmacy charges were slightly lower in the intervention group, whereas bed charges and discharge medication costs were higher. However, no statistically significant differences were observed between the groups (p > 0.05).
Overall, the study highlights the important role of clinical pharmacists in identifying drug-related problems, optimizing medication therapy and providing patient education. Although the intervention group showed some favourable outcomes, the study did not establish statistically significant reductions in hospital readmissions or overall healthcare costs. Therefore, larger studies with longer follow-up periods are required to confirm the clinical and economic benefits of clinical pharmacist intervention.
ACKNOWLEDGMENT
The authors sincerely thank the doctors, nursing staff and healthcare professionals of KIMS Hospital and Research Centre, Bengaluru, for their valuable guidance, cooperation and support throughout the study. The authors also express their heartfelt gratitude to all the patients who participated in this study and shared their valuable time and information.
FUNDING
None
CONFLICT OF INTEREST
The authors declare that there is no conflict of interest.
REFERENCES





Dr. Prasanna Babu K. S., Rajiyabanu K. N., B. S. Indushree, Muhamed Mukthar K. M., Pavithra V., Meghana N., Impact of Clinical Pharmacist Intervention on Hospital Readmission Rates and Cost Analysis in Patient with Chronic Diseases (Hypertension and Diabetes Mellitus) at a Tertiary Care Hospital, Int. J. of Pharm. Sci., 2026, Vol 4, Issue 11, 3224-3235. https://doi.org/10.5281/zenodo.24361893
 10.5281/zenodo.24361893