

We use cookies to ensure our website works properly and to personalise your experience. Cookies policy
Government College of Pharmacy, Pharmaceutics department, Bangalore - 560027, Karnataka, India.
The present study aimed to develop and optimize a topical nanoemulgel containing tofacitinib citrate for localized management of rheumatoid arthritis, thereby reducing systemic exposure and safety concerns associated with oral Janus kinase inhibitors. Tofacitinib citrate was incorporated into an oil-in-water nanoemulsion using eucalyptus oil and a Tween 80-Transcutol®-P surfactant mixture, prepared by low-energy emulsification. A Quality by Design approach defined the target product profile and critical attributes, including particle size, polydispersity index, zeta potential, and entrapment efficiency. Pseudo-ternary phase diagrams confirmed stable nanoemulsion regions, and mixture design optimization identified oil and surfactant ratio as critical variables. The optimized nanoemulgel, formulated with Carbopol 934, exhibited nanosized droplets (<200 nm), low polydispersity, suitable zeta potential, and high drug entrapment. In vitro studies demonstrated sustained release up to 12 hours with consistent permeation flux, while stability testing confirmed formulation robustness. Overall, the developed nanoemulgel shows promise as an effective and safer topical alternative for rheumatoid arthritis management.
Autoimmune diseases affect 8-10% of the global population, with rheumatoid arthritis (RA) being one of the most prevalent and disabling forms (Scott, 1987). In 2019, RA impacted nearly 18 million individuals worldwide, with higher prevalence among women and older adults (Radu, 2021; Kumari et al., 2024). The disease is marked by chronic synovial inflammation, autoantibody production, and progressive joint destruction, often accompanied by systemic complications such as cardiovascular and pulmonary disease, which increase morbidity and mortality.
Despite therapeutic advances, the global burden of RA continues to rise, as shown by increasing incidence and disability-adjusted life years (Guo et al., 2016). Conventional synthetic DMARDs (csDMARDs), particularly methotrexate, remain the first-line therapy due to efficacy and affordability (Tanaka, 2016; Kekane, 2020), but long-term systemic use is associated with adverse effects and variable response (Glynn, 1968). Biologic DMARDs targeting inflammatory mediators such as TNF-α and IL-6 have improved outcomes but are limited by cost, parenteral administration, and infection risk (Karnam, 2024). More recently, Janus kinase (JAK) inhibitors have emerged as effective oral therapies, though systemic safety concerns-including thromboembolic and cardiovascular risks which restrict their widespread use (Zou, 2023).
These limitations highlight the need for localized drug-delivery strategies that maintain efficacy while reducing systemic exposure. Topical nanoemulgels offer enhanced dermal penetration, sustained release, and prolonged drug residence at inflamed joints (Takanashi, 2024; Valrmathy, 2024). Applying Quality by Design (QbD) principles enables systematic optimization of formulation variables, ensuring reproducibility, stability, and regulatory compliance (Pramod et al., 2016). Accordingly, this study focuses on the development and evaluation of a QbD-optimized topical nanoemulgel of tofacitinib citrate as a safer, site-specific alternative to systemic JAK inhibitor therapy (Sinha et al., 2024).
2.1 Materials: Tofacitinib citrate was procured from Optimus Drugs Pvt. Ltd, Hyderabad. The excipients used in the formulation included Eucalyptus oil (Ganesh Oil Distillery, Ooty), Tween-80 (Thomas Baker Chemicals Pvt. Ltd, Mumbai), Transcutol®-P (Gattefosse SAS, Mumbai) and Carbopol-934 (Corel Pharma Chem, Gujarat). Methanol and Triethanolamine were obtained from Spectrochem Pvt. Ltd, Bangalore. Preservatives such as Methyl Paraben and Propyl Paraben were purchased from Hi-Media Laboratories Pvt. Ltd, Thane. Sodium hydroxide was supplied by Spectrochem Pvt. Ltd, Bangalore, while Potassium dihydrogen phosphate was obtained from Central Drug House (P) Ltd, Gujarat. All chemicals and reagents used were of analytical grade.
2.2 Physicochemical Characterization of the Drug Substance: Preformulation studies were conducted to evaluate the fundamental physicochemical characteristics of Tofacitinib Citrate prior to formulation development.
2.3 Screening of Oil, Surfactants and Co-surfactants:
2.3.1 Solubility of Tofacitinib Citrate in oils, surfactant and co-surfactant: To identify the optimal oil, surfactant and co-surfactant phase for nanoemulsion formulation, the solubility of Tofacitinib citrate was assessed using the shake flask method. Five oils (olive oil, IPM, eucalyptus oil, oleic acid, peppermint oil), three surfactants (Tween-20, Tween-80, Poloxamer-188) and two co-surfactants (Transcutol®-P, PEG-400) were selected from literature. Excess drug was added to 2 ml of each excipient, vortexed for 30 sec and shaken at 120 rpm in a 37 ± 0.5 °C water bath for 72 h. Samples were centrifuged at 3000 rpm for 15 min and the supernatant filtered (0.45 µm). Filtrates were diluted with methanol and analyzed spectrophotometrically at 286 nm. Experiments were performed in triplicate and mean solubility values recorded. All excipients were GRAS-certified and suitable for topical use (Patel PA, 2019; Jaydip, 2020).
2.3.2 Emulsification Efficiency Test: To identify the most suitable surfactant system for emulsifying the selected oil phase, various surfactants and co-surfactants were evaluated based on their emulsification efficiency and ability to form stable nanoemulsions. For screening, 1 ml of eucalyptus oil was mixed with 1 ml of Smix of different ratio (1:1, 1:2, 2:1 etc) and vortexed for 60 seconds to ensure uniform mixing. From the resulting isotropic mixture, 1 ml was accurately weighed and added dropwise to the 100 ml of distilled water. To assess emulsification efficiency, observe the emulsification time, clarity and phase separation and % Transmittance is observed using UV- VISIBLE Spectrophotometer at the wavelength 650 nm. The Smix ratio having best emulsification efficiency was selected for plotting psuedoternary phase diagram (Aboul et al, 2017).
2.4 Compatibility Studies
Compatibility studies were conducted to evaluate potential physicochemical interactions between Tofacitinib citrate and the selected excipients used in the nanoemulsion formulation namely eucalyptus oil, Tween 80 and Transcutol®-P. These studies were essential to ensure formulation stability, drug integrity and performance over time (Daware et al, 2025; Sivapriya 2023).
2.4.1 Fourier Transforms Infrared Spectroscopy (FT-IR): It was employed to assess chemical compatibility between the drug and excipients. FT-IR spectra were recorded using a Bruker Alpha II spectrometer across the spectral range of 4000-400 cm⁻¹. Samples analysed included pure Tofacitinib citrate, individual excipients and the optimized nanoemulgel formulation. The spectra were interpreted for any appearance, disappearance, or shifting of characteristic peaks, which could indicate potential interactions or incompatibilities.
2.4.2 Differential Scanning Calorimetry (DSC): Differential Scanning Calorimetry (DSC) was employed to investigate the thermal behaviour of the formulation. Approximately 1–3 mg or ml of each sample was accurately weighed and sealed in aluminium pans using a Shimadzu crimper. A similarly sealed empty pan served as the reference. The analysis was conducted under a nitrogen atmosphere, which acted as the purging gas, at a scanning rate of 10 °C per minute. The temperature ranges for the study extended from 20 °C to 300 °C, with heat runs performed from 3 °C to 320 °C. This thermal profiling provided insights into the formulation’s phase transitions, stability and compatibility of excipients with the active pharmaceutical ingredient.
2.5 Construction of Pseudo Ternary Phase Diagram:
To delineate the nanoemulsion region and identify optimal component ratios, pseudo ternary phase diagrams were constructed using eucalyptus oil as the oil phase and Tween 80 and Transcutol®-P as the surfactant and co-surfactant, respectively. Surfactant-to-co-surfactant mixtures (Smix) were optimized from emulsification efficiency test. Aqueous titration was carried out with Smix blended with the oil phase in varying proportions ranging from 1:9 to 9:1. The mixtures were vortexed for 2–3 minutes to ensure homogeneity. Then slowly drop-by-drop water is added to the mixture of oil and Smix until change in phase is observed. Samples appearing transparent or slightly bluish were considered indicative of nanoemulsion formation. The phase diagrams were plotted to highlight the nanoemulsion zones and each experiment was performed in triplicate to ensure reproducibility. Chemix School software was used to plot the diagram (Mendes et al, 2016).
2.6 Formulation Development using Quality by Design (QbD)
2.6.1 Setting Quality Target Product Profile (QTPP) and Critical Quality Attributes (CQAs): The development of a nanoemulgel formulation for topical delivery of Tofacitinib citrate was guided by the principles of Quality by Design (QbD), beginning with the establishment of a Quality Target Product Profile (QTPP). The QTPP outlines the desired characteristics of the final product that align with therapeutic goals and regulatory expectations. For topical nanoemulgel systems, key attributes include optimal particle size for enhanced skin permeation, physical stability (absence of phase separation) and effective drug release to ensure local action. These attributes were selected to ensure patient-centric performance, safety and efficacy. Based on the QTPP, Critical Quality Attributes (CQAs) were identified-parameters that directly influence product quality and must be controlled throughout development. Any variation in QTPP may significantly impact CQAs, thereby affecting the overall performance of the formulation. This systematic approach ensures that the formulation remains robust, reproducible and compliant with its intended use (Vohra et al, 2017).
2.6.2 Risk Assessment and Process Understanding:
In the context of Quality by Design (QbD), a systematic evaluation of formulation components and variables was undertaken to identify factors that significantly influence the therapeutic performance of the nanoemulgel containing Tofacitinib citrate. To explore potential interactions between the drug and selected excipients-eucalyptus oil, Tween 80 and Transcutol®-P -multiple unit operations were considered during preliminary development. A structured risk assessment approach was employed to anticipate possible formulation failures that could impact critical quality attributes (CQAs). Using Failure mode effective analysis (FMEA) diagram was constructed to facilitate visualization of probable root causes and minor contributing factors affecting CQAs such as Particle size, PDI, Zeta potential and entrapment efficiency. This tool enabled efficient categorization of risks under domains such as material attributes, process parameters and environmental conditions, thereby guiding the selection of variables for further optimization.
2.6.3 Experimental Design: A mixture design approach was used to optimize the nanoemulsion, ideal for systems where responses depend on component proportions. The formulation included oil (15–20%), Smix (25–30%) and water (50–55%), selected from pseudo-ternary plot screening to ensure stability and coverage of the nanoemulsion region. A Simplex Lattice Design with 6 mixture points and 2 replications (8 runs) systematically explored component interactions. Responses measured particle size, PDI, zeta potential and entrapment efficiency assessed quality, stability and drug delivery potential. This design provided a robust statistical framework to optimize component ratios and develop a stable, efficient nanoemulsion (Cornell, 2011).
2.7 Formulation of Nanoemulgel (NEG)
Step 01- Preparation of Nanoemulsion(NE): Tofacitinib citrate was incorporated into a nanoemulsion using a low-energy emulsification technique. The drug (0.1% w/w) was dissolved in a pre-optimized oil–surfactant–co-surfactant mixture selected from the nanoemulsion region of the pseudo-ternary phase diagram. The oil phase was prepared by mixing the oil, surfactant and co-surfactant under magnetic stirring until a homogeneous blend was obtained. Distilled water was then added slowly to the oil phase at room temperature without the application of heat or high-shear forces. The aqueous phase was introduced dropwise at a controlled rate (approximately 50–60 drops per minute) under continuous stirring at 250–300 rpm. Addition of water was continued until a clear and transparent nanoemulsion was formed, indicating successful emulsification. The low-energy method was selected to ensure drug stability, minimize mechanical stress and support scalability and energy-efficient processing.
Step 02- Incorporation of Nanoemulsion(NE) into Gel base: The gel base was prepared by dispersing Carbopol 934 (0.5% w/w) in purified water under continuous stirring using an overhead stirrer at 2000 rpm for 5 min. Methyl paraben and propyl paraben were incorporated at permissible concentrations by dissolving them in the aqueous phase prior to gel formation. The dispersion was neutralized with triethanolamine to obtain the desired pH and gel consistency suitable for topical application. The optimized drug-loaded nanoemulsion was then incorporated into the gel base in a 1:1 ratio. Mixing was carried out gently using a magnetic stirrer until a smooth and homogeneous nanoemulgel was obtained (Kumar et al; Jamadra, 2017; Singh, 2005).
2.8 Evaluation of Nanoemulsion (NE) Formulation:
2.8.1 Organoleptic Characteristics: The nanoemulgel was assessed visually for appearance, colour, odour, texture and clarity to ensure acceptable aesthetic and sensory characteristics for topical use.
2.8.2 Particle Size and Polydispersity Index (PDI): The particle size and PDI of the nanoemulsion were measured using Dynamic Light Scattering (DLS) with a Zetasizer Nano ZS (Malvern Instruments, UK). Prior to analysis, samples were diluted tenfold with distilled water to minimize multiple scattering effects. Measurements were conducted at 25 °C in triplicate (Sharma, 1997).
2.8.3 Zeta Potential: Zeta potential of the nanoemulsion was measured using a Zetasizer to assess surface charge and colloidal stability. Diluted samples were analysed at 25 °C, with values ≥ ±30 mV considered indicative of adequate electrostatic stability (Trotta, 2003).
2.8.4 Entrapment Efficiency: Entrapment efficiency was determined using an indirect centrifugation method. It is assessed by centrifuging the nanoemulsion at 10,000 rpm for 30 minutes to separate the unentrapped drug. The supernatant was collected and analysed using UV- VISIBLE-visible spectrophotometry at the λmax of Tofacitinib Citrate.
Entrapment efficiency was calculated using the formula:
% Entrapment efficiency = Total drug – unentrapped drug x 100
Total drug
This parameter reflects the proportion of drug successfully encapsulated within the nanoemulsion droplets, which is critical for therapeutic performance (Jain, 2016).
2.8.5 Drug Content: Drug content was determined by dissolving a known quantity of nanoemulgel in methanol, followed by sonication to ensure complete drug release. The solution was filtered and analysed spectrophotometrically at the 286 nm. The concentration was calculated using a standard calibration curve and drug content was expressed as a percentage of the theoretical amount (Garg et al, 2022). This confirms uniform drug distribution throughout the formulation. It is calculated using formula;
% Drug Content = Actual drug Content x 100
Theoretical loading
2.8.6 Thermodynamic Stability Study: Thermodynamic stability was evaluated through heating-cooling cycles to assess the formulation’s resistance to temperature stress. The nanoemulsion was subjected to three cycles, each consisting of storage at 4 °C and 45 °C for 48 hours. After each cycle, formulations were inspected visually for signs of phase separation, turbidity, creaming, or cracking. Formulations that remained clear and homogeneous were considered thermodynamically stable and suitable for further development (Ghogare, 2022).
2.8.7 Scanning Electron Microscopy (SEM): Surface morphology and droplet shape of the nanoemulsion and nanoemulgel were examined using Scanning Electron Microscopy (SEM). A small amount of sample was mounted on an aluminium stub, air-dried and coated with a thin layer of gold using a sputter coater. The sample was then observed under SEM at appropriate magnifications. SEM images provided visual confirmation of spherical droplets with smooth surfaces and uniform distribution, supporting the physical characterization of the nanoemulsion (Bhardwaj, 2014).
2.8.8 Percent Transmittance (%T): The optical clarity of the optimized nanoemulsion was evaluated by measuring percent transmittance (%T) using a UV- VISIBLE-visible spectrophotometer. A small aliquot of the nanoemulsion was diluted appropriately with distilled water and scanned at 650 nm, a wavelength commonly used to assess turbidity and light scattering. A high %T value (typically above 90%) indicates a transparent system with uniformly dispersed droplets in the nanometre range, confirming successful emulsification and physical stability. This parameter was particularly useful for distinguishing nanoemulsions from coarse emulsions, which exhibit lower transmittance due to larger droplet sizes and increased light scattering (Nayak, 2010).
2.9 Evaluation of Nanoemulgel (NEG) loaded with optimized Nanoemulsion:
2.9.1 Homogeneity: The emulgel formulations were visually examined for uniformity, smooth texture and absence of lumps or phase separation to confirm proper integration of the gel and emulsion phases
2.9.2 pH Measurement: pH of the formulation was determined using digital pH meter. pH meter electrode was washed by distilled water and then dipped into the formulation to measure pH and this process was performed in triplicate.
2.9.3 Spreadability Test: A 0.5 g sample of formulation was placed between two standard-sized glass slides and left undisturbed for approximately 5 minutes, allowing the material to spread naturally until no further increase in diameter was observed. The diameter of the resulting spread circle was measured in centimeters and used as an indicator of spreadability. The values reported represent the mean of three independent measurements (Basha, 2011).
2.9.4 Viscosity: Viscosity was measured using a Brookfield viscometer equipped with a T-bar spindle and Helipath stand at ±37 °C. Readings were recorded at various spindle speeds (50rpm) to evaluate the rheological behaviour of the emulgel. Viscosity affects drug release, retention time and spreadability (Patel 2011).
2.9.5 Drug Content: Drug content was determined by dissolving 1 g of emulgel in 15 ml of methanol. The mixture was vortexed for 5 minutes at 5000 rpm and sonicated for 15 minutes to ensure complete solubilization. After appropriate dilution, the absorbance was measured at 286 nm using a UV- VISIBLE-visible spectrophotometer (UV- VISIBLE-1800, Shimadzu, Japan), with methanol as the blank. Drug concentration was calculated using a standard calibration curve (Ramesh, 2010).
2.9.6 In Vitro Drug Release Study: In vitro diffusion studies were performed using a modified USP Dissolution Apparatus II. This approach was selected to simulate topical drug diffusion through a semipermeable barrier under controlled conditions.
Membrane Preparation: A fresh egg membrane was used as the semipermeable barrier due to its natural porosity and compatibility with topical formulations. The membrane was carefully separated from the egg shell, thoroughly washed with distilled water to remove residual albumin and soaked overnight in 2M hydrochloric acid to ensure uniform hydration and pliability.
Sample Holder Assembly: A cylindrical glass tube, approximately 5 cm in length and 1.5 cm in diameter, was used as the sample holder. The nanoemulgel formulation equivalent to 2 mg drug was loaded into the tube and one end was sealed with the prepared egg membrane. The membrane was secured using non-reactive thread to prevent leakage and ensure tight sealing. The tube was then vertically tied to the paddle shaft of the dissolution apparatus, with the membrane end facing downward and immersed upto 1 cm in the dissolution medium.
Diffusion Conditions: The diffusion medium consisted of 100 ml of phosphate buffer at pH 6.8, maintained at 37 ± 0.5°C to mimic physiological conditions. The paddle rotation speed was set at 75 rpm. Samples were withdrawn at predetermined intervals and analysed spectrophotometrically at 286 nm. The release profile was used to assess the rate and extent of drug diffusion from the emulgel matrix (Dash S et al, 2010).
2.9.7 Drug Release Kinetics: To analyse the in vitro drug release behaviour, various mathematical models were employed to assess the release kinetics. The zero-order model (Equation 1) describes a system in which the drug is released at a constant rate, independent of its concentration. Conversely, the first-order model (Equation 2) illustrates a release pattern where the rate is proportional to the concentration of the drug remaining in the formulation. The Higuchi model (Equation 3) explains drug release from an insoluble matrix, where the release follows a diffusion-controlled mechanism and is proportional to the square root of time, aligning with Fick’s law of diffusion. The Korsmeyer-Peppas model (Equation 4) is used to characterize the drug release mechanism from polymer-based systems by establishing a relationship between the fraction of drug released and time.
Zero order kinetics:
C = k0t (1)
where, C is the concentration of drug at time t, t is the time and k0 is zero-order rate constant expressed in units of concentration/time
First order kinetics:
Log C0 − Log C = k1t/2.303 (2)
where, C0 is the initial concentration of drug and k1 is the first order rate constant.
Higuchi model:
C = KH √ t (3)
where, KH is the constant reflecting the design variables of the system.
Korsmeyer-Peppas model:
Mt/M∞ = KKPtn (4)
Where, Mt/M∞ is the fraction of drug released at time t, KKP is the rate constant and n is the release exponent.
The data obtained is plotted between log time and log percentage cumulative drug release.
2.9.8. In vitro Permeability study:
Steady-State Flux: Steady‑state flux is the constant rate at which drug passes through a membrane or is released from a formulation per unit area once steady conditions are reached. Experimentally in in vitro release or permeation tests it is the slope of the linear portion of cumulative amount versus time divided by the exposed area, expressed as mass per area per time.
Steady-state flux = Slope / Area
Permeability Coefficient: Permeability coefficient quantifies how fast a drug crosses a barrier (membrane or tissue) per unit concentration difference and area; experimentally the apparent permeability in in vitro study is calculated from the steady flux by dose, expressed as cm/s or cm/hr.
Permeability Coefficient = Steady-state flux / Dose
2.10 Stability Studies
The optimized tofacitinib citrate nanoemulgel was subjected to accelerated stability testing to evaluate its physical and chemical stability. The formulation was filled into tightly sealed glass vials and stored under accelerated conditions (40 ± 2 °C / 75 ± 5% RH) for 30 days. Controlled humidity was maintained using a saturated sodium chloride solution.
Samples were withdrawn at 0, 7, 15 and 30 days and evaluated for physical appearance, phase separation and drug content. The study was performed to assess formulation stability and to support storage condition and shelf-life recommendations (ICH guidelines, 2003).
TCN was confirmed as a white to off-white powder with a melting point of 198°C which is further confirmed by DSC, consistent with literature values and indicative of its purity. Its solubility profile revealed high solubility in DMSO and methanol, moderate solubility in phosphate buffer (pH 6.8) and poor solubility in ethanol.
Among screened oils, eucalyptus oil exhibited the highest solubility for TCN (28.64 µg/mL) (Figure 1), followed by peppermint and oleic acid. Tween 80 emerged as the most effective surfactant (25.76 µg/mL) (Figure 2), while Transcutol®-P showed superior solubilizing capacity among co-surfactants (33.12 µg/mL) (Figure 3). These selections were guided by solubility and emulsification efficiency, ensuring optimal drug loading and nanoemulsion stability.
Tofacitinib citrate showed the highest solubility in eucalyptus oil, attributed to terpene components such as cineole that enable favorable lipophilic and hydrogen-bonding interactions. Other oils demonstrated lower solubility due to higher viscosity, esterified structures, or long-chain fatty acids that limit drug–excipient interactions. Tween 80 provided greater solubilization than Tween 20 and poloxamer, likely due to its longer oleate chain and improved micellar incorporation. Transcutol® P exhibited superior solubility compared to PEG 400 because of its amphiphilic nature and strong solvent capacity, whereas the higher hydrophilicity of PEG 400 restricted effective drug interaction.
The Smix ratio of 3:1 (Figure 4) demonstrated the highest transmittance (92.2%) and rapid emulsification (<1 min) without phase separation, indicating superior clarity and stability. Pseudo-ternary phase diagrams confirmed the existence of a broad nanoemulsion region, supporting formulation robustness. These findings were critical in defining the design space for Quality by Design (QbD) optimization (Table 7 & 9).
This ratio offered an optimal surfactant–co-surfactant balance, effectively reducing interfacial tension and enabling efficient droplet formation, which resulted in rapid emulsification and high transmittance indicative of small droplet size and good clarity.
A QbD approach was used to develop the TCN nanoemulgel for effective topical delivery and sustained release. The QTPP defined key targets, including clear appearance, efficient skin penetration and >60% drug release over 12 h (Table 10). CQAs such as particle size, PDI, zeta potential, viscosity and entrapment efficiency were identified, while FMEA highlighted the oil phase and surfactant system as high-risk factors affecting formulation performance (Table 11).
FMEA highlighted the oil phase and surfactant system as major risk factors affecting CQAs, with the aqueous phase and storage conditions being secondary. Oil selection influences viscosity, solubility, entrapment and stability, while surfactant type and Smix ratio control interfacial tension, droplet size, PDI, zeta potential and drug release. The aqueous phase mainly impacts pH and zeta potential, whereas storage conditions may induce instability. Accordingly, optimization prioritized oil screening, Smix optimization, aqueous phase control, droplet size regulation and targeted stability studies.
A TCN nanoemulsion was prepared using a low-energy method and optimized through a Simplex Lattice Mixture Design evaluating oil, Smix and water. Eucalyptus oil, Tween 80 and Transcutol®-P were selected and their effects on particle size, PDI, zeta potential and entrapment efficiency were optimized. The optimized nanoemulsion was incorporated into a Carbopol 934 gel to obtain the final nanoemulgel for topical rheumatoid arthritis treatment.
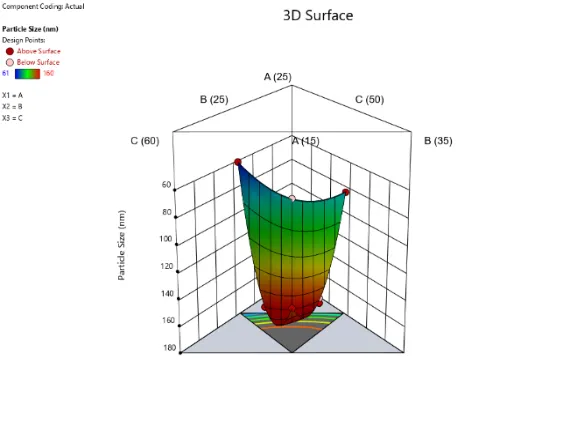
3.8.2.1 Particle size: The fitted mixture model predicted particle size as:
PS = −464.140*Oil + 154.340*Smix + 38.140*Water + 9.040*(Oil×Smix) + 6.400*(Oil×Water) + 2.720*(Smix×Water).
A negative oil coefficient indicates that increasing oil reduces particle size by improving solubilization and interfacial curvature, while excess Smix and water slightly increase size due to interfacial thickening and altered packing. Positive interaction terms suggest partial antagonism when components are combined. Minimum particle size is achieved in an oil-rich region with only sufficient Smix for stability, as indicated by response surface optimization. The response analysed by quadratic mixture design with model F = 532.40, p < 0.05, R² = 0.9992, Adj R² = 0.9974 indicating significant response. The actual and predicted values of particle size were correlated as shown in the figure 10.
3.8.2.2 Polydispersity index (PDI): The fitted mixture model predicted PDI as:
PDI = 1.45640*Oil + 0.73760*Smix − 0.57440*Water + small interaction terms.
A positive oil coefficient indicates that higher oil content broadens PDI due to formation of multiple droplet populations and incomplete interfacial coverage, while excess Smix also increases PDI because of micelle formation and uneven interfacial packing. In contrast, increased water content narrows the size distribution by diluting free surfactant and improving droplet uniformity. Interaction effects were minimal, indicating no strong synergistic influence within the studied range. The response analysed by quadratic mixture design with model F = 265.26, p < 0.05, R² = 0.9985, Adj R² = 0.9947 indicating significant response. The actual and predicted values of Polydispersity index were correlated as shown in the figure 12.
3.8.2.3 Zeta potential: The fitted mixture model predicted Zeta potential as:
Zeta (mV) = 34.82250*Oil − 37.72750*Smix − 22.07250*Water + small interactions.
A positive oil coefficient indicates that increasing oil content shifts zeta potential toward less negative values by modifying interfacial composition and masking charged groups. In contrast, higher Smix and water levels drive zeta potential more negative due to increased surfactant adsorption, ionization and double-layer formation at the interface. Interaction effects were minor, suggesting only limited modulation of these primary trends through combined component changes. The response analysed by quadratic mixture design with model F = 10.11, p < 0.05, R² = 0.9309, Adj R² = 0.8388 indicating significant response. The actual and predicted values of zeta potential were correlated as shown in the figure 14.
3.8.2.4 Entrapment efficiency (%EE): The fitted mixture model predicted Zeta potential as:
%EE = 12.94467·Oil − 7.59800*Smix + 1.78867*Water − 0.52800*(Oil×Smix).
A positive oil coefficient indicates that higher oil content increases %EE by providing greater solubilization and lipid volume, while excess Smix reduces %EE by solubilizing drug in the continuous phase and promoting leakage. Increased water slightly improves EE by diluting free surfactant and enhancing interfacial packing. The negative Oil×Smix interaction shows that combined increases partially offset oil’s effect, limiting EE gains. The response analysed by quadratic mixture design with model F = 8.95, p < 0.05, R² = 0.8703, Adj R² = 0,7730 indicating significant response. The actual and predicted values of Entrapment efficiency were correlated as shown in the figure 16.
Runs 4–6 (Oil ~20%, Smix 25–30%, Water 50–55%) define an optimal region yielding small PS (61–96 nm), low PDI (0.12–0.20), zeta −20 to −23 mV and high EE (84–87%). This composition balances droplet formation, stability and drug loading and should be refined via response surface optimization and experimental verification before scale-up.
SEM was used to study the surface morphology of the resulting optimized NPs Annulation. The SEM images of the optimized formulations were shown in the figure 19 & 20.
The formulation showed robust short‑term physical stability, no phase separation after three heating-cooling cycles (4°C↔45°C) or after 30 min centrifugation (3000 rpm) and no colour change on daily visual inspection. These results indicate strong interfacial stabilization and resistance to coalescence, longer‑term stability testing is recommended to confirm shelf life.
3.11 Regression analysis:
Desirability-based optimization identified ideal formulation settings for the target responses. Regression analysis confirmed that the selected factors significantly influence CQAs. The optimized TCN nanoemulsion prepared using model-predicted settings showed responses closely matching predictions, validating the model and confirming the factors’ combined impact on formulation performance.
The optimized formulation showed excellent agreement between predicted and observed CQAs (PS 146.3 nm, PDI 0.228, zeta −28.4 mV, EE 84.5%), validating the regression model and desirability-based optimization.
The TCN nanoemulsion was incorporated into 0.5% Carbopol 934 gel, producing a homogeneous, spreadable, shear-thinning and bioadhesive matrix that preserved droplet size and entrapment, ensuring sustained local release while minimizing systemic exposure.
3.15 Stability:
Under accelerated conditions (40 ± 2 °C / 75 ± 5% RH), OPZ NE remained physically and chemically stable for 30 days, with negligible changes in appearance, pH and drug content, confirming formulation robustness.
3.16 Updated Risk Assessment:
FMEA showed high-risk factors were mitigated through targeted oil and Smix selection, Carbopol tuning and strict process controls. These measures ensured consistent nano-sized globules (<200 nm), low PDI (<0.3), stable zeta potential (±30 mV), controlled viscosity and reproducible drug release, effectively reducing formulation and stability risks and supporting further development of OPZ-NEG.
REFERENCES
|
HOW TO CITE: Mohammad Noufal, Dr. Satheesha Babu B. K , Quality By Design Based Preparation and Evaluation of Topical Nanoemulgel Loaded with A Model Drug for Management of Rheumatoid Arthritis, Int. J. of Pharm. Sci., 2026, Vol 4, Issue 8, 4719-4751, https://doi.org/10.5281/zenodo.22144927
|
Tables
Table 1: Selected independent variables for optimization
|
COMPONENTS |
NAME |
UNITS |
MIN |
MAX |
|
A |
Amt of Oil |
% |
15 |
20 |
|
B |
Amt of Smix |
% |
25 |
30 |
|
C |
Amt of Water |
% |
50 |
55 |
|
Total = |
100.00 |
Table 2: Selected responses for optimization
|
RESPONSE |
NAME |
UNIT |
GOAL |
|
R1 |
Particle size |
nm |
Less than 200 nm |
|
R2 |
PDI |
- |
Less than 0.3 |
|
R3 |
Zeta potential |
mV |
+/- 30mV |
|
R4 |
Entrapment efficiency |
% |
More than 80% |
Table 3: Formulation table for the preparation of nanoemulsion suggested by Design Expert software
|
Run |
Amt of Oil |
Amt of Smix |
Amt of Water |
|
% |
% |
% |
|
|
NE-1 |
17.5 |
30 |
52.5 |
|
NE-2 |
17.5 |
30 |
52.5 |
|
NE-3 |
15 |
30 |
55 |
|
NE-4 |
20 |
27.5 |
52.5 |
|
NE-5 |
20 |
27.5 |
52.5 |
|
NE-6 |
20 |
30 |
50 |
|
NE-7 |
17.5 |
27.5 |
55 |
|
NE-8 |
20 |
25 |
55 |
Table 4: Solubility data for screening of oils
|
Sl No |
Oil |
Absorbance at 286nm |
Concentration (mcg/ml) |
|
1 |
Olive |
0.234 |
3.44 |
|
2 |
Isopropyl myristate |
0.113 |
1.41 |
|
3 |
Eucalyptus |
1.733 |
28.64 |
|
4 |
Oleic Acid |
0.934 |
15.21 |
|
5 |
Peppermint |
1.213 |
19.90 |
Table 5: Solubility data for screening of surfactants
|
Sl No |
Surfactants |
Absorbance at 286nm |
Concentration (mcg/ml) |
|
1 |
Tween 20 |
1.3 |
21.36 |
|
2 |
Tween 80 |
1.562 |
25.76 |
|
3 |
Poloxamer-188 |
0.834 |
13.53 |
Table 6: Solubility data for screening of co-surfactants
|
Sl No |
Co-Surfactants |
Absorbance at 286nm |
Concentration (mcg/ml) |
|
1 |
Transcutol®-P |
2 |
33.12 |
|
2 |
PEG-400 |
1.7 |
28.08 |
Table 7: Emulsification efficiency test data
|
Sl no |
Smix Ratio |
Parameters |
||
|
%Transmittance |
Emulsification Time |
Phase separation |
||
|
1 |
01:02 |
10 |
Less than 1 Min |
Yes |
|
2 |
01:01 |
75.4 |
Less than 1 Min |
No |
|
3 |
02:01 |
89.9 |
Less than 1 Min |
No |
|
4 |
2.5:01 |
91 |
Less than 1 Min |
No |
|
5 |
03:01 |
92.2 |
Less than 1 Min |
No |
Table 8: FT-IR spectra data
|
Functional Group |
Expected Range |
Pure TCN |
Drug + Excipient Mixture |
|
Hydrogen Bonding (O-H/ N-H) |
3200 - 3400 |
3350 |
3356 |
|
Aliphatic (C-H) stretch |
2850 - 2960 |
2920 |
2860 |
|
Carbonyl (C=O) |
1650 - 1750 |
1747 |
1726 |
|
Aromatic (C=C) |
1580 - 1600 |
1582 |
1594 |
|
Aliphatic Bending (CH2) |
1450 - 1460 |
1458 |
1458 |
|
Carboxylic Acid (COO) |
1240 - 1260 |
1257 |
1249 |
Table 9: Aqueous titration data
|
AQUEOUS TITRATION (SMIX in the Ratio 3:1) |
|||||||||
|
Oil: SMIX |
Smix |
Oil |
Water Added till Phase Change |
Total |
%Smix |
%Oil |
%Water |
Appearance |
|
|
02:08 |
0.4 |
1.6 |
0.7 |
2.7 |
14.8 |
59.3 |
25.9 |
Milky white |
|
|
03:07 |
0.6 |
1.4 |
1.4 |
3.4 |
17.6 |
41.2 |
41.2 |
Milky white |
|
|
04:06 |
0.8 |
1.2 |
2 |
4 |
20.0 |
30.0 |
50.0 |
Milky white |
|
|
05:05 |
1 |
1 |
2.8 |
4.8 |
20.8 |
20.8 |
58.3 |
Bluish Transparent |
|
|
06:04 |
1.2 |
0.8 |
3.3 |
5.3 |
22.6 |
15.1 |
62.3 |
Transparent |
|
|
07:03 |
1.4 |
0.6 |
4.7 |
6.7 |
20.9 |
9.0 |
70.1 |
Transparent |
|
|
08:02 |
1.6 |
0.4 |
4.8 |
6.8 |
23.5 |
5.9 |
70.6 |
Transparent |
|
|
09:01 |
1.8 |
0.2 |
2.8 |
4.8 |
37.5 |
4.2 |
58.3 |
Transparent |
|
Table 10: QTPP and CQA of TCN Nanoemulgel
|
QUALITY TARGETED PTODUCT PROFILE (QTPP) OF TCN NANO-EMULGEL |
|||
|
QTPP ELEMENTS |
TARGET |
JUSTIFICATION |
|
|
Dosage Form |
O/W nano-emulsion (Later incorporated into gel base) |
Enables solubilization & penetration of TCN for skin delivery |
|
|
Route Of Administration |
Topical |
Avoids systemic side effects seen with oral TCN |
|
|
Drug Release Profile |
Sustained release more than 80% over 12 Hrs |
Maintains therapeutic levels and reduces dosing frequency |
|
|
Skin Penetration |
Efficient permeation into inflamed joints |
Critical for localized action in RA & nano-size enhances penetration |
|
|
Therapeutic Indication |
Rheumatoid arthritis management |
Targets inflamed joints directly, improving efficacy and reducing toxicity |
|
|
Appearance |
Clear to Translucent, Low viscous & no phase separation |
Indicates nano-size range and patient acceptability |
|
|
Stability |
Thermodynamically Stable under ambient & accelerated condition |
Ensures shelf life and consistent performance |
|
|
Critical Quality Attributes |
Viscosity |
Less viscous & Easily spreadable |
Facilitates topical application & Patient compliance |
|
pH |
Skin compatible range (5-7) |
Prevents skin irritation and stability |
|
|
Particle Size |
Less than 200nm |
Enhances skin permeation and physical stability |
|
|
Zeta Potential |
+/- 30mV |
Prevents coalescence and phase separation |
|
|
Polydispersity Index (PDI) |
Less than 0.3 |
Ensures uniformity and reproducibility of formulation |
|
|
Emulsification Efficiency |
% Transmittance NLT 80% |
Ensures physical stability and aesthetic formulation |
|
|
Entrapment Efficiency |
High (More than 80%) |
Indicates effective drug loading and release control |
|
|
Drug Content |
Accurate dosing (+/- 5%) |
Ensures therapeutic consistency and regulatory compliance |
|
|
Invitro Drug Release |
Sustained release more than 60% over 12 Hrs |
Guides formulation tuning and therapeutic performance |
|
Table 11: Initial Risk Assessment of formulation variables
|
Initial Risk Assessment for Formulation Variables (FMEA) |
||||
|
Drug Product CQA |
Formulation Variables |
|||
|
Oil Phase |
Surfactant Mixture |
Aqueous Phase |
Storage Condition |
|
|
Viscosity |
High |
High |
Medium |
Low |
|
pH |
Low |
Medium |
Medium |
Low |
|
Particle Size |
Medium |
High |
Low |
Low |
|
Zeta Potential |
Medium |
High |
High |
Medium |
|
Polydispersity Index (PDI) |
Medium |
High |
Medium |
Low |
|
Entrapment Efficiency |
High |
High |
Low |
Low |
|
Invitro Drug Release |
High |
High |
Medium |
Medium |
|
Physical Stability |
High |
High |
Low |
Medium |
Table 12: Justification for Initial Risk Assessment
|
INFLUENCED CQAs |
FORMULATION VARIABLE |
RISK PRIORITY |
JUSTIFICATION |
|
|
Viscosity |
Oil Phase |
High |
Oil type and amount viscosity influence rheology and flow resistance (High-viscosity oils increase viscosity and low-viscosity oils yield lighter gels). The risk is high. |
|
|
Surfactant Mixture |
High |
Surfactants reduce interfacial tension and interact with gel matrix (Non-ionic surfactants may increase viscosity via steric stabilization, ionic surfactants alter electrostatic interactions). The risk is high. |
||
|
Aqueous Phase |
Medium |
Water content dilutes gel matrix, only higher water content reduces viscosity. The risk is medium. |
||
|
Storage Condition |
Low |
Elevated temperature reduces viscosity. The risk is low. |
||
|
pH |
Oil Phase |
Low |
Most pharmaceutical oils are chemically neutral and do not significantly alter pH. The risk is low. |
|
|
Surfactant Mixture |
Medium |
Surfactants types can influence pH through ionization or interaction with buffer systems. Selection of non-ionic surfactant and suitable mixture ratio can manage this. The risk is medium. |
||
|
Aqueous Phase |
Medium |
The aqueous phase is the primary carrier of pH. Buffer selection, ionic strength and water quality directly impact pH. The risk is medium. |
||
|
Storage Condition |
Low |
Under controlled conditions of temperature and light, nanoemulgels show good pH stability over |
||
|
Particle Size |
Oil Phase |
Medium |
Oil type and concentration influence droplet formation. Oils with high viscosity or poor emulsification may hinder size reduction. However, with proper selection of oil, it is manageable. The risk is medium. |
|
|
Surfactant Mixture |
High |
Surfactants are critical for reducing interfacial tension and stabilizing droplets. Improper Smix ratio, surfactant type, or concentration can lead to coalescence, polydispersity, or phase separation. The risk is high. |
||
|
Aqueous Phase |
Low |
Typically composed of purified water or buffer, the aqueous phase has minimal direct impact on particle size. The risk is low. |
||
|
Storage Condition |
Low |
Same justification as mentioned for pH. |
||
|
Zeta Potential |
Oil Phase |
Medium |
Oils generally have low inherent charge, when oils interact with surfactants or co-surfactants, potentially |
|
|
Surfactant Mixture |
High |
Surfactants directly affect zeta potential by forming charged layers around droplets. Improper Smix ratio |
||
|
Aqueous Phase |
High |
The aqueous phase determines ionic strength and pH, both of which critically affect zeta potential. Water purity can alter the electrical double layer around droplets. It has direct role in electrostatic stabilization. The risk is high. |
||
|
Storage Condition |
Low |
Same justification as mentioned for pH. |
||
|
Polydispersity Index (PDI) |
Oil Phase |
Medium |
Same justification as mentioned for particle size. |
|
|
Surfactant Mixture |
High |
Same justification as mentioned for particle size. |
||
|
Aqueous Phase |
Medium |
The aqueous phase affects PDI indirectly through pH, ionic strength. The risk is medium. |
||
|
Storage Condition |
Low |
Same justification as mentioned for pH. |
||
|
Entrapment Efficiency |
Oil Phase |
High |
Entrapment efficiency is highly dependent on the drug’s solubility in the oil phase. Oils with poor solubilizing capacity may lead to low EE%. Selecting the right oil is critical for maximizing drug loading and retention within droplets. The risk is high. |
|
|
Surfactant Mixture |
High |
Surfactants stabilize the oil-water interface and influence drug partitioning. Improper Smix ratio may cause drug leakage into the aqueous phase or micelle formation, reducing EE%. High surfactant concentration can also compete with oil for drug solubilization. The risk is high. |
||
|
Aqueous Phase |
Low |
The aqueous phase has minimal direct impact on EE%, The risk is low. |
||
|
Storage Condition |
Low |
Same justification as mentioned for pH. |
||
|
Invitro Drug Release |
Oil Phase |
High |
The oil phase governs drug solubility and partitioning. If the oil has poor drug affinity or high viscosity, it can hinder diffusion from droplets into the gel matrix and across the skin barrier. The risk is high. |
|
|
Surfactant Mixture |
High |
Surfactants influence droplet size, interfacial tension and drug release kinetics. Improper Smix ratio may lead to micelle formation or drug leakage into the aqueous phase, altering release profiles. High surfactant levels can also disrupt skin lipids, affecting permeation. The risk is high. |
||
|
Aqueous Phase |
Medium |
Improper aqueous phase may reduce gel consistency or alter drug release kinetics. The risk is medium. |
||
|
Storage Condition |
Medium |
IVDR can be affected by temperature-induced changes in droplet size, viscosity and drug stability. The risk is medium. |
||
|
Physical Stability |
Oil Phase |
High |
The oil phase significantly affects droplet size, viscosity and zeta potential. Oils with poor compatibility or high viscosity can lead to phase separation, coalescence, or Ostwald ripening over time. The risk is high. |
|
|
Surfactant Mixture |
High |
Same justification as mentioned for particle size. |
||
|
Aqueous Phase |
Low |
The aqueous phase plays a minimal role in destabilization. It mainly serves as the continuous phase and contributes to gel consistency. The risk is low. |
||
|
Storage Condition |
Medium |
Nanoemulgels are generally stable under room temperature and elevated temperature (40 ± 2°C), but mechanical stress can reveal hidden instabilities, prolonged exposure to low temperatures (4 ± 2°C) may induce Ostwald ripening. The risk is medium. |
||
|
🔴 High Risk = Requires immediate optimization and control |
||||
Table 13: Physical characterization of NE
|
Formulation Code |
Colour |
Phase Separation |
Transmittance |
|
NE-1 |
Yellowish Transparent |
No |
92.5 |
|
NE-2 |
Yellowish Transparent |
No |
93 |
|
NE-3 |
Transparent |
No |
98 |
|
NE-4 |
Bluish Transparent |
No |
97 |
|
NE-5 |
Bluish Transparent |
No |
96 |
|
NE-6 |
Transparent |
No |
98 |
|
NE-7 |
Yellowish Transparent |
No |
98 |
|
NE-8 |
Yellowish Transparent |
No |
96 |
Table 14: Results obtained for Particle size, PDI, Zeta potential and %EE
|
Formulation Code |
Particle Size |
PDI |
Zeta Potential |
%EE |
|
NE-1 |
153 |
0.35 |
-31 |
83.64 |
|
NE-2 |
157 |
0.32 |
-35 |
84.04 |
|
NE-3 |
146 |
0.23 |
-27 |
85.32 |
|
NE-4 |
89 |
1 |
-17 |
81.99 |
|
NE-5 |
90 |
0.96 |
-15 |
84.34 |
|
NE-6 |
84 |
1 |
-22 |
80.71 |
|
NE-7 |
160 |
0.77 |
-13 |
83.44 |
|
NE-8 |
61 |
1 |
-19 |
87.07 |
Table 15: Actual VS predicted results
|
Variables |
Predicted |
Actual |
|
Particle Size |
150.5 nm |
145.3 nm |
|
PDI |
0.225 |
0.228 |
|
Zeta Potential |
-27.98 mV |
-28.4 mV |
|
%EE |
85.8% |
84.5% |
Table 16: Evaluation parameter for OPZ-NE
|
Sl no |
Evaluation Parameter |
Result |
|
1 |
Colour |
Yellowish Transparent |
|
2 |
Phase separation |
No |
|
3 |
% Transmittance |
98±2% |
|
4 |
Drug content |
97±1.5% |
Table 17: Thermodynamic stability data of OPZ-NE
|
Test |
Condition applied |
Duration |
Observation |
Result |
|
Heating- Cooling Cycles |
4°C ↔ 45°C alternating every 24 h |
3 cycles (6 days) |
No phase separation |
Stable |
|
Centrifugation test |
3000rpm |
30 min |
No phase separation |
Stable |
|
Visual inspection |
Ambient temperature |
Daily |
No colour change |
Stable |
Table 18: Evaluated parameters for OPZ-NE
|
PARAMETERS |
RESULTS |
|
Homogeneity |
Homogenous drug distribution |
|
pH |
5.6 ± 1.0 |
|
Spreadability |
7.8 ± 0.02 cm |
|
Viscosity |
1073 cps |
|
Drug content |
95.3 ± 0.5 % |
Table 19: In vitro drug release data of OPZ-NEG
|
USP Type-II Dissolution apparatus Using Egg Membrane |
|||
|
Sl No |
Time(Hr) |
CDR |
%CDR |
|
1 |
0 |
0.0000±0.0000 |
0.00±0.00 |
|
2 |
0.5 |
0.0006±0.0001 |
0.03±0.01 |
|
3 |
1 |
0.0193±0.0002 |
1.00±0.50 |
|
4 |
2 |
0.0997±0.0009 |
5.14±0.55 |
|
5 |
4 |
0.1849±0.0012 |
9.53±1.12 |
|
6 |
6 |
0.4402±0.0023 |
22.69±1.5 |
|
7 |
8 |
0.6688±0.0055 |
34.48±2.5 |
|
8 |
12 |
1.1665±0.0112 |
60.13±2.0 |
|
9 |
24 |
1.7172±0.0368 |
88.52±1.5 |
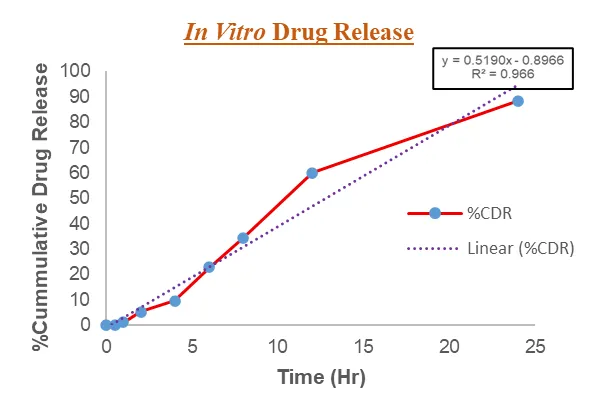
Table 20: In vitro drug release kinetics data
|
|
Zero order |
First order |
Higuchi |
Korsmeyer – Peppas |
|
KSlope |
0.5190 |
-0.0385 |
24.074 |
1.2348 |
|
R2 |
0.966 |
0.9539 |
0.9649 |
0.963 |
Table 21: In Vitro Permeability Study
|
Steady-State Flux |
165 µg/cm²/h |
|
Permeability Coefficient |
0.083cm/h |
Table 22: Stability studies data of OPZ-NE
|
Storage Condition: 40.0 ± 2.0 °C / 75.0 ± 5.0% RH |
||||
|
Sample Type |
Sampling Interval |
Appearance |
pH |
Drug Content |
|
OPZ-NE |
0 Day |
Translucent |
5.6±0.2 |
95.3±0.5% |
|
7 Day |
Translucent |
5.6±0.5 |
95.2±0.5% |
|
|
15 Day |
Translucent |
5.5±0.2 |
95.0±0.5% |
|
|
22 Day |
Translucent |
5.5±0.2 |
95.0±0.5% |
|
|
30 Day |
Translucent |
5.5±0.2 |
95.0±0.5% |
|
Table 23: Updated Risk Assessment of formulation variables
|
Updated Risk Assessment for Formulation Variables (FMEA) |
||||
|
Drug Product CQA |
Formulation Variables |
|||
|
Oil Phase |
Surfactant Mixture |
Aqueous Phase |
Storage Condition |
|
|
Viscosity |
Low |
Low |
Medium |
Low |
|
pH |
Low |
Medium |
Medium |
Low |
|
Particle Size |
Medium |
Low |
Low |
Low |
|
Zeta Potential |
Medium |
Low |
Low |
Medium |
|
Polydispersity Index (PDI) |
Medium |
Low |
Medium |
Low |
|
Entrapment Efficiency |
Low |
Low |
Low |
Low |
|
Invitro Drug Release |
Low |
Low |
Medium |
Medium |
|
Physical Stability |
Low |
Low |
Low |
Medium |
Table 24: Justification for updated Risk Assessment of formulation variables
|
FORMULATION VARIABLE |
INFLUENCED CQAs |
JUSTIFICATION |
|
Oil Phase |
Viscosity |
Rheological studies confirm that the viscosity is within the desired range for topical application. The risk is reduced from high to low. |
|
Entrapment Efficiency |
Entrapment efficiency is consistently high (>80%) , indicating robust drug loading and minimal leakage. The risk is reduced from high to low. |
|
|
IVDR |
IVDR profiles show sustained release with no burst effect, aligning with therapeutic goals for RA. The risk is reduced from high to low. |
|
|
Physical Stability |
Accelerated and real-time stability studies show no signs of phase separation, creaming, or degradation. The risk is reduced from high to low. |
|
|
Surfactant Mixture |
Viscosity |
Rheological studies confirm that the viscosity is within the desired range for topical application. The risk is reduced from high to low. |
|
Particle Size |
Achieved nano-range globule size (<200 nm). The risk is reduced from high to low. |
|
|
Zeta Potential |
Zeta potential values are within ±30 mV. The risk is reduced from high to low. |
|
|
Polydispersity Index (PDI) |
PDI < 0.3 confirms uniform particle distribution and homogeneity. The risk is reduced from high to low. |
|
|
Entrapment Efficiency |
High entrapment (>80%) achieved through optimized formulation. The risk is reduced from high to low. |
|
|
Invitro Drug Release |
Follows zero-order kinetics with sustained release profile. The risk is reduced from high to low. |
|
|
Physical Stability |
No phase separation, creaming, or degradation. The risk is reduced from high to low. |
|
|
Aqueous Phase |
Zeta Potential |
Zeta potential values are within ±30 mV. The risk is reduced from high to low. |
Figures
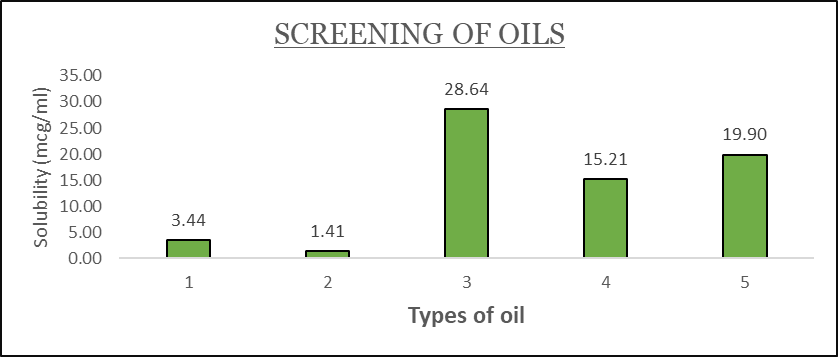
Figure 1: Solubility graph for screening of oils (1=Olive oil; 2=Isopropyl myristate; 3=Eucalyptus oil; 4=oleic acid; 5=Peppermint oil)
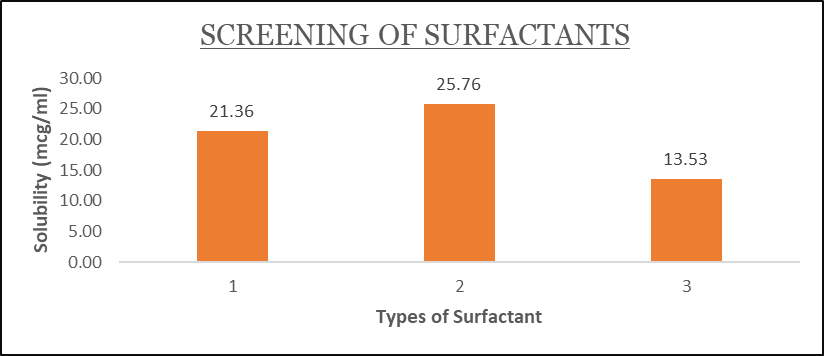
Figure 2: Solubility graph for screening of surfactants (1=Tween20; 2=Tween80; 3=Poloxamer-188)
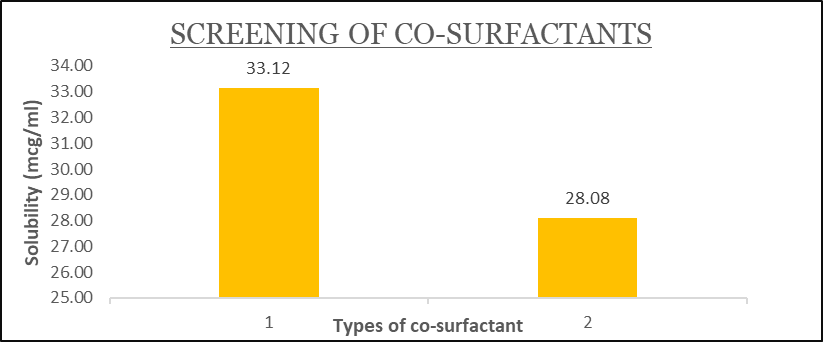
Figure 3: Solubility graph for screening of co-surfactants (1= Transcutol®-P; 2= PEG-400)
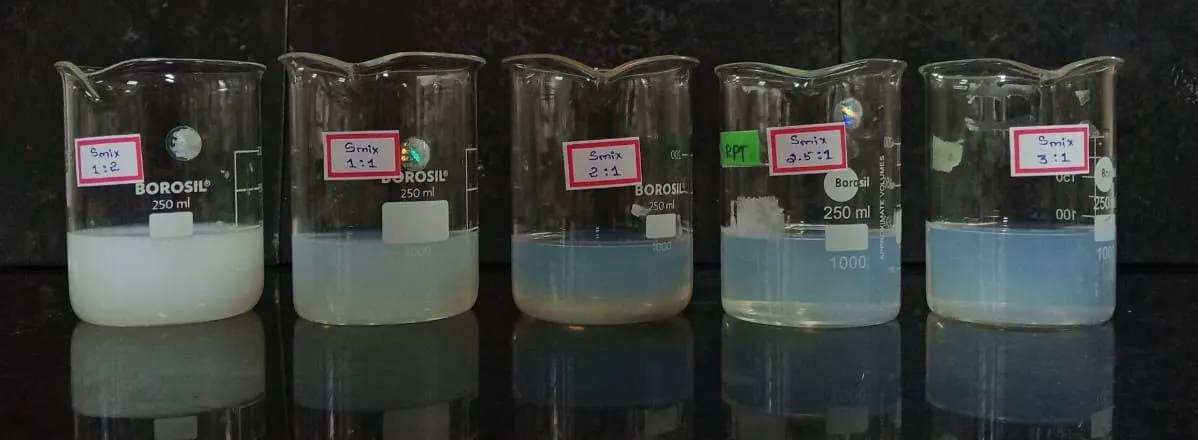
Figure 4: Pictorial Representation for Visual Inspection of different Smix ratio
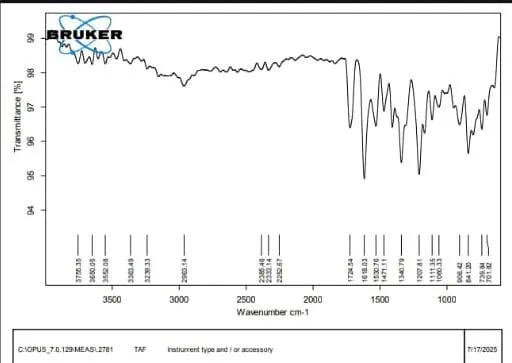
Figure 5: FTIR spectra of pure TCN
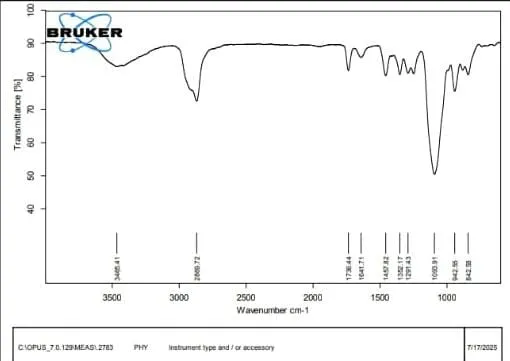
Figure 6: FTIR spectra of TCN + excipients
Figure 7: DSC thermograph of pure TCN drug
Figure 8: DSC thermograph of TCN + excipients
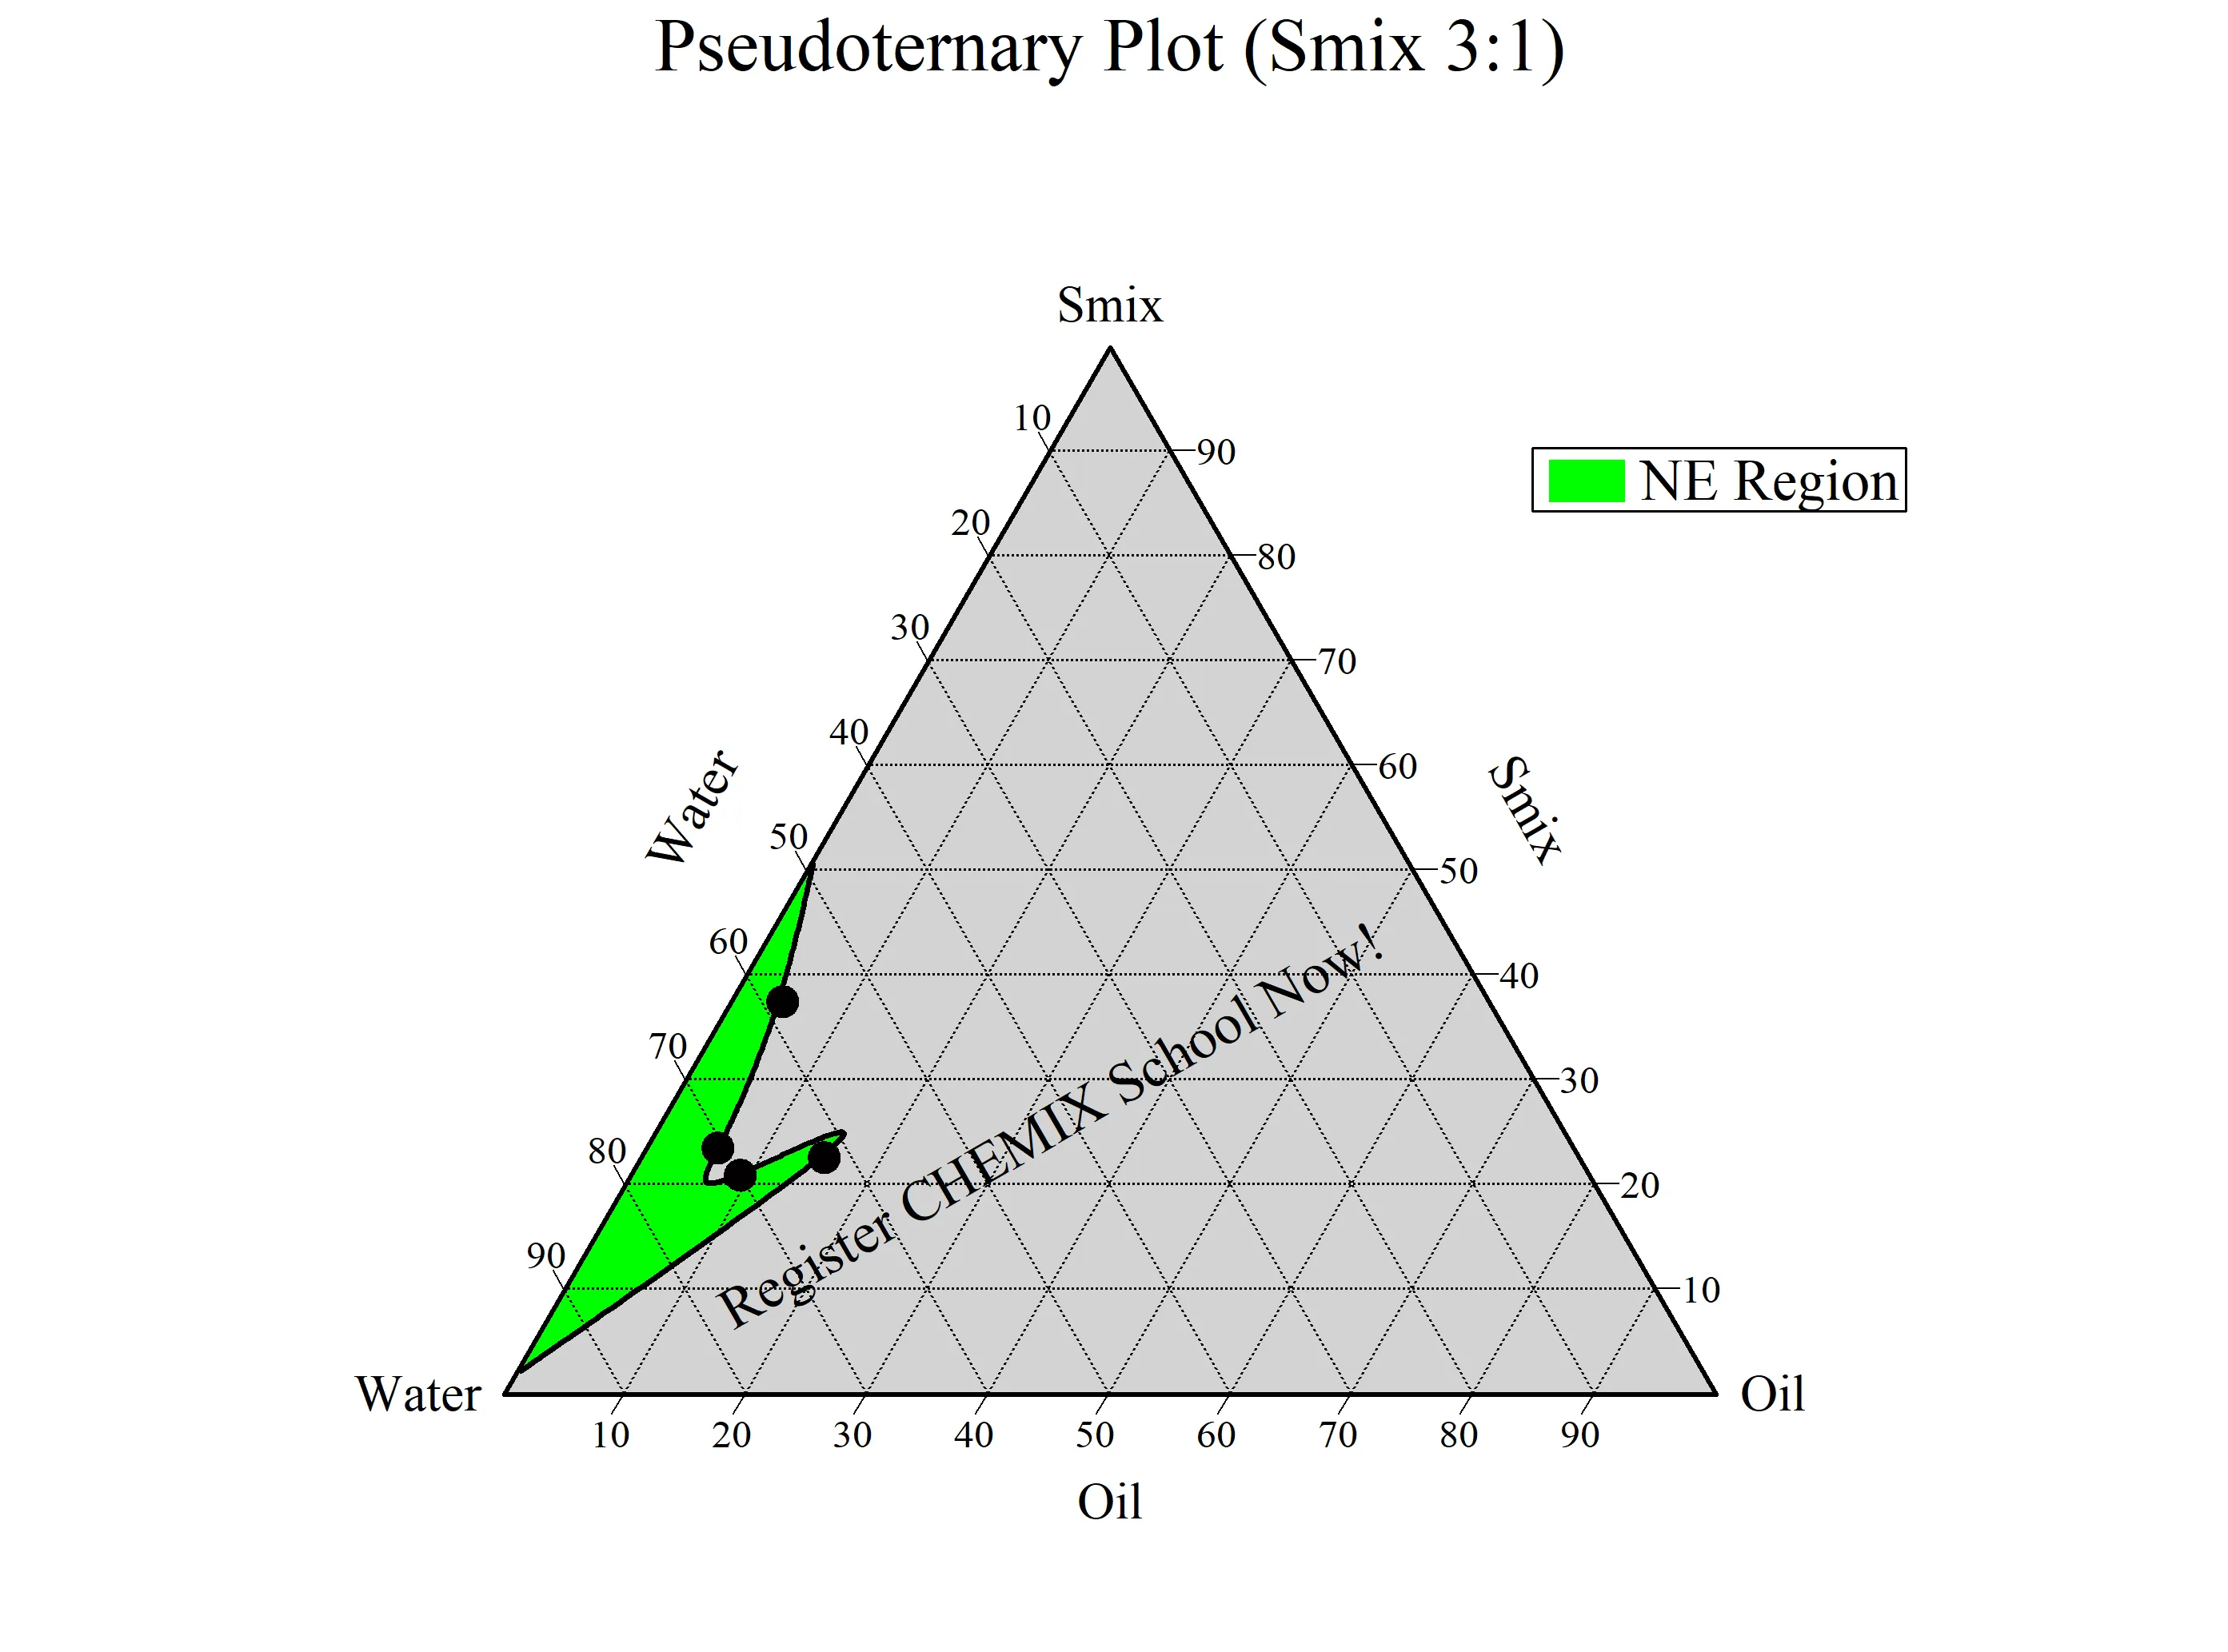
Figure 9: Pseudo ternary phase diagram
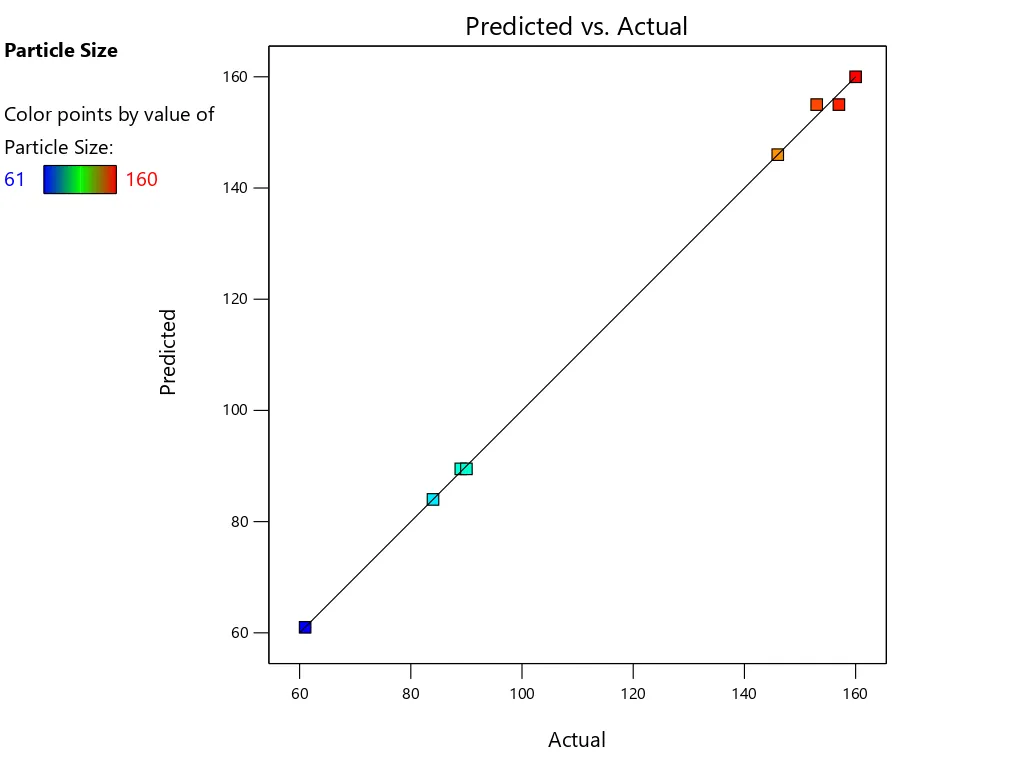
Figure 10: Actual vs Predicted correlation of Particle size
|
Figure 11: Model graph a) Contour and b) 3D surface of Particle size |
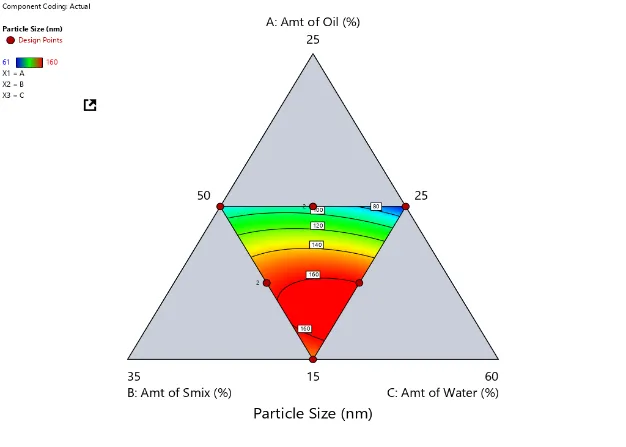
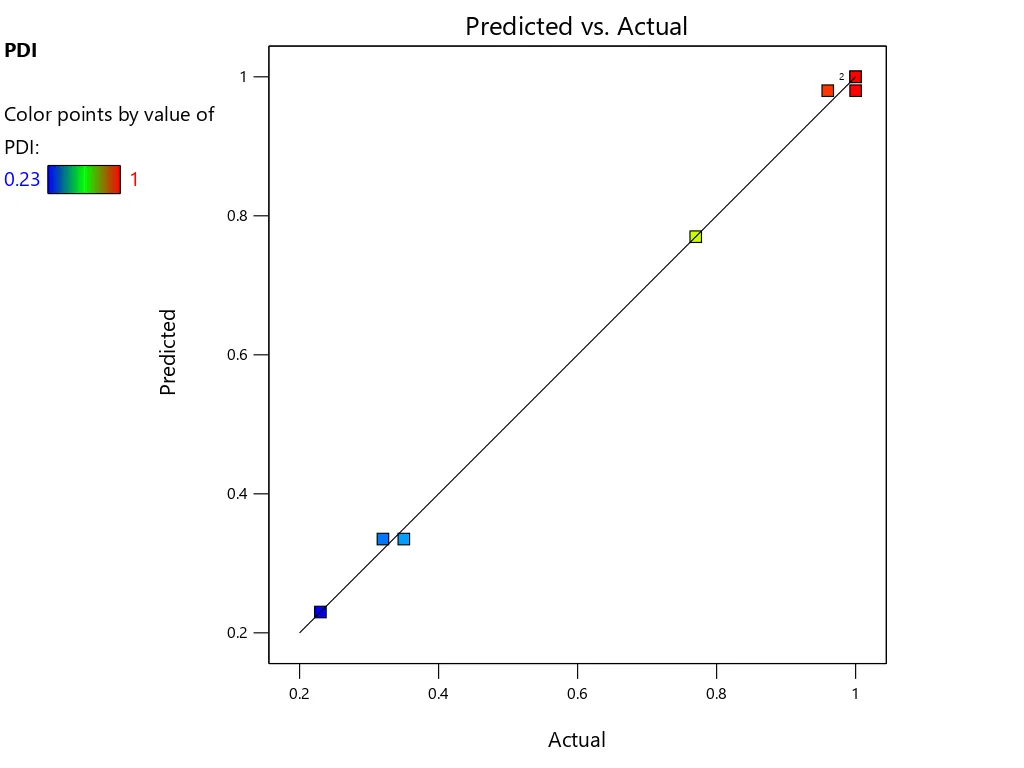
Figure 12: Actual vs Predicted correlation of PDI
|
Figure 13: Model graph a) Contour and b) 3D surface of PDI |
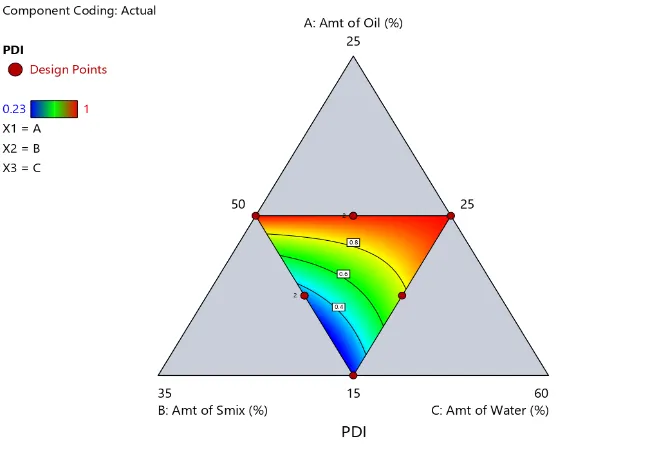
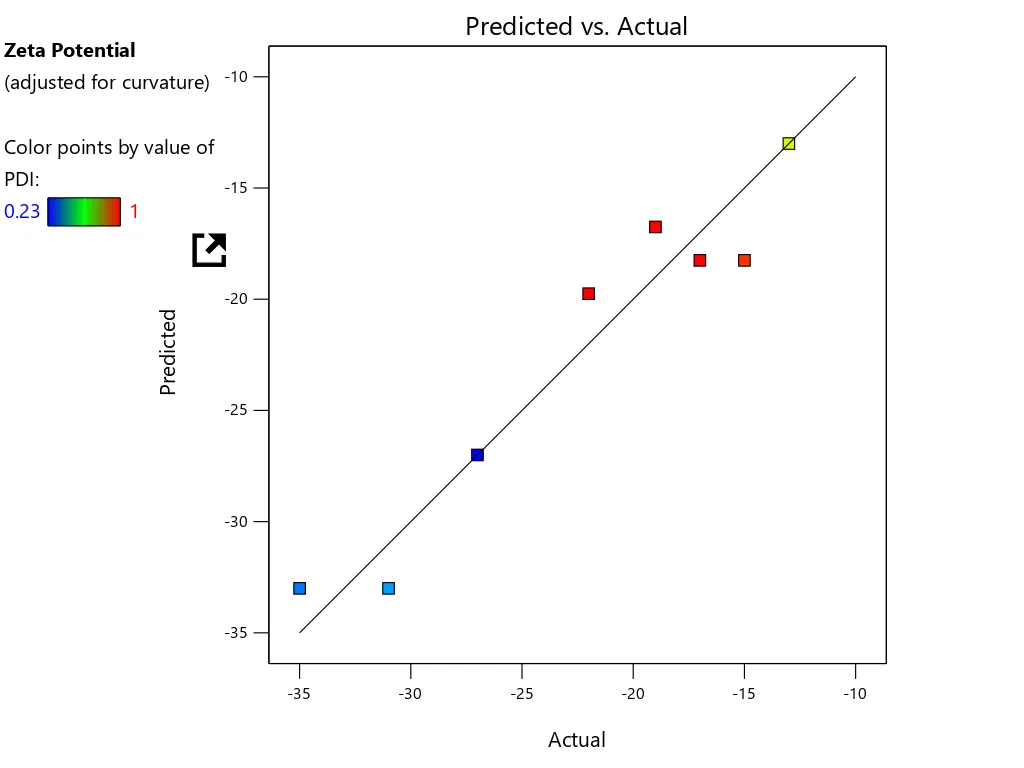
Figure 14: Actual vs Predicted correlation of Zeta potential
|
Figure 15: Model graph a) Contour and b) 3D surface of Zeta Potential |
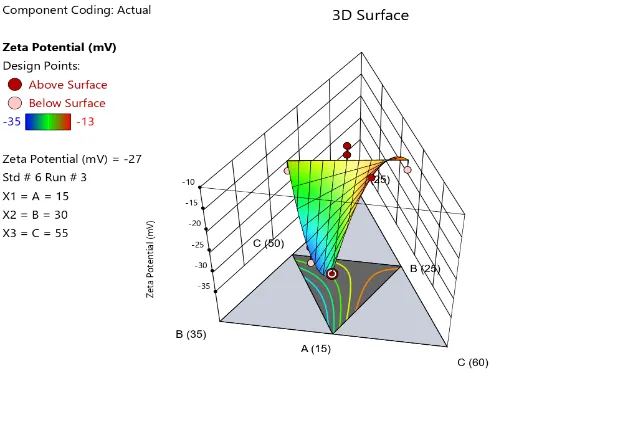
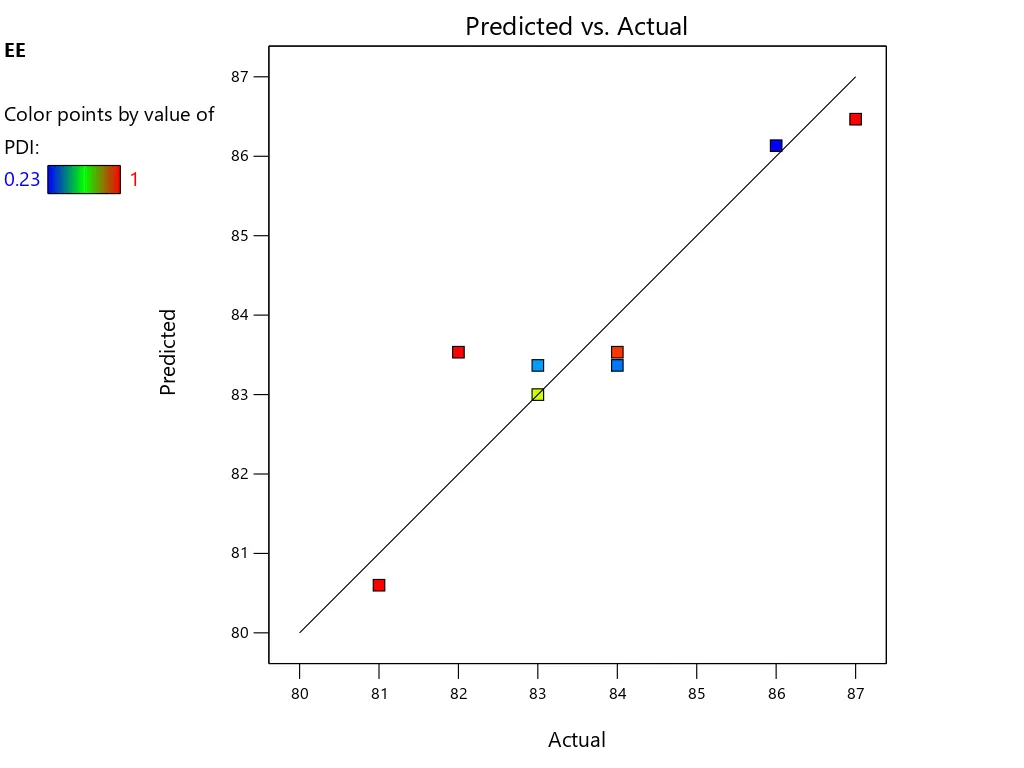
Figure 16: Actual vs Predicted correlation of %EE
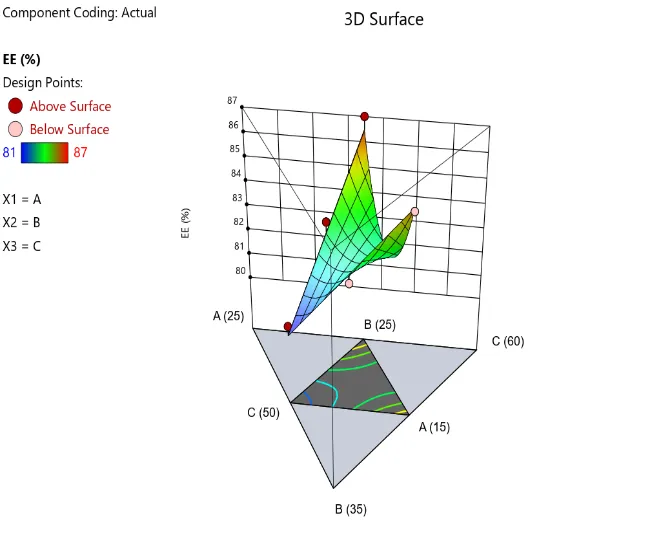
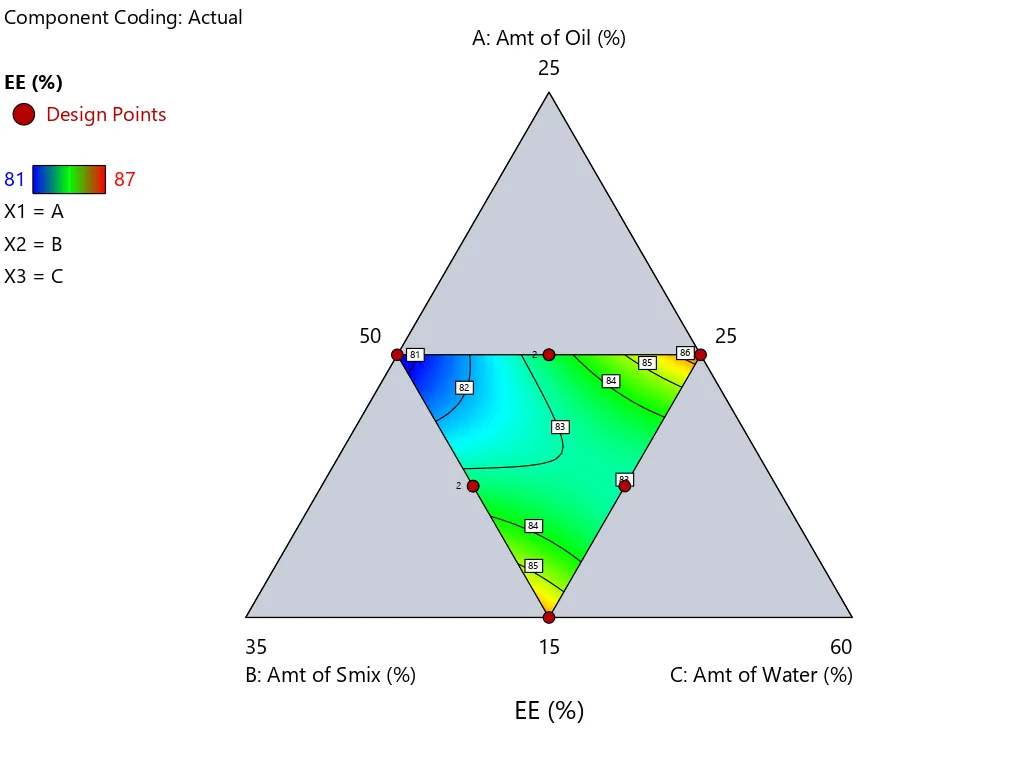
Figure 17: Model graph a) Contour and b) 3D surface of %EE
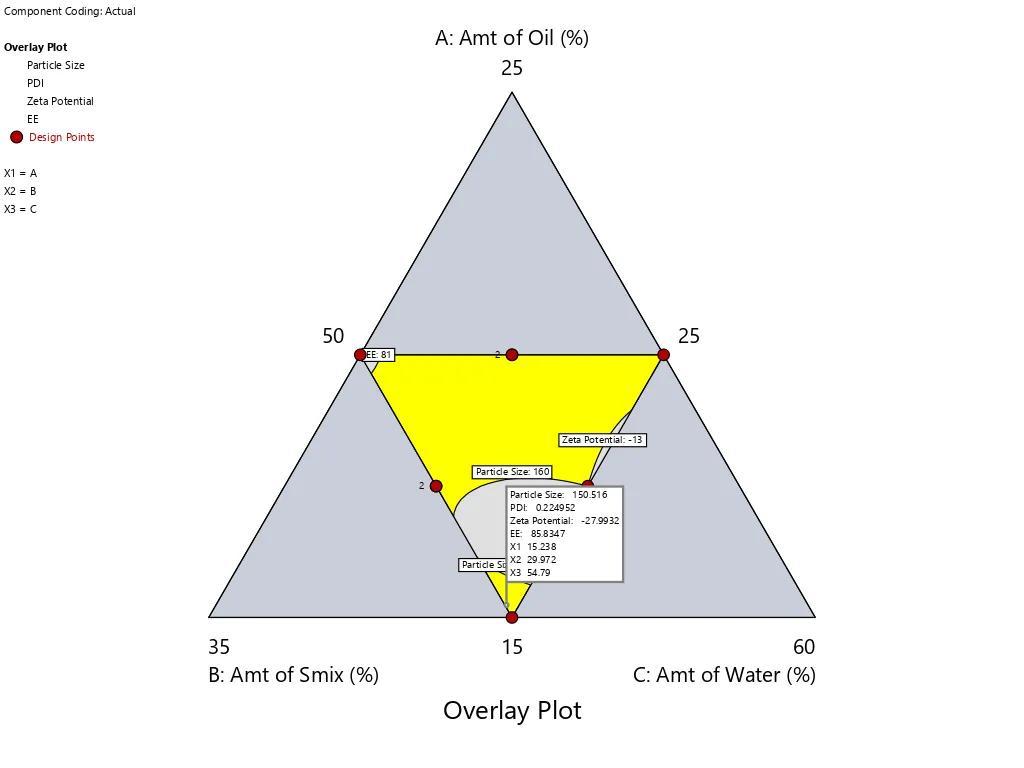
Figure 18: Overlay plot (Design Space)
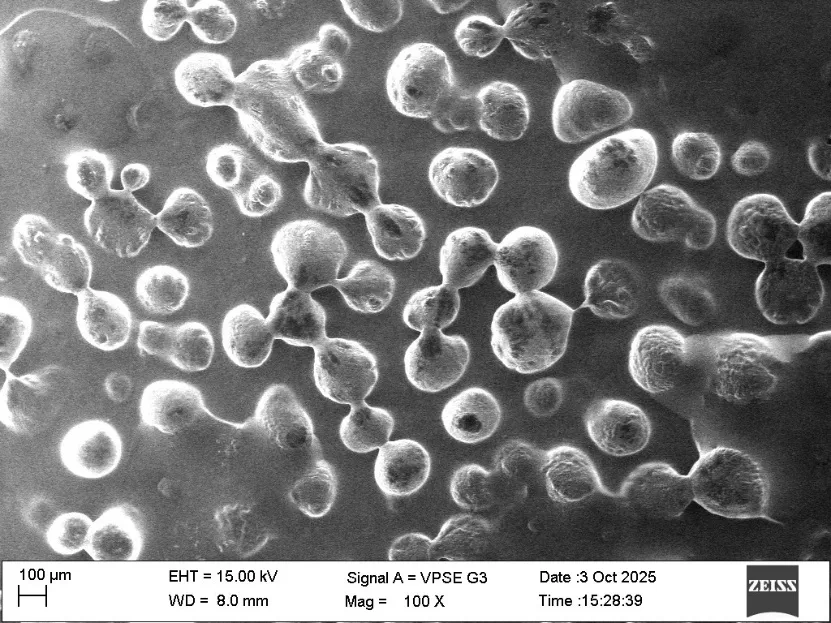
Figure 19: SEM image of OPZ-NEG
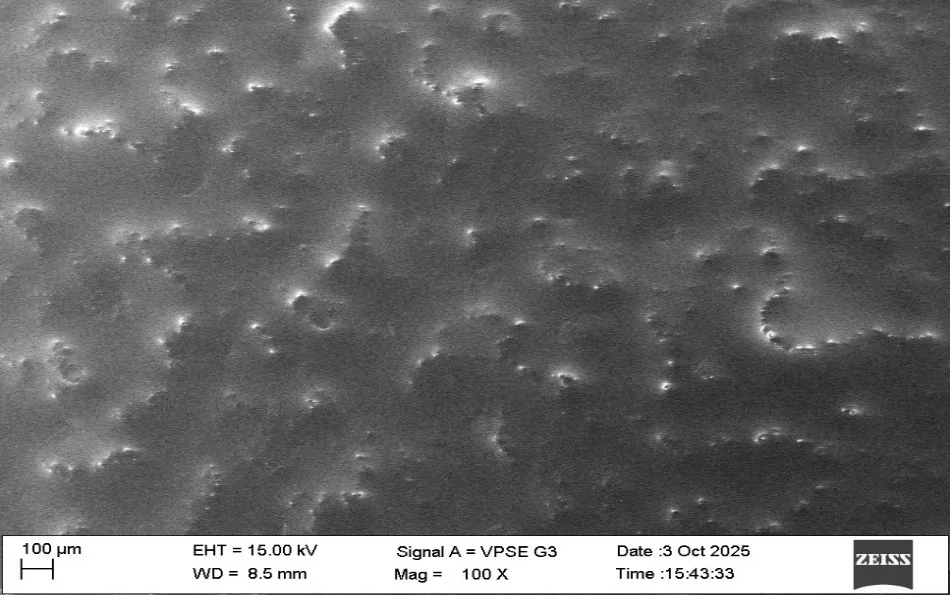
Figure 20: SEM image of OPZ-NEG


Mohammad Noufal, Dr. Satheesha Babu B. K , Quality By Design Based Preparation and Evaluation of Topical Nanoemulgel Loaded with A Model Drug for Management of Rheumatoid Arthritis, Int. J. of Pharm. Sci., 2026, Vol 4, Issue 8, 4719-4751, https://doi.org/10.5281/zenodo.22144927
 10.5281/zenodo.22144927