

We use cookies to ensure our website works properly and to personalise your experience. Cookies policy
Research scholar, P. R. Pote Patil College of Pharmacy, Kathora Road, Amravati - 444604, Maharashtra, India.
Quality by Design (QbD) is a systematic, science- and risk-based approach to pharmaceutical development that builds quality into the product and its manufacturing process instead of relying solely on end-product testing. This review discusses the application of QbD principles to the processing of oral solid dosage forms, mainly tablets. It describes the Quality Target Product Profile (QTPP), Critical Quality Attributes (CQAs), Critical Material Attributes (CMAs) and Critical Process Parameters (CPPs), and examines how material properties and unit operations (blending, granulation, drying, milling, lubrication, compression and coating) influence tablet performance. Quality risk management, Design of Experiments (Plackett–Burman, Central Composite, Box–Behnken and mixed-level designs) and design-space development are presented as vital tools. The roles of Process Analytical Technology (PAT), near-infrared and Raman spectroscopy, real-time release testing and continuous manufacturing are also discussed. QbD demands considerable investment, multidisciplinary expertise, reliable data and suitable infrastructure, but offers a robust framework for uniform product quality, manufacturing efficiency and regulatory compliance throughout the product lifecycle. Artificial intelligence and machine learning may further improve prediction modelling, process optimisation and real-time quality monitoring.
Among all the routes used for drug administration, the oral route is one of the most natural and acceptable options due to its simplicity and the fact that it aligns with patient preferences. It is also one of the natural, practical, and safe methods of drug administration.[1]. Maintaining the quality of pharmaceutical preparations is important, because drug safety assures that patients receive the best therapeutic benefit while reducing the risk of side effects.[2]
Dr. Joseph M. Juran is credited with coining the term "quality by design," arguing that poor product design is the primary source of most quality issues and that quality should be included into a product from the start.[3]. According to Woodcock, the FDA encourages risk-based approaches and QbD throughout research, production, and supervision because a high-quality drug always delivers the therapeutic effect stated on its label and is free from contamination.[4].
QbD is a methodical approach to development that starts with predetermined objectives and stresses process control, product and process understanding, and strong science and quality risk management. Product quality must be incorporated into the design; it cannot be tested. With the release of ICH Q8 (R2) (Pharmaceutical Development), which is summarized in Table 1, pharmaceutical QbD has changed.[5].
Table 1: Structure and Key Topics of the ICH Q8 (R2) Guideline (Part I: Core Guideline and Part II: Annex)[5]
| Section | Topic | Key content |
|---|---|---|
| Part I: Pharmaceutical development (core guideline) | ||
| 1.1–1.2 | Objective and scope | Suggested content for CTD section 3.2.P.2; applies to drug products in marketing applications, and the principles are relevant during clinical stages. |
| 2 | Pharmaceutical development (overview) | Aim is a quality product and process that consistently deliver intended performance. Quality is built in by design, not tested in; working within the design space is not a change. |
| 2.1 | Components of the drug product | Drug substance: physicochemical and biological properties (solubility, particle size, crystal form, permeability) and compatibility. Excipients: choice, concentration, function and performance over shelf life. |
| 2.2 | Drug product | Formulation development (critical attributes, excipient ranges, clinical-to-commercial bridging, IVIVC); overages (generally discouraged, justify if used); physicochemical and biological properties. |
| 2.3 | Manufacturing process development | Process selection and critical process parameters, differences from clinical batches, and process robustness. |
| Part II: Annex (QbD principles) | ||
| 1 | Introduction and approaches | Empirical vs. systematic (QbD) development; minimum elements are QTPP, CQAs, excipient and process selection, and control strategy. |
| 2.1 | QTPP | Basis of design: route, dosage form, strength, container closure, release and PK attributes, and quality criteria. |
| 2.2 | CQAs | Physical, chemical, biological or microbiological properties that must stay within limits; prioritised by risk management. |
| 2.3 | Risk assessment | Links material attributes and process parameters to CQAs (e.g. Ishikawa diagram, FMEA). |
| 2.4 | Design space | Variable selection, description, unit-operation design spaces, scale and equipment, proven acceptable ranges vs. design space, edge of failure. |
| 2.5–2.6 | Control strategy; lifecycle management | Input material controls, specifications, in-process controls, real-time release testing; process monitoring, trending and model maintenance. |
| 3–4, App. 1–2 | CTD submission, glossary, appendices | Placement of QRM, design space and control strategy information in the CTD; glossary; minimal vs. enhanced approaches; illustrative examples (fishbone diagram, interaction plots, design space presentations). |
Components of QbD
Pharmaceutical development must encompass, at the very least, these key components:
1. defining the quality target product profile (QTPP) based on efficacy, safety, and quality, while accounting for the dosage form, strength, stability, bioavailability, and administration route.
2. recognizing possible critical quality attributes (CQAs) of the drug product, allowing for the examination and management of factors influencing product quality;
3. identifying the essential characteristics of the drug substance and excipients, and choosing the type and quantity of excipients to achieve a product with the required quality;
4. choosing a suitable production method; and
5. establishing a control approach
Good manufacturing practice (GMP) compliance is expected in all situations; using QbD does not alter regional regulatory standards, but it may present opportunity for more flexible techniques to achieve them. Prior to QbD, the traditional Quality by Testing (QbT) method, which primarily evaluates quality in the final product, was employed; nevertheless, its shortcomings led to its replacement.[6].
Limitations of Traditional Quality-by-Testing (QbT) Approaches
End-product testing has historically been used to ensure consistent product quality. Although it can identify non-conforming batches, it has a poor ability to reveal the underlying causes of variability, and conforming batches frequently give little insight into the fundamental production process[7]. QbT-based systems may consequently cause financial losses, higher costs and ineffective troubleshooting. To address these limitations, QbD was introduced as a proactive, science- and risk-based approach that builds quality into the product from the earliest stages of development rather than testing it afterwards.
Objectives of Quality by Design in Pharmaceuticals
Pharmaceutical QbD might focus on: (1) establishing significant product quality criteria derived from clinical outcomes; (2) enhancing product and process design, comprehension, and regulation to boost process capability and minimize product variability and defects; (3) advancing product development and manufacturing efficiencies; and (4) refining root cause analysis and management of post-approval changes..(Figure 1).
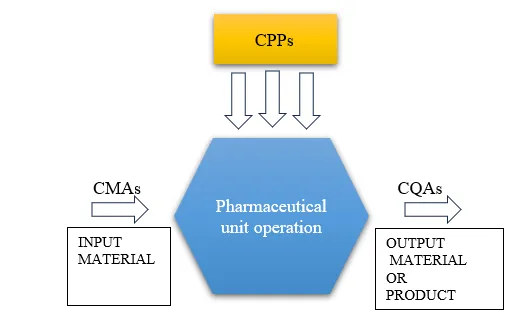
Figure 1: Connecting a Unit Procedure's Input Critical Material Attributes (CMAs) and Critical Process Parameters (CPPs) to Its Outcome Critical Quality Attributes (CQAs) [8]
ICH Guidelines regarding QbD
ICH's role in quality by design- ICH implemented 4 guidelines for maintaining the quality of pharmaceutical product development.
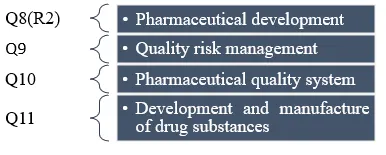
Figure 2: ICH Guideline
QTPP – Quality Target Product Profile:
The QTPP is a fundamental element of QbD that forms the basis for the design and development of pharmaceutical products. It is an anticipated summary of the characteristics that an ideal pharmaceutical product should possess to ensure the required quality while considering both efficacy and safety. Its components may include the intended purpose, route of administration, dosage form, strength, drug-release characteristics, stability, purity, and container-closure mechanism. It was established early in the development process and offers predetermined goals that direct formulation and process development.[9].
Before ICH Q8 (R1), the QTPP was called the target product quality profile (TPQP), derived from a review of clinical demands, including therapeutic targets and patient acceptability variables. Once established, the QTPP provides the foundation for identifying the CQAs of the drug product, as these attributes are directly linked to the achievement of the predefined quality targets[10].
Critical Quality Attributes (CQAs):
A CQA is a physical, chemical, biological, or microbiological characteristic that, to be able to assure the intended level of quality of the product, must fall within an appropriate range, distribution, or limit. CQAs for solid oral dosage forms tend to cope with pureness, robustness, stability, and drug distribution. In a QbD approach, the applicant identifies the qualities crucial to quality from the patient's perspective, translates them into drug-product CQAs, and defines the relationship between formulation/manufacturing variables and CQAs.Risk assessment can concentrate on possible sources of variability that could impact the quality of the finished product because it is strongly linked to the identification of CQAs and CPPs.[11].
Important CQAs for Tablets
The assay is performed by HPLC in accordance with the applicable USP monograph, and the results are used to assess the consistency of formulation and process. Assay and content uniformity guaranty accurate and uniform distribution of the active pharmaceutical ingredient (API) within each dosage unit, which is crucial for dose accuracy and therapeutic effectiveness.[12]. Dissolution reflects the rate and extent of drug release and serves as a surrogate for in vivo performance and bioavailability, particularly for immediate- and modified-release formulations[13]. Drug release and the absorption of immediate-release medicines depend on the prompt breakdown of tablets in the digestive system, which is ensured by disintegration. Friability is the percentage of weight loss after tumbling, (w1 − w2)/w1 × 100, where w1 and w2 are the tablet weights before and after testing. Hardness and friability reflect mechanical strength, i.e., the ability to survive handling, packaging, and transportation. By distributing the medication content of each unit in a lot within a small range around the label strength, tablet weight variation guaranties dosage consistency and adherence to pharmacopeial criteria.[14].
Particularly in formulations that are susceptible to moisture, moisture content affects microbiological growth, chemical degradation, and physical stability. Granule residual moisture must be managed because it can lead to cohesion or friability issues when filling capsules or pressing tablets later on. It influences the final tablet's appearance, chemical breakdown, solubility, and shelf life; moisture-sensitive APIs may hydrolyze or form hydrates during production or storage, and dynamic vapor sorption is typically used to study hygroscopicity.[15].
Stability is the length during which a product maintains its physical, chemical, microbiological, and pharmacokinetic qualities during its storage life; shelf life is a period of time it takes for a substance's efficacy to decline to 90% of its starting point.. Temperature, humidity, light, formulation ingredients, container closure, and conditions of storage all affect the expiration date.[16]. Five climatic zones are defined for stability testing: Zone I (temperate), 21 °C/45% RH; Zone II (Mediterranean/subtropical), 25 °C/60% RH; Zone III (hot and dry), 30 °C/35% RH; Zone IVa (hot and humid), 30 °C/65% RH; and Zone IVb (hot and higher humidity), 30 °C/75% RH[17].
Lubricant properties. The lubricant, like all excipients, must be compatible with the API, which is determined by drug–excipient compatibility studies[18]. Lubricants such as magnesium stearate can affect dissolution, hardness, friability and disintegration; where dissolution limits absorption it is regarded as a CQA, and for film-coated tablets the hardness and friability of the core are CQAs because the core must withstand coating. Once the CQAs are identified, the next step is to determine the CMAs that can significantly influence them.
Critical Material Attributes (CMAs):
CMAs are the physical, chemical, biological or microbiological properties of input materials that must fall within an appropriate range to guarantee that product CQAs are met[19]. After identifying the CQAs, the process parameters and material attributes that may impact them are listed as input variables for DoE; API/excipient characteristics → process dynamics → tablet CQAs[19].
Particle size and particle-size distribution affect bulk density, flowability, packing, permeability, cohesion and adhesion, and, through surface area, physical and chemical stability, content uniformity, solubility and bioavailability. In matrix tablets, drug percolation depends on the relative particle size (drug-to-excipient ratio), and the percolation threshold is a valuable preformulation parameter[20]. Particle morphology covers the shape and surface properties of particles; spherical particles with smooth surfaces flow best, but API particles seldom show this shape[21]. Crystallinity governs the characteristics of solid forms and can be tailored through salts, polymorphs, hydrates, solvates and cocrystals. Hygroscopicity may influence solubility, dissolution rate, stability, bioavailability and mechanical properties, and can be managed through suitable excipients, protective packaging, coating or cocrystal formation[22].
Bulk density is the powder mass divided by the volume of the powder bed; it indicates particle density and the state of consolidation, changes with processing and is an essential indicator of flowability[23]. Flowability, the ability of a powder to flow under specified conditions, is assessed by methods such as the angle of repose, and near-infrared spectroscopy can determine flow properties from light-scattering effects of particle physical properties[24]. Compressibility describes the change in bulk density under applied stress; highly compressible powders usually pack poorly without external pressure, signifying cohesiveness[23]. It is commonly expressed by the Carr index, CI = (ρT − ρA)/ρT × 100%, and the Hausner ratio, HR = ρT/ρA, where ρT is the tapped and ρA the bulk (apparent) density[23]. Wettability, the ability of a powder to take up liquid, affects wet granulation, lubrication and coating and thereby tablet strength and dissolution; it is assessed by the sessile drop, Washburn and drop-penetration methods[25].
Critical Process Parameters (CPPs):
To guaranty that the process generates the required quality, a CPP—a process parameter whose fluctuation influences a CQA—should be watched over or managed. Process parameters are input operational parameters (like speed and flow rate) or procedure variables (like temperature and pressure) of a unit operation; as a result, the CPPs and CMAs of the input materials determine the state of an operation.[26].
Blending/mixing provides a uniform distribution of the API and excipients before granulation or compression. From a QbD viewpoint, blending parameters must be assessed for their effect on CQAs. Powder blending shows characteristic kinetics, in which an initial fast mixing phase may be followed by demixing, so a suitable blending endpoint should be established instead of merely prolonging mixing[27].
Wet granulation is a key unit process for the manufacture of tablets and capsules[28] and is carried out before tableting to improve powder properties granules have better flowability, less dust and segregation, and improved content uniformity and tablet strength. It takes place in three phases: wetting and nucleation, growth and consolidation, and attrition or fragmentation. In high-shear granulation, impeller speed, binder quantity and addition method, material solubility and particle size greatly affect granule growth and final product quality[29].
Dry granulation/direct compression. Roll compaction/dry granulation improves powder handling through larger particle size and better flowability, reduces dust, improves die filling and increases bulk density[30]. Direct compression, in which the API–excipient blend is compressed without granulation, is simpler and faster but depends strongly on powder flowability, compressibility and compactibility, making excipient functionality critical[31].
Drying. The liquid added in wet granulation is removed in a drying step, most often by fluidised-bed drying. Over-drying causes attrition and product loss, so monitoring and an optimal endpoint are necessary[32]; the moisture content of dried granules can be measured by near-infrared chemical imaging. Milling follows API synthesis and granulation, and dry or wet milling achieves the required particle size distribution; particle-size reduction is especially important for improving the dissolution rate of BCS class II drugs[33]. The choice of dry mill depends on the fineness required and material hardness[33].
Lubrication is most relevant at tablet ejection and take-off, where the lubricant reduces friction between the tablet and the metal surfaces and so decreases the ejection force. Lubricant type, concentration and method of incorporation affect compression, tablet weight variation, hardness, friability, disintegration/dissolution, surface properties, adhesion to coating materials and possibly bioavailability[34]. Tablet coating is a critical step used for functional and aesthetic reasons; of sugar, film and press coating, film coating is the most widely used. It protects light-, oxidation- or moisture-sensitive APIs, controls the site, rate and time of drug release and masks taste to improve compliance[35].
Tablet compression applies pressure to a powder bed to form a cohesive compact. Compression pressure is a crucial variable: increasing it typically enhances hardness and mechanical strength and reduces friability, but may prolong disintegration through lower porosity and stronger inter-particle bonding; it must therefore be optimised and controlled[36]. Once CQAs and CMAs are identified, quality risk management (QRM) is applied to assess their impact on product quality and to prioritise the factors requiring control.
Quality Risk Management (QRM):
QRM is an organized method for assessing, managing, sharing, and monitoring risks to the drug product's quality across the course of its lifecycle. The first phase is risk assessment (hazard identification, risk analysis, and evaluation), which is followed by risk control and risk review. At each stage, risk communication is ongoing. There are two primary rules that apply: the level of effort, formality, and documentation should be commensurate with the level of danger; the evaluation of risk to quality should be based on scientific understanding and consequently linked to patient safety.[37].
Common tools include Failure Mode and Effects Analysis (FMEA), Ishikawa (fishbone) diagrams, Hazard Analysis and Critical Control Points (HACCP), and risk ranking and filtering, which help prioritise variables and guide experimental design. Within QbD, risk assessment is a dynamic, iterative process: risks identified during development are reassessed during scale-up, technology transfer and commercial manufacturing, and integration with Corrective and Preventive Action (CAPA) systems and knowledge management supports continual improvement in line with ICH Q10[38]. QRM tools help to build the structural and quantitative models used to select the CQAs for establishing the design space. Following risk assessment, DoE is used to evaluate the effects and interactions of CMAs and CPPs on CQAs.[37]
Design of Experiments (DoE):
DoE, as the name suggests, is a technique for designing experiments to provide the most knowledge with the least amount of trials.[38]. Its advantages are that it helps to handle experimental error, to determine which variables must be controlled and which need not be, to eliminate confounding of effects and to measure interactions.
Plackett–Burman design (PBD), developed by Plackett and Burman in 1946, is a two-level orthogonal screening design that can screen n factors in n+1 runs (generally a multiple of four: 8, 12, 16, 20, etc.). It gives unbiased estimates of main effects, but as a Resolution III design, main effects may be confounded with two-factor interactions, so interactions cannot be estimated independently; PBD is therefore used for initial screening, followed by optimisation designs such as CCD or BBD[39].
Central composite design (CCD) is a response-surface design that estimates second-order (quadratic) models and detects curvature by adding central and axial points to a factorial design: vertex points estimate first-order and interaction effects, central points detect curvature and estimate pure error, and axial points estimate quadratic effects. The number of experiments is N = 2k + 2k + n0 (k = number of factors, n0 = number of central points), and the axial distance (α) is 1.41, 1.68 and 2.00 for 2, 3 and 4 factors, each factor being studied at five levels; CCD needs more runs than factorial designs with the same number of factors. Box–Behnken design (BBD) is a three-level, second-order optimisation design generally used with three or more factors; it has no axial points and avoids testing all factors at extreme levels simultaneously, requiring fewer experiments than CCD and suiting optimisation within a narrow, safe range. Three-level factorial designs study linear, quadratic and interaction effects; usually a two-level fractional factorial screening is followed by a three-level full factorial for optimisation, although a three-level design can be used directly when prior knowledge suggests non-linear relationships[40].
Mixed-level factorial designs with quadratic models can merge the traditional screening and optimisation phases into one step. A standard fractional factorial design with a quadratic model may not sample the parameter space densely enough to identify non-linear relationships. The L18 design, a mixed-level fractional factorial with one two-level and seven three-level factors, is an effective method for assessing process parameters, although its capacity to explore interactions is limited[41]. The results of DoE help to establish the design space by defining the acceptable ranges of CPPs that consistently ensure the desired product quality.
Design Space:
The relationship between process inputs (material attributes and process parameters) and CQAs is described by the design space, an integral part of QbD. Besides good product and process understanding, establishing it requires all the main QbD elements: QTPP, risk assessment, CPPs, CMAs and CQAs. Two types can be developed: an invariant, experimentally verified design space applicable to all batches, or a fully model-based dynamic design space calculated for each batch. The dynamic design space offers more operating flexibility, but it requires more resources and the lack of standards for verifying predictive models increases uncertainty, whereas an invariant design space can be verified without extensive model validation[42]. Response surface methodology combined with optimisation can be used to establish the design space (for example, for blend flow and dissolution), with the linkage between CPPs and CQAs established through response-surface modelling . The established design space provides the scientific basis for PAT-based monitoring and control of CPPs and CQAs during manufacturing.
Process Analytical Technology (PAT):
PAT is one of the key elements of QbD in modern pharmaceutical manufacturing; it allows timely measurement and monitoring of critical material attributes, process parameters and CQAs during manufacturing. The U.S. FDA instituted the PAT framework to promote novel manufacturing processes based on real-time measurement and improved process understanding, and ICH Q8 (R2) also recognises PAT as an important tool for development, process understanding and control strategies[43]. The basic concept is "Measure → Understand → Control": appropriate tools measure process or product attributes in real time, statistical and chemometric techniques relate process parameters to product quality, and the information is used to establish feedback or feed-forward control[44].
PAT Tools for Real-Time Process Monitoring
Near-infrared (NIR) spectroscopy is one of the most widely investigated techniques because it gives rapid, non-destructive measurements with little or no sample preparation; it has been applied to blend uniformity, drug concentration, moisture content, granulation and drying[45]. Raman spectroscopy provides rapid, non-destructive molecular and chemical information for monitoring raw materials, blending, granulation, crystallisation and tableting, and has shown potential for real-time release testing, continuous manufacturing and statistical process control[46]. In-line particle-size analysis gives continuous information on particle-size distribution during granulation, milling and crystallisation, helping to identify deviations early[47]. Moisture sensors are particularly useful during wet granulation and drying, assisting in determining process endpoints and minimising the risk of over- or under-drying. Real-time dissolution and automated weight and mass-flow monitoring are further applications .
PAT and Process Control
The major advantage of PAT is achieved when real-time measurements are integrated with process-control strategies, so that changes in process conditions can be identified and corrected; this is particularly important in continuous manufacturing. Measurements of blend composition, moisture, particle size and compression-related parameters can be combined with multivariate models to understand their influence on tablet quality and strengthen the relationship between CPPs and CQAs, and this information can then be incorporated into the control strategy and design space[48].
PAT and Real-Time Release Testing
Real-Time Release Testing (RTRT) uses validated process measurements and appropriate control strategies, instead of depending exclusively on laboratory testing of finished batches, to demonstrate that a product consistently meets predefined quality requirements where scientifically justified. Successful implementation, however, requires appropriate selection and placement of sensors, calibration and validation of methods, reliable chemometric models, data integrity and integration with manufacturing control systems. PAT thus represents a transition from "testing quality into the product" to "building quality into the process" and provides a strong foundation for continuous manufacturing[49].
Continuous Manufacturing (CM):
CM eliminates the start-and-stop cycles of batch manufacturing by feeding raw materials continuously through integrated unit operations under controlled conditions to produce a final product of consistent quality; it can be applied to small-molecule drugs, solid oral dosage forms and even biologics[50]. Its key principles are: integration of unit operations (feeding, blending, granulation, drying and tableting linked in one flow); real-time monitoring by PAT (e.g. NIR for blend uniformity or granule moisture); automation and control (automatic adjustment of process parameters when the feed rate fluctuates); process flexibility (e.g. dose changes through feed rate or compression force); steady-state operation, which minimises variability; and enhanced data collection, which supports process improvement, better control and regulatory submissions[50].
Challenges and Limitations of QbD:
Implementation of QbD in solid oral dosage-form manufacturing presents several challenges. The first is the high initial investment required for systematic development, including extensive experimentation, analytical characterisation, process modelling, PAT implementation and data management, together with personnel who have multidisciplinary expertise in pharmaceutics, process engineering, statistics, analytical science and quality systems. Generating and interpreting large quantities of data is also demanding, truly critical variables can be hard to identify because they interact, and scale-up from laboratory to commercial scale can introduce variability. Integrating PAT and advanced analytical technologies into existing facilities adds technical and economic challenges, and emerging digital technologies raise concerns about data quality, model interpretability, validation, transferability and regulatory acceptance; recent work on machine learning for oral solid dosage forms identifies data availability, interpretability, uncertainty and integration with existing workflows as important challenges[51].
Overview of Manufacturing With and Without the Quality by Design Approach
Table 2: Comparison of QbD-based and Traditional Manufacturing Approaches[9]
| Parameter | Manufacturing using QbD | Without QbD / traditional approach |
|---|---|---|
| Quality philosophy | Quality is built into the product and process from the beginning | Quality is mainly tested/verified at the end of production |
| Process understanding | Strong understanding of how material attributes and process parameters affect product quality | Limited understanding of cause-and-effect relationships between process variables and quality |
| QTPP and CQAs | QTPP established early; CQAs systematically identified and monitored based on impact on safety, efficacy and quality | No systematic QTPP-driven development; critical attributes identified mainly through testing or after problems occur |
| Risk management | Proactive risk assessment identifies and controls potential failures before they occur | Problems are more often addressed after deviations, failures or quality problems occur |
| Design space | Defined design space allows operation within scientifically justified limits without adversely affecting quality | Generally lacks a scientifically established multidimensional design space |
| Variability and batch-to-batch consistency | Sources of variability understood and controlled; improved consistency through control of CQAs and CPPs | Greater variability and batch-to-batch variation because critical sources may not be understood |
| Batch failures, rejection and waste | Proactive risk control reduces failures, rejection and waste | More susceptible to failures and rejection; greater material waste |
| Overall outcome | More robust, predictable, consistent and scientifically controlled process | More labour-intensive, less predictable and more vulnerable to variability |
Future Perspectives:
The future of QbD for solid oral dosage forms is increasingly associated with the integration of digital technologies, artificial intelligence (AI), machine learning (ML), PAT, process modelling and continuous manufacturing, which could extend conventional QbD from experimental process optimisation towards predictive and adaptive manufacturing. Among these, AI and ML are particularly promising for enabling data-driven prediction, process understanding and optimisation of the complex relationships between material attributes, process parameters and product quality.
Artificial Intelligence and Machine Learning
Unlike conventional statistical tools, AI can model nonlinear relationships, handle high-dimensional data and improve its predictions as new information becomes available. Machine learning algorithms such as Random Forests and Support Vector Machines support early-stage modelling and feature selection, while deep neural networks can identify complex nonlinear relationships between CPPs and CQAs, and explainable AI techniques such as SHAP and LIME support interpretability, decision traceability and regulatory acceptance. Although AI-based methods may demand greater initial computational and training resources, their long-term advantages include continuous optimisation, less material waste and better process efficiency, while data standardisation, algorithm transparency, validation and regulatory requirements remain obstacles. The integration of ML with QbD may support prediction of dissolution behaviour, tablet hardness and mechanical properties and granule properties, identification of important process variables, process optimisation, real-time quality prediction and early detection of process deviations; the reliability of these applications, however, depends strongly on the quality, quantity and representativeness of the available data[52].
CONCLUSION:
QbD has emerged as a systematic, science-based approach to pharmaceutical development that integrates quality into products and manufacturing processes from the earliest stages. In contrast to QbT, which relies primarily on finished-product testing, QbD promotes proactive understanding of the relationships between formulation variables, material attributes, process parameters and product quality, through the definition of the QTPP, identification of CQAs, CMAs and CPPs, and the establishment of control strategies by systematic risk assessment. The integration of QRM and DoE (Plackett–Burman, Central Composite, Box–Behnken and mixed-level designs) strengthens the framework by identifying critical variables, evaluating interactions, optimising formulations and establishing a scientifically justified design space. PAT enables real-time monitoring and improved process control and, where justified, RTRT, and its integration with CM facilitates automation, consistent production, efficient use of data and better control of variability.
Despite these advantages, successful implementation requires adequate investment, trained personnel, reliable analytical methods, robust data management and suitable technological infrastructure. Emerging technologies, particularly AI, ML and predictive modelling, offer further opportunities to strengthen process understanding, optimize manufacturing and support data-driven quality management. Overall, the integration of QbD with risk management, DoE, PAT and continuous manufacturing provides a comprehensive framework for robust, efficient and reproducible pharmaceutical manufacturing, supporting consistent product quality, regulatory compliance and continuous improvement across the product lifecycle.
REFERENCES


Tejas Mulatkar, Amit Jaiswal, Sanika Lawhale, Quality by Design in the Processing of Oral Solid Dosage Forms: A Review, Int. J. of Pharm. Sci., 2026, Vol 4, Issue 10, 4041-4052. https://doi.org/10.5281/zenodo.23684190
 10.5281/zenodo.23684190