
We use cookies to ensure our website works properly and to personalise your experience. Cookies policy
Pharmaceutical Chemistry Oxbridge college of pharmacy.
A RP-HPLC method was developed and validated using Enable C18 250 x 4.6 mm, 5 µm column with mobile phase composition of Acetonitrile and Water in the ratio of 60:40 v/v, pH is adjusted to 2.9 by using Ortho-Phosphoric acid flow rate of 1.0 mL/min and UV detection at 240.0 nm, linearity was observed over concentration range of 20-100 µg/mL for omeprazole and 25-125 µg/mL for aspirin. The accuracy of the proposed method was determined by recovery studies and found to be of 99.09% to 100.12% for omeprazole and 99.6% to 100.12% for aspirin respectively. The proposed method was extended for estimation of omeprazole and aspirin in marketed tablet formulation and assay values conformed to the label claim of the marketed tablet formulation. This developed and validated HPLC method can be used for routine analysis of omeprazole and aspirin in tablets.
Omeprazole: Omeprazole is a proton pump inhibitor (PPI) and an anti-secretary compound. It suppresses gastric acid secretion by inhibiting the gastric H+ /K+ATPase (hydrogen-potassium adenosine triphosphatase) at the secretary surface of the gastric parietal cell. [1] Omeprazole has been characterized as a gastric acid-pump inhibitor; in that it blocks the final step of acid production. After rapid disappearance from plasma, Omeprazole can be found within the gastric mucosa for a day or more. Omeprazole is a (RS)-6-methoxy-2-((4-methoxy-3, 5- dimethylpyridin-2-yl) methyl sulfinyl)- 1H-benz (d) imidazole with molecular formula C17H19N3O3S and molecular weight 345.42 g/mol. It is an official drug in Indian Pharmacopoeia and British Pharmacopoeia.
Structure:
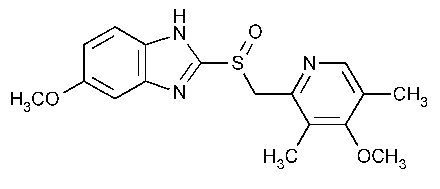
Fig. I: Chemical structure of Omeprazole.
Aspirin : Aspirin (ASP), 2-acetoxy benzoic acid, with a molecular formula C9H8O4 and molecular weight of 180.157 g/mol. It is an official drug in Indian Pharmacopoeia and British Pharmacopoeia. Aspirin is cyclo oxygenase inhibitor. It is used as an analgesic, antipyretic, anti-inflammatory and anti thrombic agent. It is one of the most widely used anionic drugs in the world. Once ingested, aspirin is rapidly hydrolysed in the body to produce salicylic acid, which is the compound that is primarily responsible for the pharmacological activity of aspirin. Aspirin is official in IP, BP and USP
Structure:

Fig. II: Chemical structure of Aspirin.
Objective
The objective of the proposed work was to develop and validate novel analytical methods for the simultaneous estimation of omeprazole and aspirin in bulk drug and pharmaceutical formulations. validate as per ICH guidelines a simple, precise and accurate RP-HPLC method for simultaneous determination of Omeprazole and Aspirin and apply the same for their determination in marketed dosage forms. Compare the developed methods with existing method for estimation of Omeprazole and Aspirin in marketed formulation.
MATERIALS AND METHOD
Instrument used:
The instrument used was SHIMADZU- SPD-20AD Detector with Rheodyne injector 20 µL and the Enable Column18 250 x 4.6 mm, 5 µm connected to computer loaded with spectra manager software LabSolutions. Wavelength of 240.0 nm for Multicomponent analysis used. All weights were taken on electronic balance (Model Shimadzu AUX 120).
Reagents and Chemicals Used:
Standard gift sample of Omeprazole was obtained from Karnataka Antibiotics and Pharmaceuticals Limited, Nelagadderanahalli, Peenya Industrial Area, Bengaluru, Karnataka 560058, India and Aspirin from Nice Chemicals Private Limited Ponekkara, Edappally, Kochi, Kerala, India.
Omeprazole and Aspirin combination tablet (YOSPRALA, 40 mg Omeprazole IP and 81 mg Aspirin IP; is manufactured by Aralez Pharmaceuticals US Inc. Mississauga, ON – Head Office Tribute Pharmaceuticals 7100 West Credit Avenue Suite 101 Mississauga, Ontario L5N 0E4.
Selection of mobile phase:
A mixture acetonitrile and water in the ratio of 60:40 v/v and orthophosphoric acid is used to maintain the pH 2.9, this combination showed good resolution. Hence 60:40 v/v ratio of mobile phase was considered to be the optimal composition.
Preparation of mobile phase:
A mixture of HPLC grade Acetonitrile and Water in the ratio of 60:40 v/v was prepared and pH was maintained to 2.9 by using Orthophosphoric acid, sonicated for 20 min, filtered through 0.4 µm membrane filter paper.
Preparation of standard stock solution:
50 mg each of OMZ and ASP were weighed separately and transferred in two different 50 mL volumetric flasks. Both the drugs were dissolved in 25 mL of mobile phase by sonication and then volume was made up to the mark with mobile phase to get a concentration of 1000 µg/mL of each component (stock A and A' solution).
From the above stock A and A' solution 5 mL of aliquot was pipetted out in a 50 mL volumetric flask and the volume was made up to the mark with mobile phase to obtain a concentration of 100 µg/mL of each component (stock B and B' solution).
Selection of analytical wavelength:
Effect of wavelength on the response factor and on the peak parameters (asymmetry, tailing factor, resolution, theoretical plates) was studied over the wavelength range of 400-200nm. Satisfactory chromatographic conditions were obtained with a wavelength of 240.0 nm for Multicomponent analysis using HPLC method.
Chromatographic condition:
The mobile phase containing mixture of acetonitrile and water (pH 2.9 by using orthophosphoric acid) in the ratio 60:40 v/v was selected as the optimum composition of mobile phase, because it was found that this solvent system resolved both the components ideally. The flow rate was set to 1.0 mL/min and UV detection was carried out at 240.0 nm. The mobile phase and samples were degassed by sonication for 20 min and filtered through 0.45µm membrane filter paper. All determinations were performed at constant column temperature (250C).
Selection of analytical concentration range and preparation of calibration curve for Omeprazole and Aspirin:
Appropriate aliquots were pipetted out from the standard stock B solution(100µg/mL) in to a series of 10 mL volumetric flasks. The volume was made up to the mark with the mobile phase to get a set of solutions having the concentration range of 20, 40, 60, 80 and 100µg/mL of OMZ.
Triplicate dilutions of each of the above mentioned concentrations were prepared separately and from these triplicate solutions, 20 µl of each concentration of the drug was injected into the HPLC system two times separately and their chromatograms were recorded under the same chromatographic conditions as described above. Peak areas were recorded for all the peaks and a standard calibration curve of area against concentration was plotted.
Appropriate aliquots were pipetted out from the standard stock A' solution (100µg/mL) in to a series of 10 mL volumetric flasks. The volume was made up to the mark with the mobile phase to get a set of solutions having the concentration range of 25, 50, 75, 100 and 125µg/mL of ASP.
Triplicate dilutions of each of the above mentioned concentrations were prepared separately and from these triplicate solutions, 20 µl of each concentration of the drug were injected into the HPLC system two times separately and their chromatograms were recorded under the same chromatographic conditions as described above. Peak areas were recorded for all the peaks and a standard calibration curve of area against concentration was plotted.
Both the drugs obeyed Beer’s law in the concentration range of 20-100µg/mL for OMZ and 25-125µg/mL for ASP.
Analysis of tablet formulation.
Twenty tablets of OMZ and ASP in combination were weighed and their average weight was determined. The tablets were crushed to fine powder and a tablet powder equivalent to 1 mg of OMZ was weighed which also contains 1 mg of ASP and transferred to 100 mL volumetric flask, dissolved in sufficient quantity of mobile phase. The solution was filtered through 0.4 µm membrane filter paper. The contents were sonicated for 20 minutes and the final volume was made up to the mark with mobile phase (sample stock ‘A’ solution). Appropriate aliquots were pipetted out from the sample stock ‘A’ solution (1000µg/mL) in to a series of 10 mL volumetric flasks. The volume was made up to the mark with the mobile phase to get a set of solutions having the concentration range of 20, 40, 60, 80 and 100µg/mL of OMZ and 25, 50, 75, 100 and 125µg/mL of ASP. A 20 µl volume of each sample mixture was injected in to the sample injector of HPLC system and their chromatograms were recorded under the same chromatographic conditions as described above. The area of each peak was determined at 240.0 nm and the amount of drug present in the sample mixture was determined.
Method Validation
The linearity of analytical method is its ability to elicit test results that are directly proportional to the concentration of analyte in sample within a given range. The range of analytical method is the interval between the upper and lower levels of analyte that have been demonstrated to be determined within a suitable level of precision, accuracy and linearity.
Recovery studies were carried out by adding 80%, 100% and 120% of the standard drug solution of OMZ and ASP to the known amount of sample solution by standard addition method.
Procedure for addition of 80% standard solution of OMZ and ASP to the known amount of sample solution.
1 mL of sample stock ‘A’ solution (contain 1000µg of OMZ and 1000µg of ASP) was transferred to 10 mL volumetric flask and added 0.6 mL of standard stock B solution of OMZ (60µg) and 0.75 mL standard stock A' solution of ASP (75µg). The volume was made up to the mark with mobile phase. The peak area was measured at 240.0nm
Procedure for addition of 100% standard solution of OMZ and ASP to the known amount of sample solution.
1 mL of sample stock ‘A’ solution (contain 1000µg of OMZ and 1000µg of ASP) was transferred to 10 mL volumetric flask and added 0.8 mL of standard stock B solution of OMZ (80µg) and 1 mL standard stock A' solution of ASP (100µg). The volume was made up to the mark with mobile phase. The peak area was measured at 240.0 nm.
Procedure for addition of 120% standard solution of OMZ and ASP to the known amount of sample solution.
1 mL of sample stock ‘A’ solution (contain 1000µg of OMZ and 1000µg of ASP) was transferred to 10 mL volumetric flask and added 1 mL of standard stock B solution of OMZ (100µg) and 1.25 mL standard stock A' solution of ASP (125µg). The volume was made up to the mark with mobile phase. The peak area was measured at 240.0 nm.
The concentration of OMZ and ASP were calculated. At each level of recovery studies, three determinations were performed. The results obtained were compared and statistically validated
It is the procedure which express closeness of agreement between a series of measurement obtained from multiple sampling of the same homogenous sample under the prescribed condition.
In intraday precision the above sample mixture containing 60µg/mL of OMZ and 75µg/mL of ASP was analyzed six times at different time interval in the same day at their selected analytical wavelength 240.0 nm for OMZ and ASP. The variation of the results within the same day was analyzed and statistically validated.
In inter-day precision the above sample mixture containing 60µg/mL of OMZ and 75µg/mL of ASP were prepared and analyzed six times at same time on three different days of a week at their selected analytical wavelength at 240.0 nm for OMZ and ASP. The variation of the results on different days was analyzed and statistically validated.
The evaluation of robustness should be considered during the development phase and depends upon the type of procedure under study. It should show the reliability of analysis with respect to deliberate variations in method parameters. The solution containing 60µg/mL of OMZ and 75µg/mL of ASP was injected into sample injector of HPLC three times under different parameters like deliberate variations in flow rate and wavelength.
The evaluation of ruggedness should be considered during the development phase and depends upon the type of procedure under study. It should show the reliability of analysis with respect to deliberate variations in analyst or instrument. The solution containing 60µg/mL of OMZ and 75µg/mL of ASP was injected into sample injector of HPLC three times by different analysts.
RESULTS
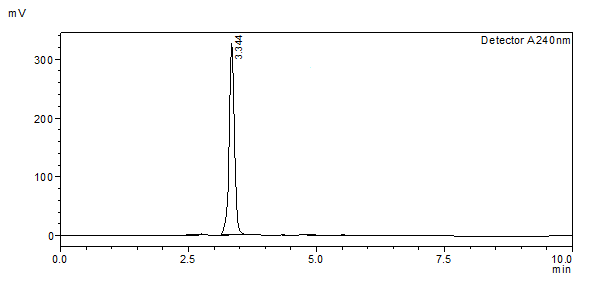
Fig.3: Retention time of OMZ.
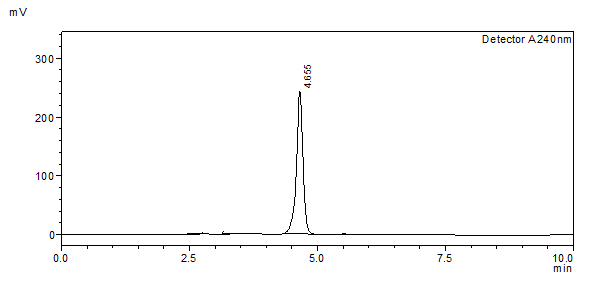
Fig.4: Retention time of ASP.
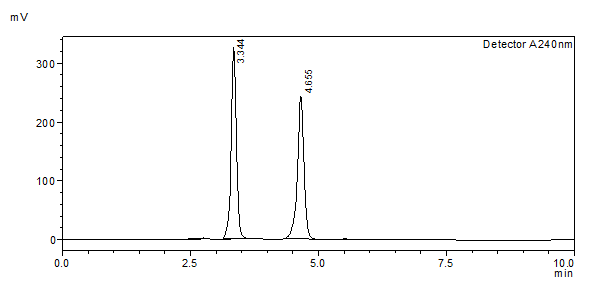
Fig.5: Retention time of OMZ and ASP respectively.
Table 1: Results for calibration curve of Omeprazole at 240.0 nm by RP?HPLC Method.
|
Sl. No. |
Concentration (µg/mL) |
Area |
|
1 |
0 |
0 |
|
2 |
20 |
555474 |
|
3 |
40 |
1031441 |
|
4 |
60 |
1515157 |
|
5 |
80 |
2046255 |
|
6 |
100 |
2503843 |
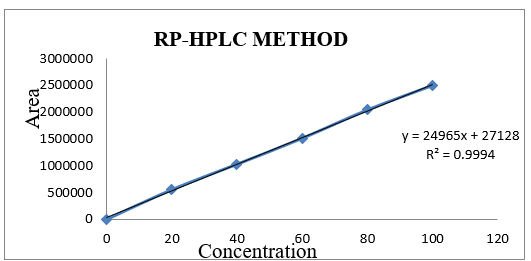
Fig. 6: Calibration curve for OMZ at 240.0 nm by RP-HPLC Method.
Table 2: Results for calibration curve of Aspirin at 240.0 nm by RP?HPLC Method.
|
Sr. No. |
Concentration (µg/mL) |
Area |
|
1 |
0 |
0 |
|
2 |
25 |
961541 |
|
3 |
50 |
1866455 |
|
4 |
75 |
2758423 |
|
5 |
100 |
3591188 |
|
6 |
125 |
4405702 |
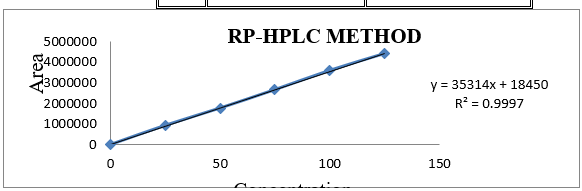
Fig. 7: Calibration curve for ASP at 240.0 nm by RP-HPLC Method.
Table 3: Statistical Data of Omeprazole and Aspirin at 240.0 nm by RP?HPLC method.
|
Parameter |
OMZ |
ASP |
|
Linear Range (µg/mL) |
20-100 |
25-125 |
|
Slope |
24965 |
35314 |
|
Intercept |
27128 |
18450 |
|
Limit of Detection (µg/mL) |
0.008 |
0.0086 |
|
Limit of Quantification (µg/mL) |
0.027 |
0.026 |
Table 4: Assay results of Tablet Formulation.
|
Sr. No. |
Amount present (mg/tab) |
Amount obtained (mg/tab) |
Amount obtained (%) |
|||
|
OMZ |
ASP |
OMZ |
ASP |
OMZ |
ASP |
|
|
1 |
60 |
75 |
59.60 |
74.75 |
99.33 |
99.66 |
|
2 |
60 |
75 |
59.19 |
75.01 |
99.85 |
100.00 |
|
3 |
60 |
75 |
58.98 |
74.98 |
98.3 |
99.97 |
|
4 |
60 |
75 |
59.54 |
75.11 |
99.23 |
100.14 |
|
5 |
60 |
75 |
59.71 |
74.56 |
99.51 |
99.34 |
|
6 |
60 |
75 |
60.02 |
74.51 |
100.00 |
99.33 |
Table 5: Statistical Validation Data for Tablet Formulation.
|
Components |
Mean* |
Standard Deviation* |
Co-efficient of Variation* |
Standard Error* |
|
OMZ |
99.37.00 |
67.671 |
0.0062 |
25459.8 |
|
ASP |
99.91 |
97.04 |
0.0036 |
56214.36 |
*n = 6
Table 6: Accuracy of Omeprazole and Aspirin.
|
Level of % recovery |
Amount present (µg/mL) |
Amount of standard drug added (µg/) |
Total amount recovered (µg/) |
% Recovery |
||||
|
OMZ |
ASP |
OMZ |
ASP |
OMZ |
ASP |
OMZ |
ASP |
|
|
80% |
40 |
50 |
20 |
25 |
60 |
74.75 |
100 |
99.66 |
|
40 |
50 |
20 |
25 |
58.98 |
75.01 |
98.3 |
100.00 |
|
|
40 |
50 |
20 |
25 |
59.17 |
74.98 |
98.98 |
99.97 |
|
|
100% |
40 |
50 |
40 |
50 |
79.28 |
101.17 |
99.10 |
101.17 |
|
40 |
50 |
40 |
50 |
80.01 |
99.20 |
100.02 |
99.20 |
|
|
40 |
50 |
40 |
50 |
80.05 |
100.01 |
100.63 |
100.01 |
|
|
120% |
40 |
50 |
60 |
75 |
100.37 |
124.23 |
100.37 |
99.38 |
|
40 |
50 |
60 |
75 |
99.37 |
124.56 |
99.37 |
99.6 |
|
|
40 |
50 |
60 |
75 |
99.93 |
125.03 |
99.93 |
100.0 |
|
Table 7: Statistical Validation Data for Accuracy determination.
|
Level of (%) Recovery
|
Mean* |
Standard deviation* |
%Coefficient of Variation* |
Standard Error* |
||||
|
OMZ |
ASP |
OMZ |
ASP |
OMZ |
ASP |
OMZ |
ASP |
|
|
80% |
99.09 |
99.87 |
1174.9 |
1185.3 |
0.0727 |
0.44 |
30320.3 |
26292.6 |
|
100% |
100.12 |
100.12 |
7604.2 |
1152.4 |
0.352 |
0.319 |
30443.5 |
17297.3 |
|
120% |
99.89 |
99.6 |
2424.8 |
1312.6 |
0.009 |
0.291 |
29940.1 |
22448.7 |
*n = 3
Table 8: Intra-day precision of Omeprazole and Aspirin.
|
Sr. no |
Amount present (µg/mL) |
Amount obtained (µg/mL) |
Amount obtained (%) |
|||
|
OMZ |
ASP |
OMZ |
ASP |
OMZ |
ASP |
|
|
1 |
60 |
75 |
59.60 |
74.75 |
99.33 |
99.66 |
|
2 |
60 |
75 |
59.19 |
75.01 |
99.85 |
100.00 |
|
3 |
60 |
75 |
58.98 |
74.98 |
98.3 |
99.97 |
|
4 |
60 |
75 |
59.54 |
75.11 |
99.23 |
100.14 |
|
5 |
60 |
75 |
59.71 |
74.56 |
99.51 |
99.34 |
|
6 |
60 |
75 |
60.02 |
74.51 |
100.00 |
99.33 |
Table 9: Statistical validation Data for determination of intra-day precision.
|
Components |
Mean* |
Standard deviation* |
% Coefficient of Variation* |
Standard Error* |
|
OMZ |
99.37 |
67.671 |
0.0062 |
25459.8 |
|
ASP |
99.91 |
97.04 |
0.0036 |
56214.36 |
*n = 6
Table 10: Inter-day precision of Omeprazole and Aspirin.
|
Sr. no |
Amount present (µg/mL) |
Amount found (µg/mL) |
Amount obtained (%) |
|||
|
|
OMZ |
ASP |
OMZ |
|
OMZ |
ASP |
|
DAY-1 |
||||||
|
1 |
60 |
75 |
59.60 |
74.75 |
99.33 |
99.66 |
|
2 |
60 |
75 |
59.19 |
75.01 |
99.85 |
100.00 |
|
3 |
60 |
75 |
58.98 |
74.98 |
98.3 |
99.97 |
|
4 |
60 |
75 |
59.54 |
75.11 |
99.23 |
100.14 |
|
5 |
60 |
75 |
59.71 |
74.56 |
99.51 |
99.34 |
|
6 |
60 |
75 |
60.02 |
74.51 |
100.00 |
99.33 |
|
DAY- 2 |
||||||
|
1 |
60 |
75 |
60.03 |
74.73 |
100.0 |
99.64 |
|
2 |
60 |
75 |
59.61 |
74.48 |
99.35 |
99.30 |
|
3 |
60 |
75 |
59.68 |
75 |
99.46 |
100 |
|
4 |
60 |
75 |
59.29 |
74.91 |
98.81 |
99.88 |
|
5 |
60 |
75 |
59.71 |
74.83 |
99.50 |
99.77 |
|
6 |
60 |
75 |
59.96 |
74.41 |
99.93 |
99.21 |
|
DAY- 3 |
||||||
|
1 |
60 |
75 |
59.28 |
74.43 |
98.80 |
99.24 |
|
2 |
60 |
75 |
59.83 |
75.02 |
99.71 |
100.0 |
|
3 |
60 |
75 |
59.17 |
74.61 |
98.61 |
99.48 |
|
4 |
60 |
75 |
59.73 |
74.21 |
99.55 |
98.89 |
|
5 |
60 |
75 |
59.91 |
75.01 |
99.85 |
100.0 |
|
6 |
60 |
75 |
59.29 |
74.98 |
98.81 |
99.97 |
Table 11: Statistical validation Data for determination of Inter-day precision.
|
Components |
Mean* |
Standard deviation* |
% Coefficient of Variation* |
Standard Error* |
|
OMZ |
99.95 |
67.671 |
0.0062 |
25459.8 |
|
ASP |
99.96 |
97.04 |
0.0036 |
56214.36 |
n *= 3
Table 12: Summary of validation and System suitability parameters of Omeprazole and Aspirin
|
.Parameters |
OMZ |
ASP |
|
Linear range (µg/mL) |
20-100 |
25-125 |
|
Slope |
24965 |
35314 |
|
Intercept |
27128 |
18450 |
|
Regression coefficient (r2) |
0.9994 |
0.9997 |
|
Limit of Detection (µg/mL) |
0.008 |
0.0086 |
|
Limit of Quantification (µg/mL) |
0.027 |
0.026 |
|
Retention time (min) |
3.344 |
4.655 |
|
Tailing factor |
0.970 |
0.884 |
|
Resolution factor |
6.200 |
|
|
Theoretical plate |
4842 |
6510 |
Table 13: Robustness result for variations in Flow Rate (mL/min)
|
.Method Parameter |
Level |
Retention Time |
Tailing factor |
||
|
Flow Rate (mL/min) |
OMZ |
ASP |
OMZ |
ASP |
|
|
0.9 |
-1 |
3.351 |
4.661 |
1.005 |
0.898 |
|
1.0 |
0 |
3.344 |
4.655 |
0.970 |
0.884 |
|
1.1 |
+1 |
3.210 |
4.471 |
1.157 |
0.968 |
Table 14: Robustness result for variations in Wavelength (nm).
|
Method Parameter |
Level |
Retention Time |
Tailing factor |
||
|
Wavelength (nm) |
OMZ |
ASP |
OMZ |
ASP |
|
|
238 |
-2 |
3.355 |
4.659 |
1.011 |
0.966 |
|
240 |
0 |
3.344 |
4.655 |
0.970 |
0.884 |
|
242 |
+2 |
3.357 |
4.651 |
1.147 |
0.975 |
Table 15: Ruggedness result for variations in Analyst.
|
Method Parameter |
Retention Time |
Tailing factor |
||
|
Analysts |
OMZ |
ASP |
OMZ |
ASP |
|
Analysts 01 |
3.375 |
4.801 |
0.965 |
0.889 |
|
Analysts 02 |
3.306 |
4.823 |
1.012 |
0.966 |
DISCUSSION
RP HPLC method was developed with mobile phase of Acetonitrile and Methanol in the ratio of 60:40 v/v with flow rate of 1 mL/min on Enable Column18 (250*4.6*5). UV detection wavelength of 240.0 nm gave a satisfactory chromatogram of Omeprazole and Aspirin. Different combinations of mobile phase were tried but the mobile phase of acetonitrile-water (60:40 v/v) adjusted to pH 2.9 with o-phosphoric acid was used. Various trials were carried out by altering flow rates such as, 0.4, 0.6, 0.5mL/min, and 1.0mL/min with an objective to get good resolution of omeprazole and aspirin. In many of the trials the resolution was not good and in some the peaks were merging and showing less retention time. The flow rate at which the good resolution of peaks was observed and selected. The retention time of omeprazole and aspirin were observed at 3.44 min and 4.65 min respectively. The method was validated by various parameters such as linearity, accuracy, precision, LOD, LOQ, robustness and ruggedness based on ICH method validation guidelines.
CONCLUSION
The objective of the proposed work was to develop and validate novel analytical methods for the simultaneous estimation of omeprazole and aspirin in bulk drug and pharmaceutical formulations. The developed method was validated for various parameters as per ICH guidelines like Linearity, accuracy, precision, robustness and ruggedness. The results obtained were within the acceptance criteria for the parameter. The proposed method was applied for simultaneous estimation of Omeprazole and Aspirin in marketed formulations. The assay results conformed to the label claim of the formulation. Hence the proposed method was found to be satisfactory and could be used for the routine analysis of Omeprazole and Aspirin in bulk drug and pharmaceutical formulations.
ACKNOWLEDGEMENT
The authors are thankful to Parents, Principal and Lecturers of National college of Pharmacy Shimoga
REFERENCES


Sanjana C. J.*, Pratibha C. V., Manjula R., Development and Validation of Novel Rp-HPLC Analytical Methods for The Simultaneous Estimation of Omeprazole and Aspirin in Bulk Drug and Pharmaceutical Formulation, Int. J. of Pharm. Sci., 2025, Vol 3, Issue 1, 1141-1151. https://doi.org/10.5281/zenodo.14649973
 10.5281/zenodo.14649973