

We use cookies to ensure our website works properly and to personalise your experience. Cookies policy
Department of Pharmacology, Aadya College of Pharmacy, Chitradurga-577501, Karnataka, India., A.
Background: Phyllanthus niruri L. is a medicinal plant investigated for its diverse phytochemical constituents. The chemical profile of plant extracts can vary according to the plant part and extraction solvent. The present study evaluated the preliminary phytochemical characteristics of ethanolic and aqueous stem extracts and examined the functional-group profile of the ethanolic extract using Fourier-transform infrared (FTIR) spectroscopy. Methods: Stem material of P. niruri L. was extracted using 70% ethanol and water by Soxhlet extraction. The percentage yields and physical characteristics of the extracts were recorded. Preliminary phytochemical screening was performed on both extracts. Total phenolic and total flavonoid contents were estimated using catechol and quercetin as reference standards, respectively. FTIR analysis was performed on the dried 70% ethanolic extract by an external laboratory. Results: The percentage yield was 20.35% for the 70% ethanolic extract and 5.46% for the aqueous extract. Qualitative screening indicated the presence of several phytochemical classes, with stronger recorded responses for flavonoids and tannins/phenolic compounds in the ethanolic extract. The total phenolic content was reported as 86.4 mg catechol equivalents/g for the ethanolic extract and 41.7 mg catechol equivalents/g for the aqueous extract. Total flavonoid content was reported as 89.2 mg quercetin equivalents/g and 38.0 mg quercetin equivalents/g, respectively. FTIR analysis of the ethanolic extract showed absorption bands at 3392.26, 2367.32, 1632.20, 1410.10, 1252.56, 1216.54 and 1022.00 cm?¹. These bands were tentatively associated with different functional-group vibrations. Conclusion: The 70% ethanolic stem extract showed a higher extraction yield and higher reported total phenolic and flavonoid estimates than the aqueous extract under the experimental conditions used.
Medicinal plants are important sources of structurally diverse natural products and continue to be investigated for their phytochemical composition and potential biological relevance. The chemical constituents present in a plant may vary according to species, plant part, geographical origin, environmental conditions, harvesting stage and extraction procedure. Therefore, systematic phytochemical evaluation is an important preliminary step in the investigation of medicinal plant materials.1,2
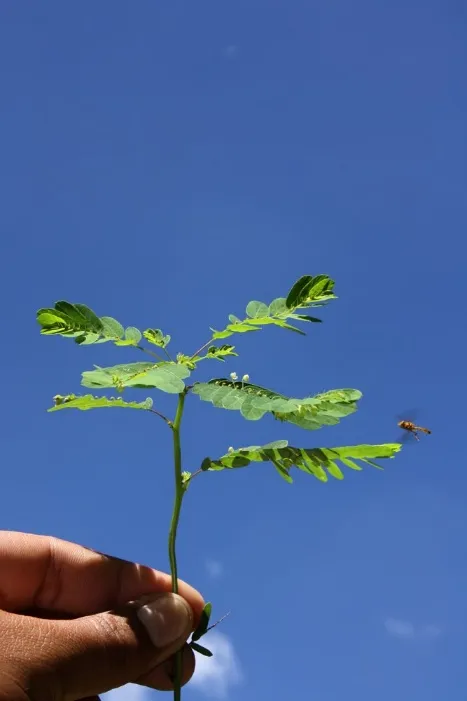
Phyllanthus niruri L. is a herbaceous plant belonging to the family Phyllanthaceae. It has been widely discussed in traditional medicine and scientific literature because of its diverse reported phytochemical constituents and biological properties. Previous studies have described several groups of compounds in P. niruri, including lignans, flavonoids, tannins, phenolic compounds and other secondary metabolites. Reviews have highlighted the phytochemical diversity and pharmacological investigations associated with this species.
The extraction solvent is an important factor influencing the recovery of plant constituents. Aqueous and hydroalcoholic solvents differ in polarity and may consequently extract different proportions of polar and moderately polar constituents. Comparative evaluation of extracts prepared using different solvents can therefore provide useful preliminary information about extraction yield and selected phytochemical parameters. Earlier research has also demonstrated that solvent selection and processing conditions can influence the metabolite composition of P. niruri extracts.
Qualitative phytochemical screening provides an initial indication of the major classes of constituents present in an extract. Quantitative colorimetric assays can provide estimates of selected constituent groups relative to reference standards. However, such measurements do not identify or quantify individual compounds independently. FTIR spectroscopy is a complementary analytical technique that provides information about molecular vibrations and functional groups through characteristic absorption bands. In complex plant extracts, overlapping signals and matrix effects mean that FTIR assignments should be considered tentative unless supported by additional analytical techniques.3,4
Although several investigations have examined different preparations and plant parts of P. niruri, the phytochemical profile of an isolated stem preparation requires separate evaluation. The present study was therefore undertaken to compare the preliminary phytochemical characteristics and selected quantitative phytochemical estimates of 70% ethanolic and aqueous stem extracts of P. niruri L. FTIR analysis was additionally performed on the 70% ethanolic extract to obtain preliminary information about its functional-group profile.
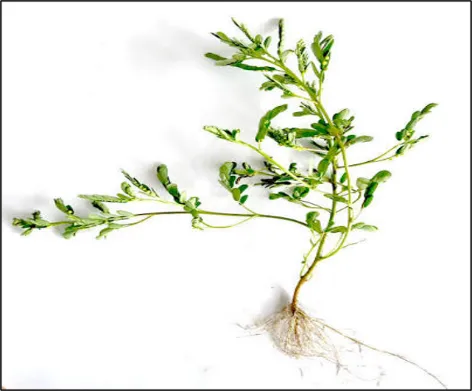
MATERIALS AND METHODS
2.1 Plant material
The Stem of Phyllanthus niruri L were collected from surroundings of Chitradurga, Karnataka. The plant was identified and authenticated by Dr. SUDHAMA. V. N HOD, Department of Botany, Govt Science College, Chitradurga.
2.2 Preparation of extracts
The dried stem powder of Phyllanthus niruri L. was subjected to Soxhlet extraction using 70% ethanol and water as solvents. Following extraction, the respective extracts were collected and concentrated under reduced pressure using a rotary flash evaporator. The concentrated extracts were transferred into airtight containers and stored under refrigerated conditions below 10°C until further use. The 70% ethanolic extract was used for preliminary qualitative phytochemical screening, while both ethanolic and aqueous extracts were used for comparative phytochemical evaluation. The percentage yield of each extract was calculated based on the weight of the dried extract relative to the initial weight of the dried plant material.5
2.3 Preliminary phytochemical screening
Preliminary qualitative phytochemical screening was performed on the 70% ethanolic and aqueous extracts to identify selected classes of phytoconstituents. The screening observations were recorded using qualitative response symbols, where “−” indicated absence, “+” indicated presence, “++” indicated a comparatively clearer response and “+++” indicated a stronger response.
The screening included observations for alkaloids, carbohydrates, glycosides, cardiac glycosides, anthraquinone glycosides, saponins, flavonoids, tannins, phenolic compounds, proteins and steroids.6
| Sl. No. | Phytochemical constituent | Test/Reagent used |
|---|---|---|
| 1 | Alkaloids | Mayer’s reagent |
| 2 | Flavonoids | Shinoda test |
| 3 | Phenolic compounds | Ferric chloride test |
| 4 | Tannins | Ferric chloride test |
| 5 | Saponins | Foam test |
| 6 | Terpenoids | Salkowski test |
| 7 | Glycosides | Appropriate glycoside test |
2.4 Estimation of Total Phenolic Content7-10
Total phenolic content was estimated by a Folin–Ciocalteu colorimetric procedure using catechol as the reference standard. Aliquots of the extracts were reacted with diluted Folin–Ciocalteu reagent and sodium carbonate solution. The developed colour was measured spectrophotometrically at 650 nm. A catechol calibration curve was used to estimate the phenolic content of the extracts. The results were expressed as milligrams of catechol equivalents per gram of sample, as reported in the study.
2.5 Estimation of Total Flavonoid Content
Total flavonoid content was estimated using a colour-development method involving sodium nitrite, aluminium chloride and sodium hydroxide, with quercetin as the reference standard. Absorbance was measured at 510 nm against a reagent blank. The flavonoid content was calculated using the quercetin calibration curve and expressed as milligrams of quercetin equivalents per gram of sample, as reported in the study.11-13
2.6 Estimation of Total Tannin Content
Prior to quantitative estimation, the presence of tannins in the samples was confirmed using the ferric chloride (FeCl₃) and gelatin tests. The total tannin content was subsequently estimated according to the method described by Price and Butler (1977), with minor modifications.
Briefly, 0.1 g of the plant extract was transferred into a 100 mL flask, and 50 mL of distilled water was added. The mixture was boiled for 30 minutes and then filtered through a cotton filter. The filtrate was transferred into a 500 mL volumetric flask, and distilled water was added to make up the final volume to 500 mL.
An aliquot of 0.5 mL of the resulting solution was transferred into a vial, followed by the addition of 1 mL of 1% potassium ferricyanide [K₃Fe (CN)₆] solution and 1 mL of 1% ferric chloride (FeCl₃) solution. The volume was made up to 10 mL with distilled water. After allowing the reaction mixture to stand for 5 minutes, its absorbance was measured spectrophotometrically at 720 nm.
The tannin concentration was determined by comparing the absorbance of the samples with that of standard solutions prepared at concentrations ranging from 5 to 30 µg/10 mL.14-18
2.7 FTIR analysis19,20
FTIR analysis was performed on the dried 70% ethanolic stem extract of P. niruri L. The sample was submitted to an external laboratory for spectral analysis. The absorption bands recorded in the spectrum were evaluated with reference to commonly reported infrared functional-group regions. The assignments were considered tentative because plant extracts contain complex mixtures of compounds with potentially overlapping absorption bands.
RESULTS
3.1 Extraction yield and physical characteristics
The 70% ethanolic extract showed a dark-brown colour and non-sticky consistency, whereas the aqueous extract was brown and non-sticky. The percentage yield of the 70% ethanolic extract was 20.35%, compared with 5.46% for the aqueous extract.
Table 1: Percentage Yield and Physical Characteristics of P. niruri Stem Extracts
| Parameter | 70% ethanolic extract | Aqueous extract |
|---|---|---|
| Colour | Dark brown | Brown |
| Consistency | Non-sticky | Non-sticky |
| Percentage yield (%) | 20.35 | 5.46 |
3.2 Preliminary phytochemical screening21
The preliminary screening results showed differences in the qualitative responses of the two extracts. The 70% ethanolic extract showed stronger recorded responses for flavonoids and tannins/phenolic compounds. Alkaloids, carbohydrates and saponins were also recorded in both extracts. The complete observations are presented in Table 2.
Table 2: Preliminary Phytochemical Screening of Ethanolic and Aqueous Stem Extracts
| Phytochemical constituent | 70% ethanolic extract | Aqueous extract |
|---|---|---|
| Alkaloids | ++ | + |
| Carbohydrates | ++ | ++ |
| Glycosides | + | − |
| Cardiac glycosides | ++ | − |
| Anthraquinone glycosides | ++ | − |
| Saponins | ++ | ++ |
| Flavonoids | +++ | ++ |
| Tannins and phenolic compounds | +++ | ++ |
| Proteins | ++ | + |
| Steroids | + | − |
3.3 Quantitative estimation of total phenolic and flavonoid contents22
The total phenolic content of the 70% ethanolic extract was reported as 86.4 mg/g catechol equivalents, whereas the aqueous extract showed 41.7 mg/g catechol equivalents. The total flavonoid content was reported as 89.2 mg/g quercetin equivalents for the ethanolic extract and 38.0 mg/g quercetin equivalents for the aqueous extract.
Table 3: Reported Total Phenolic and Total Flavonoid Contents of the Extracts
| Parameter | Reference standard | Wavelength (nm) | 70% ethanolic extract (mg/g) | Aqueous extract (mg/g) |
|---|---|---|---|---|
| Total phenolic content | Catechol | 650 | 86.4 | 41.7 |
| Total flavonoid content | Quercetin | 510 | 89.2 | 38.0 |
| Total Tannin content | Tannic acid | 720 | 98.1 | 57.7 |
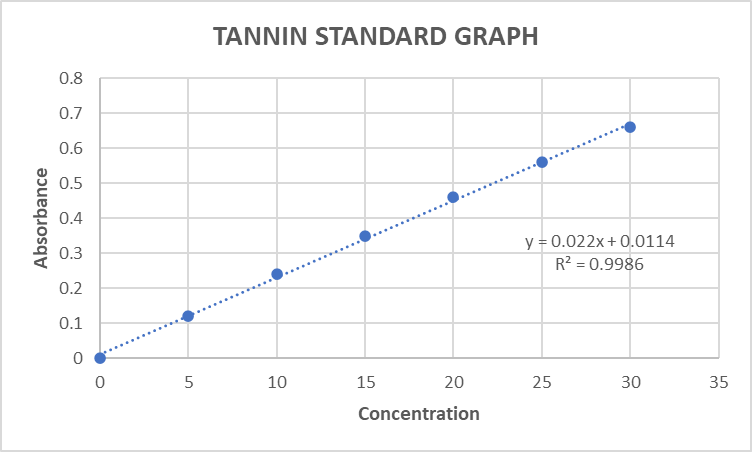
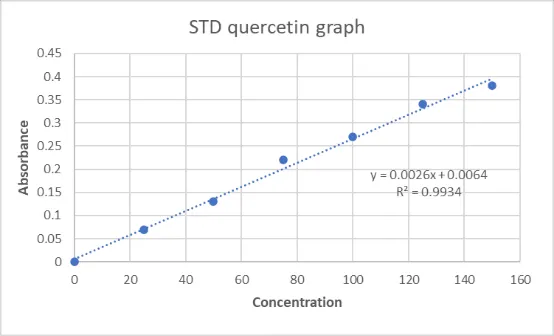
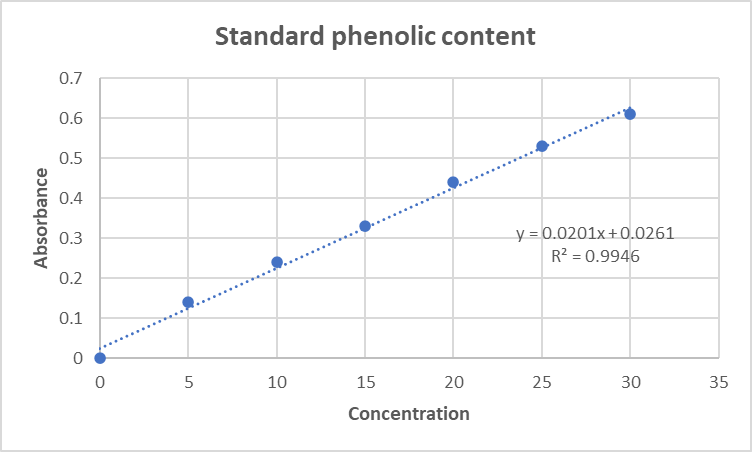
Standard graph of Catechol Standard graph of Quercetin Standard graph of Tannic acid
3.4 FTIR analysis of the 70% ethanolic extract23
Sample: 70% ESEPN
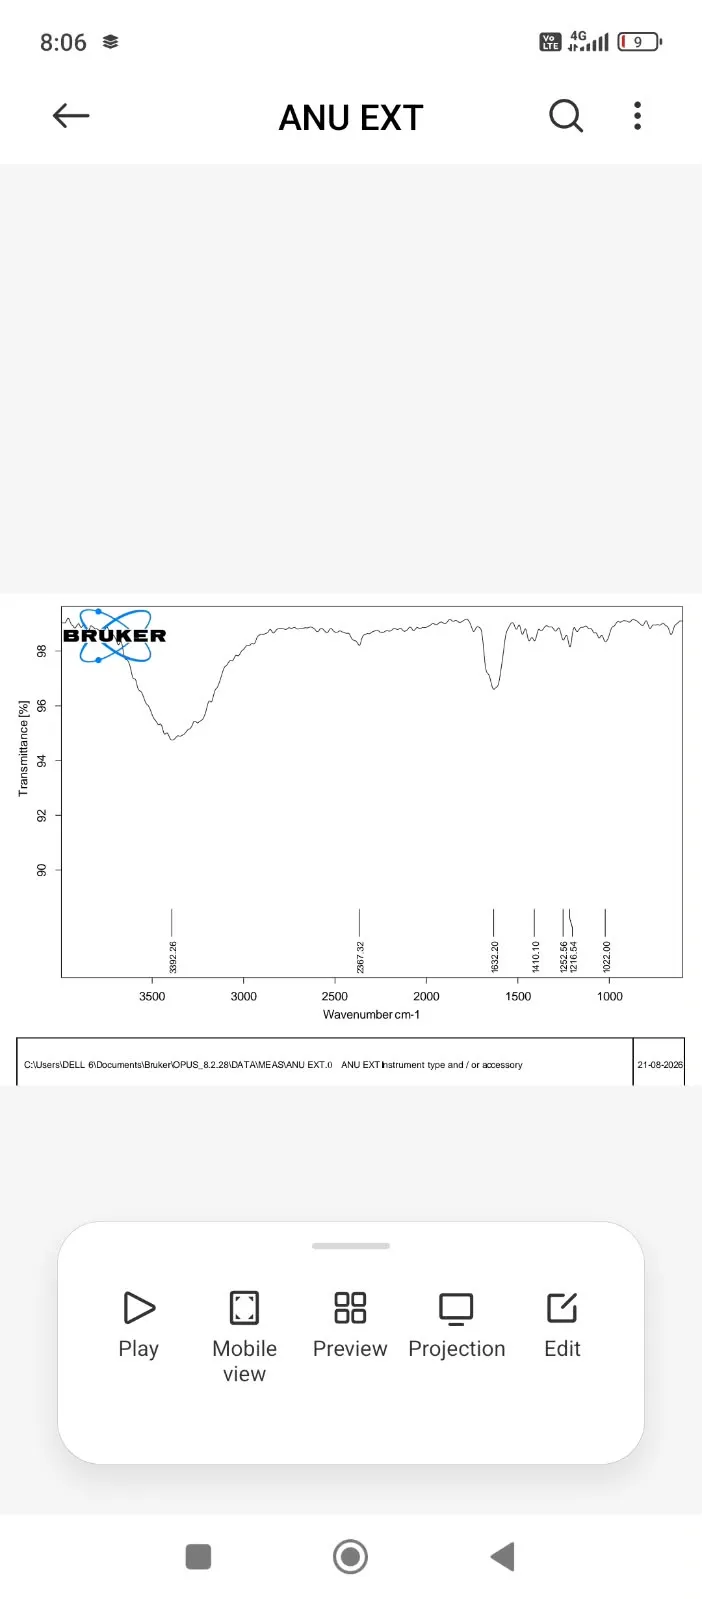
The FTIR spectrum of the 70% ethanolic stem extract showed absorption bands at 3392.26, 2367.32, 1632.20, 1410.10, 1252.56, 1216.54 and 1022.00 cm⁻¹. The band at 3392.26 cm⁻¹ was tentatively associated with O–H stretching vibrations. The band at 2367.32 cm⁻¹ may be related to atmospheric carbon dioxide interference. The absorption band at 1632.20 cm⁻¹ may include contributions from adsorbed water and/or vibrations of organic constituents. Other bands were tentatively associated with C–H deformation and C–O-related vibrations.
Table 4: FTIR Absorption Bands Recorded for the 70% Ethanolic Stem Extract
| Observed band (cm⁻¹) | Tentative assignment | Interpretation |
|---|---|---|
| 3392.26 | O–H stretching | May indicate hydroxyl-containing constituents |
| 2367.32 | Possible atmospheric CO₂ contribution | Requires confirmation using the background spectrum |
| 1632.20 | Adsorbed water bending and/or organic vibrations | May include overlapping contributions |
| 1410.10 | C–H deformation and/or carboxylate-related vibrations | Tentative assignment |
| 1252.56 | C–O-related vibrations | Possible oxygen-containing constituents |
| 1216.54 | C–O-related vibrations | Possible overlapping vibrational modes |
| 1022.00 | C–O or C–O–C stretching | May be associated with alcohols, ethers or carbohydrate-related structures |
DISCUSSION
The present study demonstrated differences in the phytochemical composition of the ethanolic and aqueous stem extracts of Phyllanthus niruri L. The 70% ethanolic extract showed a higher percentage yield (20.35%) than the aqueous extract (5.46%), indicating greater recovery of extractable constituents under the extraction conditions employed. Preliminary phytochemical screening revealed the presence of various phytochemical groups, with comparatively stronger responses for flavonoids and tannins/phenolic compounds in the ethanolic extract.
Quantitative estimation further indicated higher total phenolic, flavonoid and tannin contents in the ethanolic extract than in the aqueous extract. This suggests that 70% ethanol was more effective in extracting these groups of constituents under the conditions used. The FTIR spectrum of the ethanolic extract showed characteristic absorption bands tentatively associated with hydroxyl and other oxygen-containing functional groups, providing additional preliminary information about its chemical composition.
Overall, the findings indicate that the 70% ethanolic stem extract is a promising candidate for further phytochemical investigation. However, the detected phytochemical groups and FTIR bands do not establish the identity of individual compounds or confirm biological activity. Further studies, including compound-level characterization and direct antioxidant and other evaluation, are required to investigate its potential pharmacological relevance.24,25
5. Limitations and Future Perspectives
The present study was limited to preliminary phytochemical screening, quantitative estimation of selected phytochemical constituents and FTIR analysis of the stem extracts of Phyllanthus niruri L. Although the ethanolic extract showed higher extraction yield and estimated phenolic, flavonoid and tannin contents than the aqueous extract, individual phytochemical compounds were not identified or isolated. FTIR analysis provided preliminary information about functional groups; however, it was insufficient for definitive structural characterization. Furthermore, the study did not include direct antioxidant assays, in-vitro evaluation or in-vivo experimental studies. Therefore, the biological activities and other protective potential of the extracts cannot be confirmed from the present findings.
Future studies should focus on the isolation and identification of individual phytoconstituents using advanced analytical techniques such as HPLC, LC-MS and GC-MS, as appropriate. Further investigation should also include validated in-vitro antioxidant assays and suitable models, followed by in-vivo studies to evaluate biological efficacy and safety. These investigations may provide a better understanding of the phytochemical composition and potential pharmacological relevance of P. niruri stem extracts.
CONCLUSION
The present study provided a preliminary comparative phytochemical evaluation of 70% ethanolic and aqueous stem extracts of Phyllanthus niruri L. The 70% ethanolic extract showed a higher extraction yield than the aqueous extract and higher reported total phenolic flavonoid and tannin estimates. Preliminary screening indicated the presence of several phytochemical classes, while FTIR analysis of the ethanolic extract provided tentative information about hydroxyl- and C–O-related functional-group vibrations.
These findings contribute to the initial chemical characterization of P. niruri stem extracts and provide a basis for further investigation. Additional analytical methods are required to identify individual constituents and validate the quantitative estimates. Direct biological studies are necessary before any antioxidant or other activity can be attributed to the extracts.
Declarations
Conflict of interest:
The authors declare that they have no conflict of interest.
Acknowledgements:
The authors acknowledge Aadya College of Pharmacy, Chitradurga, Karnataka, for providing institutional support. The authors also acknowledge the external laboratory that performed the FTIR analysis.
REFERENCES



Suhas R. M., Sheethal B., Raghavendra G. S., Comparative Phytochemical Evaluation of Ethanolic and Aqueous Stem Extracts of Phyllanthus Niruri L. with FTIR Fingerprinting of the Ethanolic Extract, Int. J. of Pharm. Sci., 2026, Vol 4, Issue 11, 2168-2176. https://doi.org/10.5281/zenodo.24216704
 10.5281/zenodo.24216704