

We use cookies to ensure our website works properly and to personalise your experience. Cookies policy
Department of Pharmaceutical Analysis, Sri Ramakrishna Institute of Paramedical Sciences, College of Pharmacy, Coimbatore 641044.
A simple, sensitive and cost-effective HPTLC method was developed and validated for the quantitative estimation of flucloxacillin sodium in the bulk drug and its capsule formulation, in accordance with ICH Q2(R2) guidelines. Chromatographic separation was carried out on precoated silica gel 60 F254 aluminium plates using chloroform: ethanol: ammonia (5:4:1 v/v/v) as the optimized mobile phase, with detection at 272 nm. The method showed good linearity over the concentration range of 20–100 ng/band, with a correlation coefficient of 0.998. Intra-day, inter-day and repeatability studies produced %RSD values below 2%, confirming the precision of the method. Recovery studies conducted at 50%, 100% and 150% levels yielded recoveries ranging from 96.78% to 98.89%, indicating good accuracy. The method was specific and the limit of detection and limit of quantification were found to be 1.87 ng/band and 5.57 ng/band respectively. The drug remained stable for up to 2 hours under the experimental conditions. Upon application to a marketed capsule formulation, the drug content was estimated to be 98.5% of the labelled claim. These findings indicate that the developed HPTLC method is simple, accurate, precise and well suited for the routine quality control analysis of flucloxacillin sodium in bulk and pharmaceutical dosage forms.
Flucloxacillin sodium ((2S,5R,6R)-6-({[3-(2-chloro-5-fluorophenyl)-5-methylisoxazol-4-yl]carbonyl}amino)-3,3-dimethyl-7-oxo-4-thia-1-azabicyclo[3.2.0]heptane-2-carboxylic acid) is a narrow spectrum beta lactam antibiotic belonging to the penicillin class, specifically used to treat infections caused by gram positive bacteria including penicillinase producing staphylococci. Its mechanism of action by inhibiting bacterial cell wall synthesis in treating skin, soft tissue and respiratory tract infections 1. The various analytical techniques used for the estimation of flucloxacillin sodium such as UV Spectrophotometric method, TLC densitometry method and HPLC method. While HPLC is most commonly used analytical technique to ensure the safety and quality2-3.
High-performance thin-layer chromatography (HPTLC) is a rapid, simple, and cost-effective chromatographic technique widely used for the qualitative and quantitative analysis of pharmaceutical compounds. It offers good separation efficiency, sensitivity, and reproducibility, while allowing the simultaneous analysis of multiple samples. Due to its minimal solvent consumption and suitability for routine quality control, HPTLC is extensively applied in pharmaceutical research and analysis4-6. While other analytical studies have reported in combination therapies7, there remains a significant opportunity to develop and validate HPTLC method specifically for flucloxacillin sodium according to the ICH guidelines and minimizes solvent waste and ensuring a tool for modern quality control.
The primary objective of this research is to optimize the mobile phase and chromatographic condition for the effective separation of flucloxacillin sodium and also validate the developed method in accordance with ICH Q2(R2) guidelines for parameters such as linearity, precision, accuracy, limit of detection, limit of quantification5-8. This HPTLC method provides a rapid and cost-effective to monitor drug stability and batch to batch consistency. The application of this method to pharmaceutical dosage forms ensures that the final product delivered to consumer meets the established pharmacopeial standards for drug content.
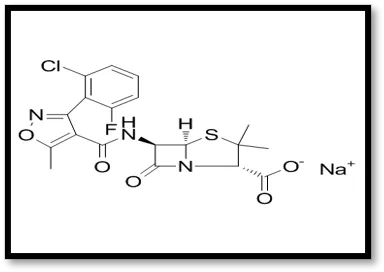
Figure 1: Structure of Flucloxacillin sodium
MATERIALS AND METHODS:
Chemicals and Reagents
Flucloxacillin sodium (Staphonex 500 mg capsules) was used as the reference standard and formulation for the analysis. HPLC-grade water, chloroform, ethanol, and ammonia solution were used throughout the study.
Instruments
Weighing of samples was carried out using a Scale-Tec digital analytical balance. A Jasco V-730 UV-Visible spectrophotometer was used for wavelength selection. For HPTLC analysis, precoated silica gel 60 F254 TLC plates on aluminum sheets were used as the stationary phase. The HPTLC system was equipped with a Linomat 5 sample applicator, TLC Scanner 4, and VisionCATS 3.1 software for data acquisition and evaluation. A twin-trough glass chamber was used for chromatographic development.
METHOD DEVELOPMENT
Selection of solvent
Selection of solvents was carried out based on the solubility characteristics of flucloxacillin sodium. Various solvents including water, ethanol, acetone, ether, and chloroform were evaluated. The drug was found to be freely soluble in water, partially soluble in ethanol and acetone, and insoluble in chloroform. Water was selected as the solvent for further studies due to its complete solubility and its ability to produce a clear and stable solution.
Preparation of standard stock solution
The stock solution was prepared by accurately weighing 10 mg of flucloxacillin sodium and transferring it into a 10 mL volumetric flask containing water. The drug was dissolved in water, and the volume was made up to the mark with the same solvent to obtain a standard stock solution with a concentration of 1000 µg/ml.
Preparation of working solution
From the standard stock solution, 1 mL was pipetted and transferred into a 10 mL volumetric flask. The volume was made up to the mark with water to obtain a working solution with a concentration of 100 µg/ml.
Selection of wavelength
The standard solution of flucloxacillin sodium was scanned in the UV range of 200–400 nm. The drug exhibited maximum absorbance at 272 nm, which was selected as the wavelength for the study.
Selection of Mobile Phase
Various mobile phase combinations including water, ethanol, acetone, acetonitrile, chloroform, dichloromethane and chloroform: ethanol in different ratios were investigated to achieve optimal separation. The systems were evaluated based on parameters such as resolution, peak shape, retardation factor (Rf), and spot compactness. Among these, chloroform: ethanol (5:4:1% v/v/v) was found to be the most suitable, as it produced well-resolved, sharp, and compact spots with an acceptable Rf value. Therefore, this mobile phase was selected for further studies.
Chromatographic Conditions
Chromatographic separation was carried out on precoated silica gel 60 F254 aluminium plates used as the stationary phase. The optimized mobile phase consisted of chloroform: ethanol (5:4:1% v/v/v). Sample application was performed as 8 mm bands using a CAMAG Linomat 5 applicator. Plate development was carried out in a twin-trough glass chamber saturated with the mobile phase for 30 minutes at room temperature. The development distance was maintained at 70 mm. After development, the plates were dried and scanned densitometrically at 272 nm using a CAMAG TLC Scanner 4 with a slit dimension of 5.0 × 0.45 mm.
METHOD VALIDATION
The developed HPTLC method was validated in accordance with ICH Q2(R2) guidelines for parameters such as linearity, precision, accuracy, specificity, limit of detection (LOD), limit of quantification (LOQ), and stability.
Linearity
The linearity of the method was evaluated by analyzing standard solutions at different concentrations in the range of 20–100 ng/band. Calibration curves were constructed by plotting peak area against concentration.
Precision
The precision of the method was assessed in terms of intra-day precision, inter-day precision, and repeatability. Intra-day precision was determined by analyzing samples at different concentrations (60 and 80 ng/band) within the same day, while inter-day precision was evaluated by analyzing the samples on different days. Repeatability was assessed at a concentration of 60 ng/band.
Accuracy
Accuracy was determined by recovery studies at 50%, 100%, and 150% levels, and the percentage recovery was calculated.
Specificity
The specificity of the method was evaluated to ensure that no interference from other components was observed for the analyte.
Limit of detection and limit of quantification
The limit of detection (LOD) and limit of quantification (LOQ) were determined based on the standard deviation of the response and the slope of the calibration curve.
LOD=3.3* σ/S, LOQ=10* σ/S
Stability
The stability of the analyte was evaluated by analyzing the sample at different time intervals under specified conditions to assess any changes in response.
Application of the developed method to formulation
The developed HPTLC method was applied to the analysis of a marketed capsule formulation containing flucloxacillin sodium. Ten capsules were weighed, and their contents were mixed thoroughly to obtain a homogeneous powder. An amount of powder equivalent to 10 mg of flucloxacillin sodium was accurately weighed and transferred into a 10 mL volumetric flask containing water. The mixture was sonicated for 30 minutes to ensure complete dissolution of the drug and then filtered. From the resulting solution, 1 mL was transferred to a 10 mL volumetric flask and diluted to volume with water to prepare the test solution. An aliquot of 0.2 µL of the test solution was applied to the HPTLC plate, and the chromatogram was recorded under the optimized chromatographic conditions.
RESULTS AND DISCUSSION:
The developed HPTLC method for the estimation of flucloxacillin sodium was optimized to achieve good resolution, accuracy, and reproducibility. Various experimental parameters, including the solvent system, mobile phase composition, detection wavelength, and chamber saturation time, were systematically evaluated and optimized. The UV spectrum of flucloxacillin sodium showed maximum absorbance at 272 nm in Figure 2.
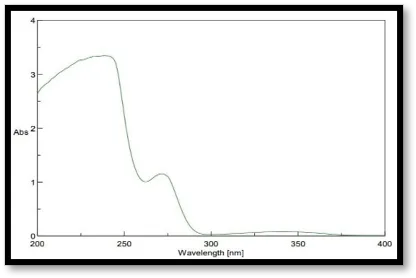
Figure 2: UV spectrum of flucloxacillin sodium
Linearity
The developed method showed excellent linearity over the concentration range of 20–100 ng/band (Table 1). A strong linear relationship was observed between concentration and peak area, with a correlation coefficient (R²) of 0.998, as illustrated in Figures 3–8.
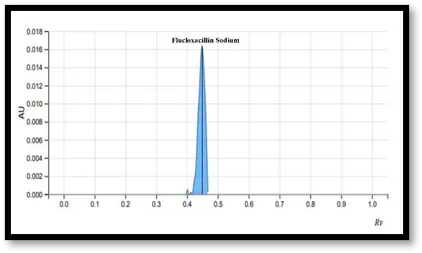
Figure 3: Standard chromatogram of flucloxacillin sodium (20ng/band)
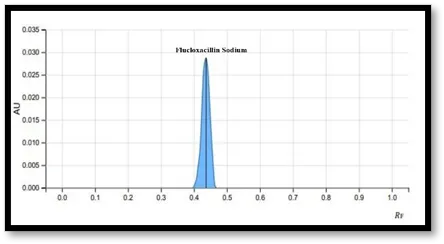
Figure 4: Standard chromatogram of flucloxacillin sodium (40ng/band)
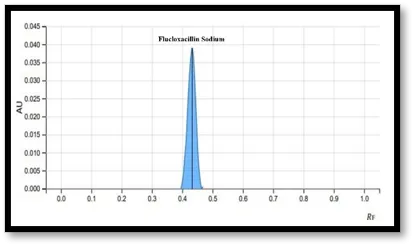
Figure 5: Standard chromatogram of flucloxacillin sodium (60ng/band)
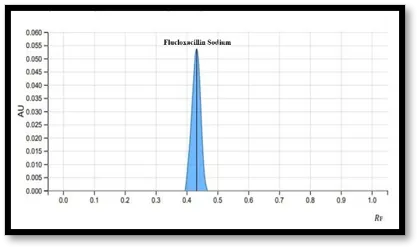
Figure 6: Standard chromatogram of flucloxacillin sodium (80ng/band)
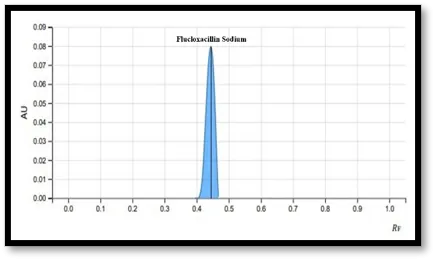
Figure 7: Standard chromatogram of flucloxacillin sodium (100ng/band)
Table 1: Calibration data of flucloxacillin sodium
|
Concentration |
Peak Area |
|
20 |
0.00045 |
|
40 |
0.00087 |
|
60 |
0.00123 |
|
80 |
0.00182 |
|
100 |
0.00270 |
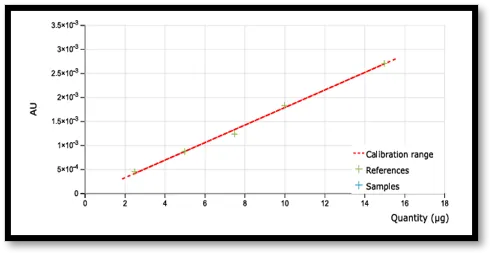
Figure 8: Calibration curve of flucloxacillin sodium
Precision
The precision study was carried out and the %RSD values were found to be within acceptable limits (<2%), indicating that the method is precise and reproducible (Tables 2, 3, and 4).
Table 2: Intraday precision of flucloxacillin sodium
|
Concentration (ng/band) |
Peak Area |
% RSD |
|
60 |
0.00124 |
1.6878 |
|
0.00121 |
||
|
0.00125 |
||
|
80 |
0.00183 |
0.8331 |
|
0.00185 |
||
|
0.00182 |
Table 3: Inter-day precision of flucloxacillin sodium
|
Concentration (ng/band) |
Peak Area |
% RSD |
|
60 |
0.00123 |
1.229 |
|
0.00126 |
||
|
0.00124 |
||
|
80 |
0.00182 |
1.098 |
|
0.00180 |
||
|
0.00184 |
Table 4: Repeatability of flucloxacillin sodium
|
Concentration (ng/band) |
Absorbance |
% RSD |
|
60 |
0.00125 |
0.01442 |
|
0.00123 |
||
|
0.00127 |
||
|
0.00122 |
||
|
0.00123 |
||
|
0.00124 |
Accuracy
Accuracy studies was performed at 50%, 100% and 150% levels and its % recovery, % RSD were found to be within the limits (Table 5).
Table 5: Accuracy (% Recovery)
|
Analyte |
Level |
% Recovery |
% RSD |
|
Flucloxacillin sodium |
50% |
96.78% |
1.20 |
|
100% |
97.96% |
1.11 |
|
|
150% |
98.89% |
1.578 |
Specificity
The method was found to be specific and no interference was observed from excipients.
Limit of Detection and Limit of Quantification
The limit of detection (LOD) and limit of quantification (LOQ) were found to be 1.87ng/band and 5.57ng/band respectively, indicating the sensitivity of the method.
Stability
Stability studies shows that the analyte was stable up to 2 hours under the experimental conditions with no significant variation in peak areas (Table 6).
Table 6: Stability of flucloxacillin sodium
|
Concentration (ng/band) |
Hours |
Peak Area |
|
60 |
0 |
0.00122 |
|
2 |
0.00118 |
|
|
4 |
0.00101 |
|
|
6 |
0.00098 |
Application to formulation
The developed HPTLC method was successfully applied to the analysis of the capsule formulation. The sample was analyzed under optimized conditions, and the amount of flucloxacillin sodium was determined using the calibration curve. The drug content was found to be 98.5% of the labeled claim, which is within acceptable limits (Table 7). These results demonstrate that the method is suitable for the routine analysis of pharmaceutical formulations.
Table 7: Formulation analysis
|
Drug |
Amount |
% Label claim |
% RSD |
|
|
Labelled |
Estimated |
|||
|
Flucloxacillin sodium |
10 |
9.85 |
98.5 |
1.4 |
CONCLUSION:
A simple, accurate, and precise HPTLC method was successfully developed and validated for the estimation of flucloxacillin sodium in bulk drug and pharmaceutical dosage forms. The method exhibited good linearity, precision, accuracy, and specificity in accordance with ICH guidelines. The LOD and LOQ values indicated that the method is sensitive. Therefore, the developed method is reliable and suitable for routine quality control analysis of flucloxacillin sodium.
REFERENCES

Poovizhi K, Althaf S, Gowsalya M, Krishnamathesh S, Kumaresan R, Logeshwaran P, Madheswaran B, Maha Gowri K S, Development and Validation of an HPTLC Method for the Quantitative Analysis of Flucloxacillin Sodium in Bulk and Pharmaceutical Dosage Form, Int. J. of Pharm. Sci., 2026, Vol 4, Issue 9, 2993-3000. https://doi.org/10.5281/zenodo.22930937
 10.5281/zenodo.22930937