

We use cookies to ensure our website works properly and to personalise your experience. Cookies policy
Institute of Pharmacy, Harish Chandra Post Graduate College, Bawan beegha, Varanasi.
Background: Dengue is an important mosquito-borne viral infection for which treatment is primarily supportive, and there is a continuing need for therapeutic approaches that may address dengue-associated pathological changes. Carica papaya leaves have attracted considerable research interest because of their reported antioxidant, anti-inflammatory, and potential dengue-related biological activities. The present study aimed to formulate and evaluate a Carica papaya leaf extract-loaded microemulsion for potential application in dengue management. Methods: Fresh Carica papaya leaves were extracted using 95% ethanol by Soxhlet extraction and evaluated for physicochemical and phytochemical characteristics. MCT oil, Tween 80, propylene glycol, and distilled water were selected as formulation components. Pseudoternary phase diagrams were constructed using different surfactant-to-co-surfactant (Smix) ratios, and a 2:1 ratio of Tween 80 to propylene glycol was selected for microemulsion development. A 5 g microemulsion containing 1% w/w Carica papaya leaf extract was prepared and evaluated for physicochemical characteristics, in-vitro release, antioxidant, anti-inflammatory, and dengue-related NS2B–NS3 protease inhibitory activities, followed by accelerated stability evaluation. Results: The ethanolic extraction yielded 14% w/w extract. The optimized microemulsion exhibited a greenish-brown, uniform, and slightly cloudy appearance, with a mean droplet size of 100 nm, PDI of 0.20, zeta potential of approximately ?20 mV, and viscosity of 50 mPa·s. The formulation demonstrated 84.6% cumulative marker release after 24 h, with the Korsmeyer–Peppas model showing the best fit (R² = 0.9996; n = 0.8663). The formulation exhibited 77.0% DPPH radical inhibition with an IC?? of 115 µg/mL and 74.4% inhibition of BSA protein denaturation with an IC?? of 125 µg/mL. NS2B–NS3 protease inhibition reached 68%, with an IC?? of 180 µg/mL.
Dengue is an important mosquito-borne viral infection caused by dengue virus (DENV), an enveloped, single-stranded, positive-sense RNA virus belonging to the genus Flavivirus and family Flaviviridae. It is predominantly prevalent in tropical and subtropical regions and is transmitted mainly by infected female Aedes aegypti mosquitoes. Dengue infection ranges from asymptomatic or mild febrile illness to severe disease associated with plasma leakage, bleeding, shock and organ dysfunction. The clinical course is generally divided into febrile, critical and recovery phases, with the critical phase being particularly important because increased vascular permeability may lead to plasma leakage and circulatory compromise.
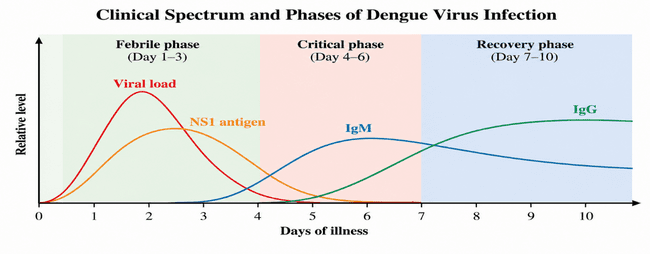
Figure 1: Clinical Spectrum and Phases of Dengue Virus Infection.
The global burden of dengue has increased considerably in recent decades, particularly in tropical and subtropical regions of Asia, the Americas and the Western Pacific. Factors such as urbanization, climate variability, population movement and widespread distribution of Aedes mosquitoes contribute to continuing transmission. Four major DENV serotypes, DENV-1 to DENV-4, are recognized, and sequential infection with different serotypes may increase the risk of severe disease in some individuals.
Dengue commonly presents with sudden-onset fever, headache, retro-orbital pain, myalgia, arthralgia, nausea, vomiting and rash. Leukopenia and thrombocytopenia are frequently observed hematological abnormalities. Patients may develop warning signs such as persistent vomiting, abdominal pain, mucosal bleeding, fluid accumulation and a rapid decline in platelet count. Severe dengue is characterized by severe plasma leakage, severe bleeding and/or organ involvement.
Table 1: Major Clinical and Laboratory Features of Dengue
| Parameter | Major significance |
|---|---|
| Fever | Principal clinical manifestation |
| Platelet count | Monitoring of thrombocytopenia |
| Hematocrit | Assessment of hemoconcentration/plasma leakage |
| NS1 antigen | Early laboratory detection |
| IgM/IgG | Serological evidence of infection |
| Plasma leakage | Major feature of severe dengue |
| Severe bleeding | Important complication |
| Organ involvement | Criterion of severe disease |
Diagnosis depends on the stage of infection and may involve NS1 antigen detection, viral RNA detection and dengue-specific IgM/IgG antibody testing. Serial platelet count, complete blood count and hematocrit are also important for monitoring disease progression. Although thrombocytopenia is commonly associated with dengue, platelet count alone should not be considered an indicator of disease severity.
At present, dengue management is predominantly supportive because there is no universally available specific antiviral therapy. Treatment includes adequate hydration, rest, symptomatic management, clinical observation and timely recognition of warning signs. Paracetamol may be used for fever and pain, whereas aspirin and NSAIDs are generally avoided because of their potential to increase bleeding risk. Severe dengue may require carefully monitored intravenous fluid therapy and supportive critical care.
The limitations of conventional management have encouraged investigation of scientifically evaluated adjunctive therapeutic approaches. Medicinal plants have attracted interest because of their antioxidant, anti-inflammatory, immunomodulatory and potential antiviral properties. Among these, Carica papaya L. has received particular attention in dengue research because of its reported platelet-supportive potential. However, variations in plant material, extraction procedures, dosage and formulation can affect reproducibility and therapeutic performance.
Carica papaya leaves contain several phytochemical classes, including flavonoids, phenolic compounds, alkaloids, terpenoids, tannins, saponins and glycosides. Phenolic and flavonoid constituents are particularly relevant because of their antioxidant properties. Papaya leaf preparations have also been investigated for antioxidant, anti-inflammatory, immunomodulatory and potential platelet-supportive activities. Although several studies have reported improvements in platelet count, the evidence remains variable and further standardized investigation is required.
Table 2: Major Phytochemical Classes and Pharmacological Relevance of Carica papaya Leaves
| Phytochemical/activity | Relevance |
|---|---|
| Flavonoids | Antioxidant and potential anti-inflammatory activity |
| Phenolic compounds | Antioxidant/free-radical-scavenging activity |
| Alkaloids | Potential pharmacological activities |
| Terpenoids | Potential antioxidant and anti-inflammatory effects |
| Antioxidant activity | Reduction of oxidative stress |
| Anti-inflammatory activity | Modulation of inflammatory responses |
| Platelet-supportive activity | Potential support of platelet recovery |
| Antiviral potential | Investigated for possible anti-DENV activity |
Despite its pharmacological potential, crude herbal extracts may have limitations related to solubility, physicochemical stability, inconsistent incorporation and bioavailability of selected constituents. Therefore, an appropriate drug-delivery system may improve the pharmaceutical characteristics and delivery of plant-derived constituents. Microemulsions are attractive lipid-based systems composed of oil, water, surfactant and co-surfactant. Their small dispersed-domain size, large interfacial area, solubilization capacity and thermodynamic stability make them suitable for incorporation of compounds with different physicochemical characteristics.
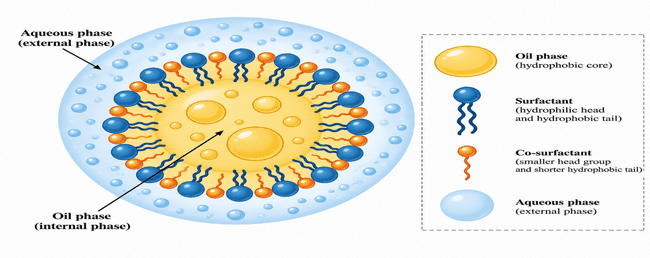
Figure 2: Schematic Representation of Microemulsion Showing Oil Phase, Aqueous Phase, Surfactant and Co-Surfactant.
Considering the reported pharmacological potential of C. papaya leaf extract and the formulation challenges associated with crude herbal preparations, a microemulsion-based delivery system may provide a rational approach for improving its pharmaceutical characteristics. Therefore, the present study was undertaken to formulate and evaluate a Carica papaya leaf extract-loaded microemulsion using MCT oil, Tween 80, propylene glycol and distilled water. The developed formulation was evaluated for physicochemical characteristics, in-vitro release, antioxidant activity, protein-denaturation inhibitory activity, dengue-related NS2B–NS3 protease inhibitory activity and stability.
MATERIALS AND METHODS
2.1 Materials
Fresh leaves of Carica papaya L. were collected from Varanasi, Uttar Pradesh, India, on 06 September 2026. Botanical authentication was carried out through Eytmo Institute.
The major chemicals and formulation components used in the study are presented in Table 7.
Table 7: Chemicals, Reagents and Formulation Components Used in the Study
| Material | Grade/Type | Application |
|---|---|---|
| Ethanol | Analytical grade | Extraction of C. papaya leaf constituents |
| Distilled water | Laboratory grade | Preparation of solutions |
| Methanol | HPLC grade | Chromatographic analysis |
| Phytochemical screening reagents | Analytical grade | Preliminary phytochemical screening |
| Tween 80 (Polysorbate 80) | Non-ionic surfactant | Emulsification and stabilization |
| Propylene glycol | Pharmaceutical grade | Co-surfactant and interfacial film flexibility |
| MCT oil | Suitable pharmaceutical/food grade | Oil phase and potential solubilization of extract constituents |
2.2 Instruments and Equipment
The instruments and equipment used for extraction, formulation development and characterization included Soxhlet extraction apparatus, rotary evaporator, analytical balance, hot-air oven, grinder, sieve, magnetic stirrer, vortex mixer, pH meter, digital viscometer, dynamic light scattering instrument, UV–Visible spectrophotometer, FTIR spectrometer, HPLC system, HPTLC system, centrifuge, laboratory refrigerator and stability chamber.
Table 8: Major Instruments and Equipment Used in the Study
| Instrument/Equipment | Application | Manufacturer/Brand |
|---|---|---|
| Soxhlet extraction apparatus | Extraction of plant constituents | Borosil/equivalent |
| Rotary evaporator | Concentration of plant extract | BUCHI/Heidolph |
| Analytical balance | Accurate weighing | Sartorius/Mettler Toledo |
| Hot-air oven | Controlled drying | Remi/equivalent |
| Mechanical grinder | Preparation of leaf powder | Laboratory equipment |
| Sieve | Powder-size standardization | Standard laboratory sieve |
| Magnetic stirrer with hot plate | Mixing of formulation components | IKA/Remi |
| Vortex mixer | Preliminary sample mixing | IKA/Remi |
| pH meter | Measurement of formulation pH | Eutech/Mettler Toledo |
| Digital viscometer | Measurement of viscosity | Brookfield/equivalent |
| DLS instrument | Droplet size and PDI measurement | Malvern Panalytical/equivalent |
| UV–Visible spectrophotometer | Spectrophotometric analysis | Shimadzu/Agilent |
| FTIR spectrometer | Functional-group characterization | Shimadzu/Bruker |
| HPLC system | Chromatographic/marker analysis | Shimadzu/Agilent/Waters |
| HPTLC system | Chromatographic fingerprinting | CAMAG |
| Centrifuge | Centrifugation-based assessment | Remi/Eppendorf |
| Stability chamber | Stability studies | Thermolab/equivalent |
2.3 Collection and Authentication of Plant Material
Fresh leaves of Carica papaya L. were collected from Varanasi, Uttar Pradesh, India, on 06 September 2026. The plant material was selected for development of the oral microemulsion. Botanical authentication was carried out through Eytmo Institute, and the authentication certificate was maintained as documentation.
2.4 Preparation of Carica papaya Leaf Powder
Fresh C. papaya leaves (350 g) were washed thoroughly with distilled water to remove adhering dust and surface impurities. The leaves were spread uniformly on clean drying trays and dried in a hot-air oven at 40°C for approximately 24 h until sufficiently dry and brittle. The dried leaves were cooled to room temperature and ground using a mortar and pestle. The powder was passed through a 40-mesh sieve to obtain a relatively uniform particle size. Approximately 80 g of prepared powder was obtained and stored in a clean, dry, airtight and light-resistant container until extraction.
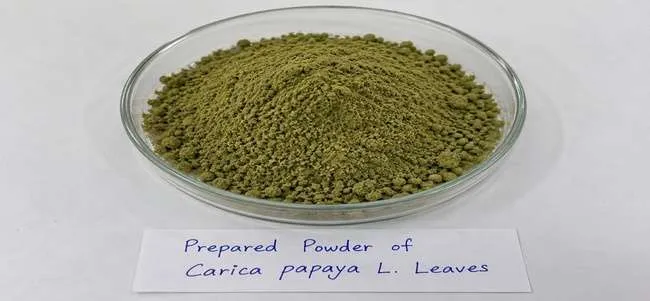
Figure 16: Prepared Powder of Carica papaya L. Leaves.
2.5 Extraction of Carica papaya Leaf
Soxhlet extraction was selected for extraction of phytoconstituents from powdered C. papaya leaves. Ethanol (95%) was used as the extraction solvent. Powdered leaf material (50 g) was extracted with 500 mL of 95% ethanol for 6 h, during which approximately eight Soxhlet cycles were recorded.
For extraction, 50 g of powdered leaf material was placed in a Soxhlet extraction thimble and positioned in the extraction chamber. The solvent flask was charged with 500 mL of 95% ethanol. The apparatus was assembled and the solvent was heated at a heating setting of 80°C to establish continuous reflux. The condensed ethanol repeatedly passed through the plant material and returned to the solvent flask through the siphoning process.
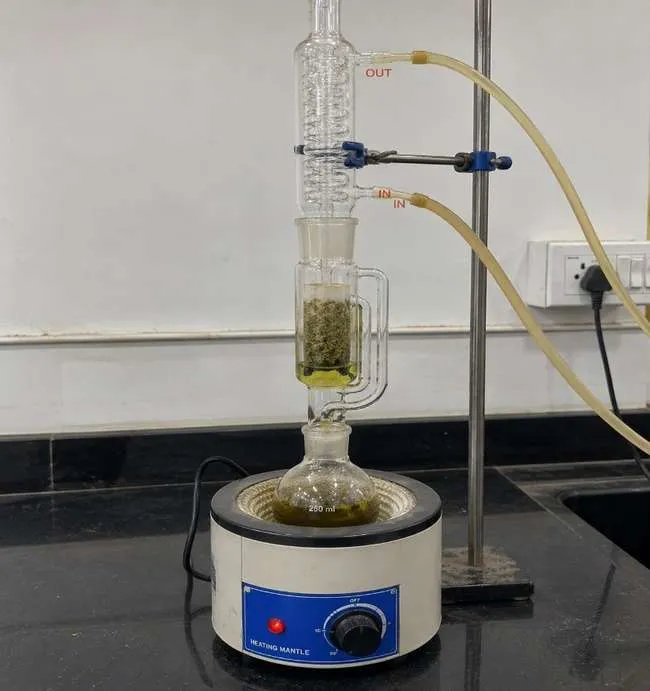
Figure 17: Soxhlet Extraction Apparatus Used for Carica papaya Leaf Extraction.
The extraction was continued for 6 h with approximately eight cycles. The heating setting was maintained at 80°C; the actual solvent temperature was not separately specified. Following extraction, the ethanolic extract was separated from the residual plant material and concentrated using a rotary evaporator under reduced pressure. The concentrated extract was dark green in appearance and yielded 7 g of dried extract.
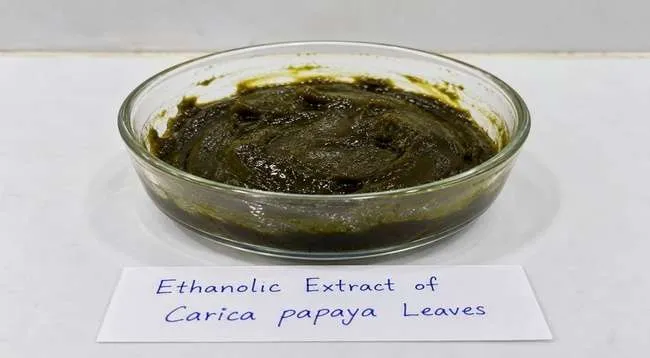
Figure 18: Ethanolic Extract of Carica papaya Leaves.
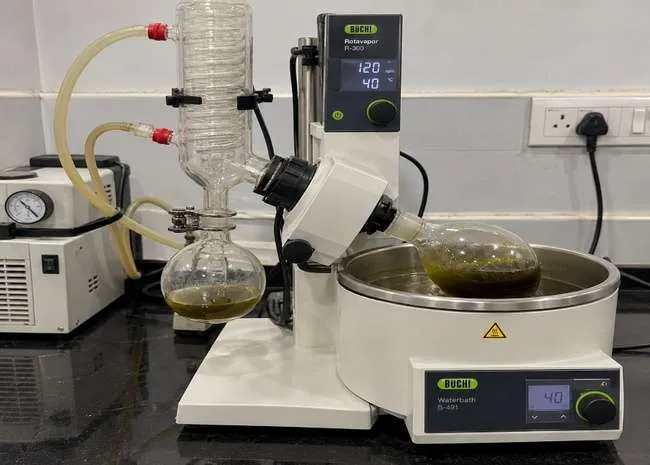
Figure 19: Concentration of Carica papaya Leaf Extract Using a Rotary Evaporator.
The percentage extraction yield was calculated using the following equation:
Extraction yield (% w/w) = Weight of dried extract ──────────────────────────── × 100 Weight of powdered plant material
The extraction of 50 g of powdered leaf material yielded 7 g of dried extract, corresponding to an extraction yield of 14% w/w.
2.6 Determination of Percentage Yield
The percentage yield of the ethanolic Carica papaya leaf extract was calculated from the weight of dried extract obtained relative to the initial weight of powdered leaves used for extraction.
Percentage Yield (%) = [Weight of Dried Extract (g) / Weight of Powdered Leaves (g)] × 100
Percentage Yield = (7 / 50) × 100
= 0.14 × 100
Percentage Yield = 14% w/w
Thus, the percentage yield of Carica papaya leaf extract was 14% w/w.
2.7 Preliminary Phytochemical Screening
The ethanolic extract of Carica papaya L. leaves was subjected to preliminary phytochemical screening to investigate the presence of alkaloids, flavonoids, phenolic compounds, tannins, saponins, terpenoids, glycosides, carbohydrates, proteins and free amino acids. Qualitative chemical tests were performed based on characteristic reactions of the respective phytochemical groups.
2.7.1 Preparation of Extract Solution
Dried ethanolic leaf extract (500 mg) was accurately weighed and dispersed in approximately 40 mL of distilled water. The preparation was transferred to a 50 mL volumetric flask and the volume was adjusted to 50 mL with distilled water. The preparation was filtered to remove insoluble particles and the filtrate was used for phytochemical screening. The nominal extract concentration was 10 mg/mL. As the ethanolic extract may contain water-insoluble constituents, the preparation was considered an aqueous extract dispersion followed by filtration rather than complete dissolution of the entire extract.
2.7.2 Qualitative Phytochemical Tests
A. Alkaloids – Dragendorff’s and Mayer’s Tests
Two millilitres of extract filtrate were separately treated with dilute hydrochloric acid, followed by Dragendorff’s reagent and Mayer’s reagent, respectively. Formation of an orange/reddish-brown precipitate with Dragendorff’s reagent or a cream/pale precipitate with Mayer’s reagent was considered a presumptive indication of alkaloid-like constituents.
B. Flavonoids – Alkaline Reagent Test
Two millilitres of extract filtrate were treated with 1% sodium hydroxide solution. Development of yellow coloration followed by its decrease or disappearance after addition of dilute hydrochloric acid was considered indicative of certain flavonoids.
C. Phenolic Compounds – Ferric Chloride Test
Two millilitres of extract filtrate were treated with 1% ferric chloride solution. Development of blue, blue-green, green or dark coloration was considered a presumptive indication of phenolic compounds.
D. Tannins – Ferric Chloride Test
Two millilitres of extract filtrate were treated with 1% ferric chloride solution and the resulting colour was recorded. Blue-black or green coloration was considered a presumptive indication of tannins. Since the ferric chloride reaction is not specific for tannins, the result was interpreted as a preliminary indication rather than definitive identification.
E. Saponins – Foam Test
Five millilitres of extract filtrate were mixed with 5 mL of distilled water and shaken vigorously for approximately 30 s. The preparation was allowed to stand for 10–15 min. Persistent foam was considered a presumptive indication of saponins.
F. Terpenoids – Salkowski Test
Approximately 2 mL of extract preparation were mixed with 2 mL of chloroform. Approximately 1 mL of concentrated sulfuric acid was carefully added along the inner wall of the tube to form a separate layer. Reddish-brown coloration at the interface was considered a preliminary indication of certain terpenoid-type constituents.
G. Glycosides – Keller–Kiliani Test
An aliquot of extract preparation was treated with glacial acetic acid containing a small amount of ferric chloride solution. Concentrated sulfuric acid was carefully added along the inner wall of the tube. A brownish ring at the interface, with possible bluish-green coloration in the upper layer, was considered indicative of certain cardiac glycosides containing characteristic deoxy sugars. The test was interpreted specifically as a preliminary test for certain cardiac glycosides rather than all glycosides.
H. Carbohydrates – Molisch’s Test
Two millilitres of extract filtrate were treated with Molisch’s reagent followed by careful addition of concentrated sulfuric acid along the inner wall of the tube. Formation of a violet or purple ring at the interface was considered indicative of carbohydrates.
I. Proteins and Free Amino Acids
For proteins, 2 mL of extract filtrate were treated with 5% sodium hydroxide solution followed by 1% copper sulfate solution. Violet or purple coloration was considered indicative of peptide bonds associated with proteins or peptides.
For free amino acids, 2 mL of extract filtrate were treated with 0.2% ninhydrin solution and heated in a controlled water bath according to the laboratory procedure. Purple or blue-violet coloration was considered indicative of many free amino acids, whereas certain amino acids such as proline may produce a yellowish colour.
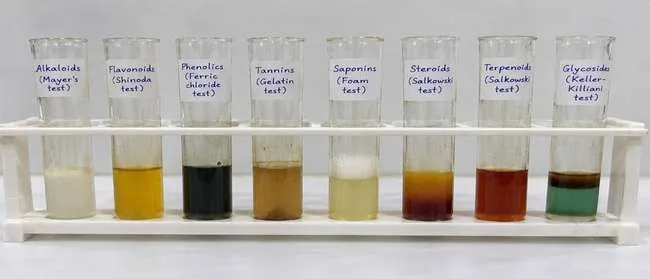
Figure 20: Preliminary Phytochemical Screening of Carica papaya Leaf Extract.
2.8 Physicochemical Evaluation of Carica papaya Leaf Powder and Ethanolic Extract
The dried Carica papaya leaf powder was evaluated for moisture content, total ash, acid-insoluble ash, water-soluble extractive value, and alcohol-soluble extractive value. The pH of the aqueous leaf-extract preparation and organoleptic characteristics of the ethanolic extract were also recorded.
2.8.1 Moisture Content
Moisture content was determined from the loss in weight of the dried leaf powder after drying. Approximately 5 g of sample was weighed before and after drying, with cooling in a desiccator before final weighing.
Moisture content (% w/w) = [(W₁ − W₂)/(W₁ − W₀)] × 100
where W₀ is the weight of the empty dish, W₁ is the weight of the dish with sample before drying, and W₂ is the weight after drying. The initial sample weight was 5.000 g and the weight loss was 0.400 g, giving a moisture content of 8.00% w/w.
2.8.2 Total Ash Value
Total ash was determined by incinerating 2 g of dried leaf powder in a clean, pre-weighed crucible until the residue was free from visible carbonaceous matter. After cooling in a desiccator, the crucible was weighed.
Total ash (% w/w) = (Weight of ash/Weight of sample) × 100
The ash weight was 0.180 g, corresponding to a total ash value of 9.00% w/w.
2.8.3 Acid-Insoluble Ash
The ash residue was treated with dilute hydrochloric acid, and the insoluble fraction was collected on ashless filter paper, washed, ignited, cooled, and weighed. Based on an initial sample weight of 2 g, the acid-insoluble ash weight was 0.030 g, corresponding to 1.50% w/w.
2.8.4 Water-Soluble Extractive Value
Five grams of dried leaf powder was extracted with 100 mL distilled water. A 25 mL aliquot of the filtrate was evaporated to dryness and weighed.
Water-soluble extractive (% w/w) = [(R × V)/(v × W)] × 100
where R is the dried residue, V is the total solvent volume, v is the aliquot volume, and W is the initial sample weight. The calculated water-soluble extractive value was 18.00% w/w.
2.8.5 Alcohol-Soluble Extractive Value
Five grams of dried leaf powder was extracted with 100 mL of 95% ethanol, and a 25 mL filtrate aliquot was evaporated to dryness.
Alcohol-soluble extractive (% w/w) = [(R × V)/(v × W)] × 100
The dried residue was 0.1875 g, giving an alcohol-soluble extractive value of 15.00% w/w.
2.8.6 pH of Aqueous Leaf-Extract Preparation
One gram of leaf-extract sample was dispersed or dissolved in 10 mL distilled water, mixed thoroughly, and evaluated using a calibrated pH meter. The measured pH was 6.00, indicating a slightly acidic preparation under the stated conditions.
2.8.7 Organoleptic Characteristics
The ethanolic extract was dark green in colour. Appearance and consistency were recorded according to the physical characteristics observed for the actual sample.
Table 9: Physicochemical Evaluation of Carica papaya Leaf Powder and Ethanolic Extract
| Parameter | Observed value |
|---|---|
| Moisture content | 8.00% w/w |
| Total ash value | 9.00% w/w |
| Acid-insoluble ash | 1.50% w/w |
| Water-soluble extractive value | 18.00% w/w |
| Alcohol-soluble extractive value | 15.00% w/w |
| pH of aqueous leaf-extract preparation | 6.00 |
| Ethanolic extract colour | Dark green |
2.9 Preliminary Instrumental Characterization
The dried ethanolic extract was subjected to preliminary UV-Visible and FTIR characterization to obtain information on its absorption characteristics and functional groups prior to incorporation into the microemulsion.
2.9.1 UV-Visible Spectroscopy
The dried ethanolic extract was prepared in ethanol at a working concentration of 10 µg/mL. The sample was analysed over the 200–400 nm range, and the wavelength of maximum absorption (λmax) and corresponding absorbance were recorded from the obtained spectrum.
2.9.2 FTIR Analysis
FTIR spectroscopy was used for preliminary identification of functional groups present in the dried C. papaya leaf extract. The extract was analysed using the method and instrumental conditions employed in the study, with the commonly used spectral range of 4000–400 cm⁻¹.
2.10 Selection of Microemulsion Components
MCT oil, Tween 80, and propylene glycol were selected as the oil, surfactant, and co-surfactant, respectively, based on their intended formulation roles and compatibility with the C. papaya leaf extract. Preliminary visual solubility assessment was performed to compare the apparent solubilization behaviour of the extract in these components.
2.10.1 Solubility Studies
The dried ethanolic extract (50 mg) was separately mixed with 1 mL each of MCT oil, Tween 80, and propylene glycol. The samples were vortex-mixed for approximately 2 min and maintained at 25 ± 2°C for 24 h. Where applicable, gentle shaking at approximately 100 rpm and centrifugation at approximately 10,000 rpm for 10 min were performed.
The samples were examined immediately after mixing and after 24 h for colour, uniformity, apparent dissolution, turbidity, suspended particles, and sediment formation. Each component was evaluated in triplicate (n = 3).
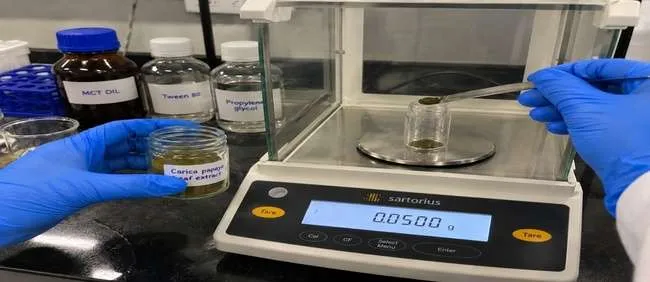
Figure 21: Weighing of Dried Carica papaya Leaf Extract for Solubility Studies.
Table 10: Experimental Conditions for Solubility Studies
| Parameter | Experimental condition |
|---|---|
| Test sample | Dried ethanolic C. papaya leaf extract |
| Extract quantity | 50 mg |
| MCT oil | 1 mL |
| Tween 80 | 1 mL |
| Propylene glycol | 1 mL |
| Temperature | 25 ± 2°C |
| Initial mixing | Vortex mixing, approximately 2 min |
| Equilibration period | 24 h |
| Shaking | Approximately 100 rpm, where used |
| Centrifugation | Approximately 10,000 rpm for 10 min, where performed |
| Replicates | n = 3 |
| Observation | Immediately after mixing and after 24 h |
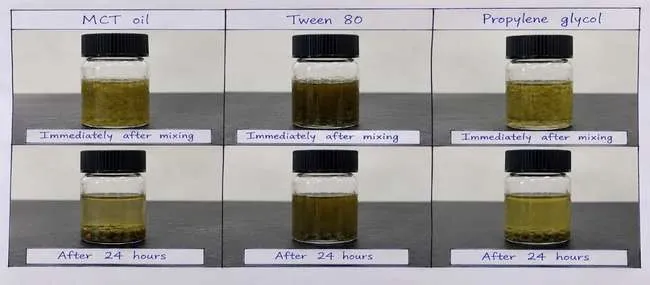
Figure 22: Visual Appearance of Carica papaya Leaf Extract in Selected Microemulsion Components Immediately After Mixing and After 24 Hours.
2.11 Construction of Pseudoternary Phase Diagram
A pseudoternary phase diagram was constructed to evaluate the effect of component proportions on microemulsion formation using MCT oil as the oil phase, Tween 80 as the surfactant, propylene glycol as the co-surfactant, and distilled water as the aqueous phase. Tween 80 and propylene glycol were combined to form the surfactant–co-surfactant mixture (Smix).
2.11.1 Preparation of Smix
Four Tween 80 glycol ratios (1:1, 2:1, 3:1, and 1:2) were evaluated to investigate their influence on phase behaviour.
Table 11: Smix Ratios Evaluated for Pseudoternary Phase Diagram Construction
| Batch | Tween 80 glycol | Purpose |
|---|---|---|
| S1 | 1:1 | Evaluation of equal proportions |
| S2 | 2:1 | Evaluation of higher surfactant proportion |
| S3 | 3:1 | Evaluation of further increase in surfactant proportion |
| S4 | 1:2 | Evaluation of higher co-surfactant proportion |
2.11.2 Preparation of Oil–Smix Mixtures
Different MCT oil-to-Smix ratios ranging from 1:9 to 9:1 were evaluated. The resulting mixtures were assessed for homogeneity and their suitability for subsequent aqueous-phase titration.
2.11.3 Aqueous-Phase Titration
Distilled water was added gradually to the oil–Smix mixtures under continuous mixing. The resulting systems were visually evaluated for clarity, homogeneity, turbidity, and visible phase separation. The observed phase behaviour was recorded to identify composition ranges suitable for further microemulsion development.
2.11.4 Construction and Comparative Evaluation of Phase Diagrams
The composition and phase-behaviour data obtained during screening were plotted manually using Microsoft Excel, with MCT oil, Smix, and distilled water represented as the three principal components. The phase diagrams obtained at the four Smix ratios were compared based on the distribution of the shaded region and the observed clarity and homogeneity of the tested compositions.
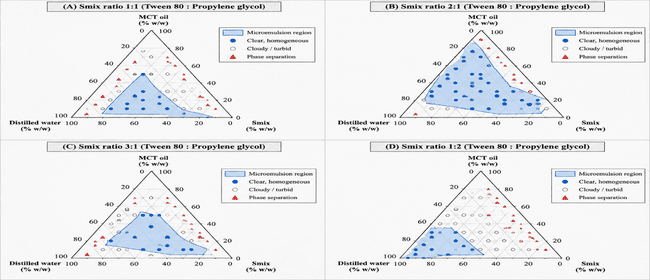
Figure 23: Pseudoternary Phase Diagrams of MCT Oil, Tween 80–Propylene Glycol Smix, and Distilled Water at Different Smix Ratios.
Table 12: Comparative Evaluation of Pseudoternary Phase Diagrams at Different Smix Ratios
| Panel | Smix ratio | Observed characteristics | Interpretation |
|---|---|---|---|
| A | 1:1 | Limited shaded region | Potential microemulsion-forming compositions identified |
| B | 2:1 | Comparatively broader shaded region with more clear and homogeneous composition points | Comparatively broader potential microemulsion region |
| C | 3:1 | Shaded region present with different distribution | Phase behaviour varied with Smix ratio |
| D | 1:2 | Relatively restricted region concentrated toward the water-rich side | Comparatively limited potential microemulsion region |
Based on the observed phase behaviour, the 2:1 Tween 80 glycol ratio was selected as the preliminary Smix ratio for subsequent formulation development because it exhibited a comparatively broader shaded region and a greater number of clear, homogeneous composition points.
Table 13: Selected Components and Smix Ratio for Further Formulation Development
| Parameter | Selected condition |
|---|---|
| Oil phase | MCT oil |
| Surfactant | Tween 80 |
| Co-surfactant | Propylene glycol |
| Selected Smix ratio | 2:1 |
| Aqueous phase | Distilled water |
| Diagram preparation | Microsoft Excel |
| Basis of selection | Observed phase behaviour during screening |
2.12 Formulation of Carica papaya Leaf Extract-Loaded Microemulsion
The microemulsion was formulated using dried ethanolic C. papaya leaf extract as the plant-derived active ingredient, MCT oil as the oil phase, Tween 80 as the surfactant, propylene glycol as the co-surfactant, and distilled water as the aqueous phase. The selected Tween 80 glycol Smix ratio was 2:1.
A 5 g formulation batch containing 0.05 g of dried C. papaya leaf extract was prepared. The components were mixed by magnetic stirring at 500 rpm for 30 min.
2.12.1 Preparation Method
Tween 80 and propylene glycol were first combined in a 2:1 ratio to prepare the Smix. The required quantity of MCT oil was then incorporated and mixed uniformly. Dried C. papaya leaf extract (0.05 g) was added to the oil–Smix mixture, followed by dropwise addition of distilled water (2.20 g) under continuous mixing. The formulation was subsequently stirred at 500 rpm for 30 min to obtain the final 5 g batch.
2.12.2 Formulation Composition
The final formulation contained 1% w/w dried C. papaya leaf extract. The complete composition is presented in Table 14.
Table 14: Final Composition of Carica papaya Leaf Extract-Loaded Microemulsion
| Sr. No. | Ingredient | Function | Quantity (g) | Composition (% w/w) |
|---|---|---|---|---|
| 1 | Dried C. papaya leaf extract | Active plant extract | 0.05 | 1 |
| 2 | MCT oil | Oil phase | 0.50 | 10 |
| 3 | Tween 80 | Surfactant | 1.50 | 30 |
| 4 | Propylene glycol | Co-surfactant | 0.75 | 15 |
| 5 | Distilled water | Aqueous phase | 2.20 | 44 |
| Total | 5.00 | 100 |
The formulation therefore contained 50 mg of dried plant extract in a total batch weight of 5 g, corresponding to 1% w/w. The Tween 80 glycol ratio was 2:1.
2.12.3 Preliminary Selection of Formulation Variables
Pseudoternary phase diagrams prepared using Tween 80 glycol ratios of 1:1, 2:1, 3:1, and 1:2 were compared according to their observed phase behaviour. The 2:1 ratio exhibited a comparatively broader shaded region and was therefore selected as the preliminary candidate for preparation of the 5 g formulation.
The selected batch consisted of 0.05 g C. papaya leaf extract, 0.50 g MCT oil, 1.50 g Tween 80, 0.75 g propylene glycol, and 2.20 g distilled water. Magnetic stirring was performed at 500 rpm for 30 min.
The 2:1 Smix ratio was considered the preliminary selected ratio based on phase-diagram screening; the shaded-region size alone was not considered sufficient to establish the final optimum formulation. Further physicochemical and stability evaluation was required to assess formulation suitability.
2.13 Evaluation of Prepared Carica papaya Leaf Extract-Loaded Microemulsion
The prepared Carica papaya leaf extract-loaded microemulsion was evaluated for physical appearance, clarity, pH, droplet size, polydispersity index (PDI), zeta potential, viscosity, conductivity, refractive index, UV–Visible characteristics, and physical stability.
2.13.1 Physical Appearance and Clarity
The formulation was visually examined under adequate lighting in a transparent container for colour, homogeneity, visible particulate matter, sedimentation, and phase separation. Clarity was assessed qualitatively based on the presence or absence of visible cloudiness and recorded as clear, slightly cloudy, or cloudy.
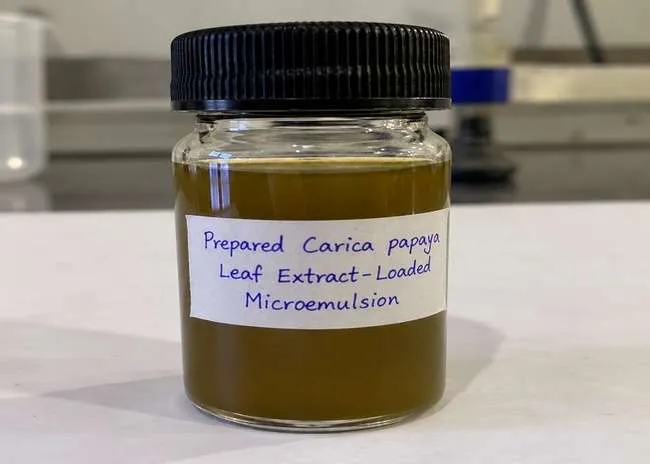
Figure 24: Visual Appearance of the Prepared Carica papaya Leaf Extract-Loaded Microemulsion.
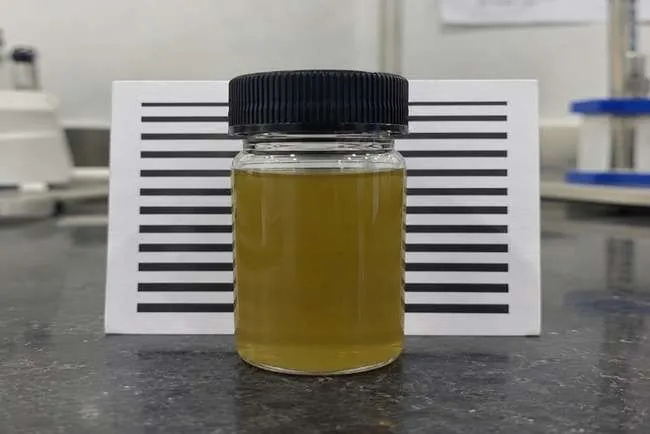
Figure 25: Visual Assessment of Clarity of the Prepared Carica papaya Leaf Extract-Loaded Microemulsion.
2.13.2 pH
The pH of the undiluted formulation was measured using a calibrated pH meter. The reading was recorded after obtaining a stable value and used as the initial baseline for subsequent stability assessment.
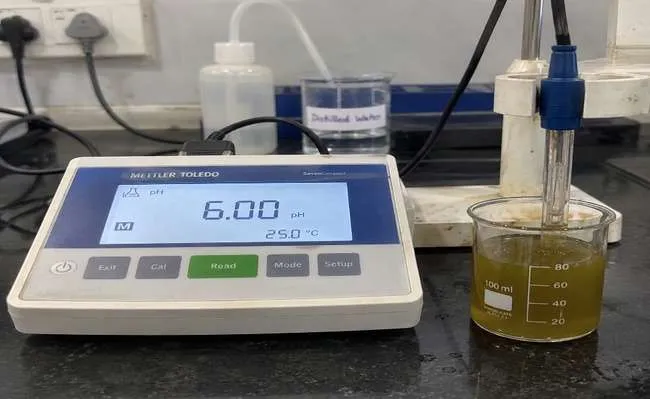
Figure 26: Measurement of the Initial pH of the Prepared Carica papaya Leaf Extract-Loaded Microemulsion.
2.13.3 Droplet Size and Polydispersity Index
Droplet size and PDI were determined by dynamic light scattering (DLS) using a Malvern Panalytical Zetasizer Nano ZS. Droplet size was expressed as hydrodynamic diameter, while PDI was used to assess the breadth and uniformity of the droplet-size distribution.
2.13.4 Zeta Potential
Zeta potential was determined by electrophoretic light scattering using a Malvern Panalytical Zetasizer Nano ZS. The electrokinetic potential of the dispersed droplets was recorded in millivolts (mV) to characterize the surface charge of the formulation.
2.13.5 Viscosity
Viscosity was measured using a Brookfield DV2T rotational viscometer equipped with an RV-2 spindle. The measurement was performed at 50 rpm and a sample temperature of 25 ± 5°C. The viscosity was recorded in mPa·s.
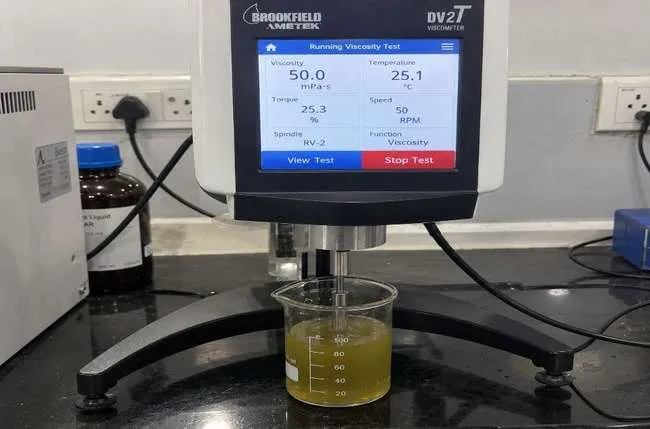
Figure 27: Viscosity Measurement of the Prepared Carica papaya Leaf Extract-Loaded Microemulsion Using a Brookfield DV2T Rotational Viscometer.
2.13.6 Conductivity
Electrical conductivity was measured using a Mettler Toledo SevenCompact S230 conductivity meter. The probe was immersed in the formulation, and the reading was recorded in µS/cm after stabilization.
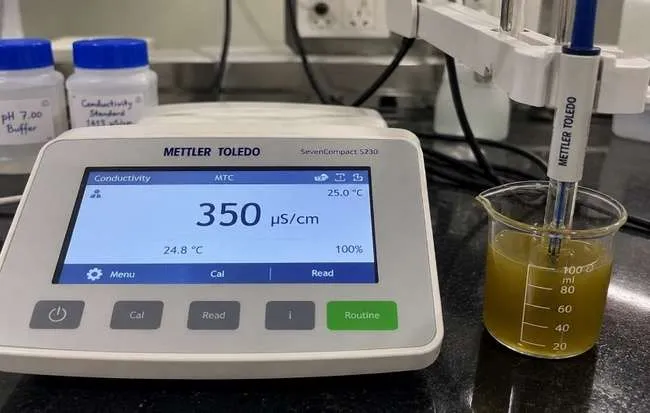
Figure 28: Conductivity Measurement of the Prepared Carica papaya Leaf Extract-Loaded Microemulsion.
2.13.7 Refractive Index
The refractive index was determined using an ATAGO RX-5000α digital refractometer. A suitable quantity of formulation was placed on the measuring prism, and the reading was recorded at 25°C after stabilization.
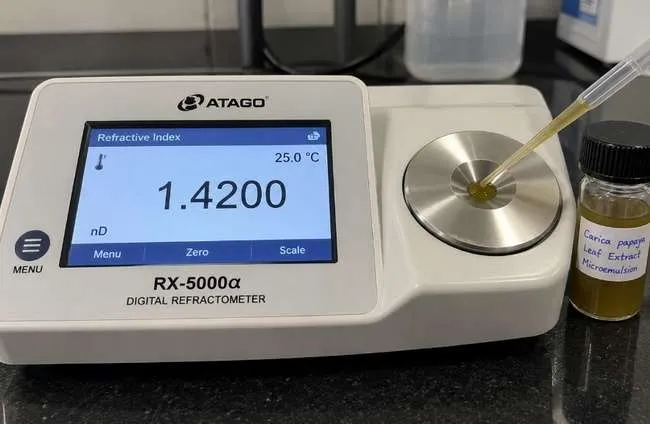
Figure 29: Refractive Index Measurement of the Prepared Carica papaya Leaf Extract-Loaded Microemulsion.
2.13.8 UV–Visible Analysis
UV–Visible analysis was performed using a Shimadzu UV-1800 double-beam spectrophotometer. A suitable dilution of the formulation was prepared and scanned over 200–400 nm at room temperature. The absorption spectrum and wavelength of maximum absorption (λmax) were recorded.
2.13.9 Thermodynamic Stability
Physical stability was assessed by storing the formulation in a closed container at room temperature for three months. The formulation was periodically examined for changes in appearance, clarity, phase separation, and sedimentation, while pH was monitored during storage.
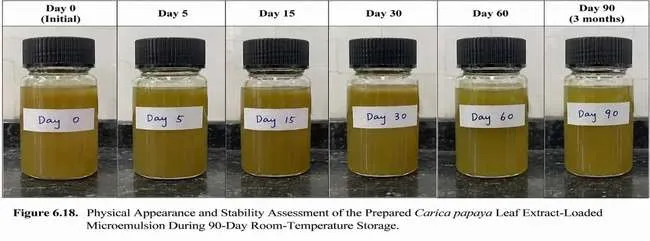
Figure 30: Physical Appearance and Stability Assessment of the Prepared Carica papaya Leaf Extract-Loaded Microemulsion During 90-Day Room-Temperature Storage.
2.13.10 Centrifugation Test
The formulation was centrifuged at 3,000 rpm for 30 min using a REMI C-24 BL centrifuge. After centrifugation, the sample was visually examined for changes in appearance, phase separation, and sedimentation.
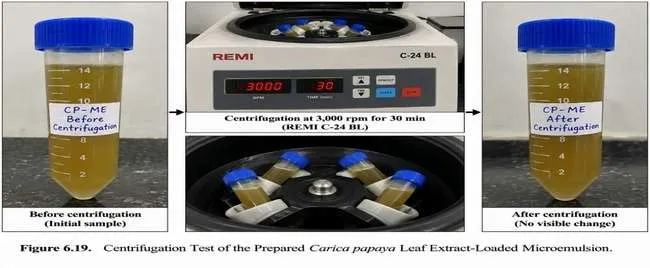
Figure 31: Centrifugation Test of the Prepared Carica papaya Leaf Extract-Loaded Microemulsion.
2.13.11 Heating–Cooling Cycle
The formulation was subjected to alternating temperatures of 4°C and 40°C, with a holding period of 48 h at each temperature, for six cycles. Following completion of the cycles, the formulation was examined for changes in appearance, clarity, phase separation, and sedimentation.
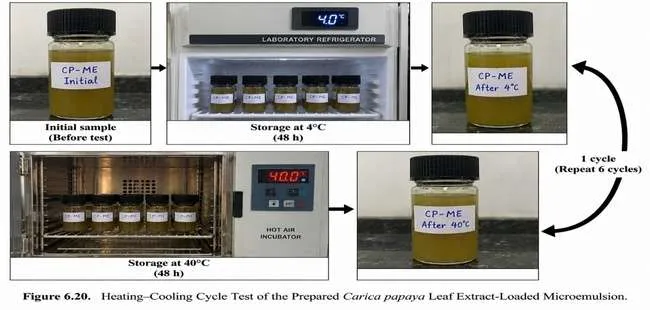
Figure 32: Heating–Cooling Cycle Test of the Prepared Carica papaya Leaf Extract-Loaded Microemulsion.
2.13.12 Freeze–Thaw Cycle
For freeze–thaw testing, the formulation was subjected to freezing at −20°C and thawing at 25°C for three cycles. The formulation was subsequently examined for changes in appearance, clarity, phase separation, and sedimentation.
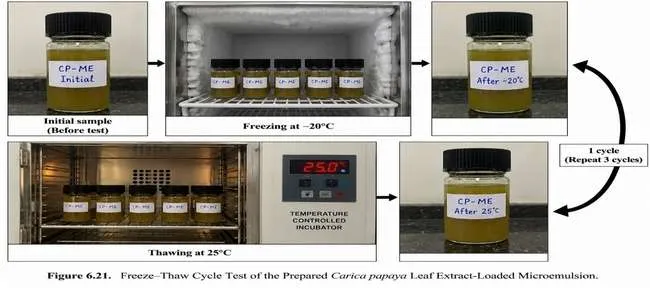
Figure 33: Freeze–Thaw Cycle Test of the Prepared Carica papaya Leaf Extract-Loaded Microemulsion.
2.14 In-vitro Marker Release Study
The in-vitro marker release profile of the Carica papaya leaf extract-loaded microemulsion was evaluated using a Franz diffusion cell fitted with a dialysis membrane having a molecular weight cut-off of 12–14 kDa. The receptor compartment contained 20 mL phosphate buffer (pH 6.8), maintained at 37 ± 0.5°C with continuous stirring at 100 rpm. One millilitre of the prepared formulation was placed in the donor compartment.
Samples were withdrawn at 0, 1, 2, 4, 6, 8, 12, and 24 h and replaced with an equal volume of fresh receptor medium maintained at the same temperature. The released marker was quantified using a Shimadzu UV-1800 UV–Visible spectrophotometer at 273 nm. Concentration was calculated from the calibration equation:
A = 0.0325C + 0.0048
where A is absorbance and C is marker concentration. The calibration curve showed an R² value of 0.9987. The study was performed in triplicate (n = 3), and cumulative marker release was calculated at each sampling interval.
2.15 Release Kinetic Analysis
The release data were fitted to zero-order, first-order, Higuchi, and Korsmeyer–Peppas mathematical models. For zero-order kinetics, cumulative percentage release was plotted against time, whereas first-order analysis was performed using the percentage of marker remaining to be released versus time. For the Higuchi model, cumulative percentage release was plotted against the square root of time.
For the Korsmeyer–Peppas model, log fractional release (Mt/M∞) was plotted against log time, with the initial portion corresponding to approximately 60% cumulative release considered for analysis. The slope represented the release exponent (n). The coefficient of determination (R²) obtained for each model was compared to identify the model providing the best fit to the observed release profile.
2.16 In-vitro Pharmacological Evaluation
The prepared C. papaya leaf extract-loaded microemulsion was evaluated for antioxidant, anti-inflammatory, and dengue-related biological activity. Antioxidant activity was assessed using the DPPH radical-scavenging assay, anti-inflammatory activity using the BSA protein-denaturation inhibition assay, and dengue-related activity using an NS2B–NS3 protease inhibition assay.
2.16.1 Antioxidant Activity by DPPH Assay
Antioxidant activity was evaluated using the DPPH (2,2-diphenyl-1-picrylhydrazyl) radical-scavenging assay, with ascorbic acid as the standard. The formulation was evaluated at concentrations of 25, 50, 100, 200, and 400 µg/mL. The percentage inhibition was calculated as:
% Inhibition = [(A₀ − A₁)/A₀] × 100
where A₀ is the absorbance of the control and A₁ is the absorbance of the test sample. The IC₅₀ value was determined as the concentration producing 50% inhibition of DPPH radicals.
2.16.2 Anti-inflammatory Activity by BSA Protein-Denaturation Assay
Anti-inflammatory activity was evaluated using the BSA protein-denaturation inhibition assay, with diclofenac sodium as the standard. The formulation was tested at 25, 50, 100, 200, and 400 µg/mL. Percentage inhibition of protein denaturation was calculated using:
% Inhibition = [(A₀ − A₁)/A₀] × 100
where A₀ represents the control absorbance and A₁ represents the absorbance of the test sample.
2.16.3 Dengue-Related Biological Evaluation
Dengue-related biological activity was evaluated using an NS2B–NS3 protease inhibition assay with recombinant dengue virus NS2B–NS3 protease as the biological target. A reference NS2B–NS3 protease inhibitor was considered as the standard. The formulation was evaluated at 25, 50, 100, 200, and 400 µg/mL, and concentration-dependent inhibition was determined. The IC₅₀ value was used to indicate the concentration required to achieve approximately 50% inhibition of the selected protease target.
2.17 Accelerated Stability Study
The selected C. papaya leaf extract-loaded microemulsion was evaluated under accelerated storage conditions at 40 ± 2°C/75 ± 5% RH for 3 months. The formulation was filled into sealed amber glass vials and evaluated at 0, 30, 60, and 90 days.
Physical characteristics including appearance, colour, homogeneity, clarity, phase separation, and sedimentation were monitored along with pH, droplet size, PDI, zeta potential, viscosity, conductivity, and drug/marker content. The values obtained during storage were compared with the initial values to assess changes in formulation characteristics.
Table 15: Conditions Used for Accelerated Stability Study of the Selected Carica papaya Leaf Extract-Loaded Microemulsion
| Parameter | Specification |
|---|---|
| Study type | Accelerated stability study |
| Storage condition | 40 ± 2°C / 75 ± 5% RH |
| Duration | 3 months |
| Sample quantity | 3 sealed containers |
| Container | Amber glass vial with tight/airtight closure |
| Stability equipment | Temperature- and humidity-controlled stability chamber |
| Stability chamber | BINDER KBF series |
| Sampling intervals | 0, 30, 60 and 90 days |
| Parameters evaluated | Appearance, colour, homogeneity, clarity, phase separation, sedimentation, pH, droplet size, PDI, zeta potential, viscosity, conductivity and drug/marker content |
2.17.1 Evaluation During Stability Study
The selected formulation was periodically evaluated at 0, 30, 60, and 90 days under accelerated storage conditions. The physical and physicochemical observations obtained during the study were compared with the initial formulation characteristics.
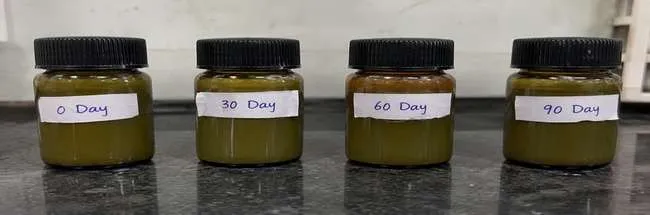
Figure 34: Physical Appearance of the Selected Carica papaya Leaf Extract-Loaded Microemulsion During Accelerated Stability Study at 40 ± 2°C/75 ± 5% RH.
RESULTS AND DISCUSSION
3.1 Preliminary Phytochemical Screening
Preliminary phytochemical screening of the ethanolic Carica papaya leaf extract indicated the presence of alkaloids, flavonoids, phenolic compounds, tannins, saponins, terpenoids, carbohydrates, and amino acids, whereas glycosides were reported as absent under the test conditions. These findings indicate the presence of diverse classes of secondary metabolites in the extract, supporting its further evaluation for formulation development and biological activity. The qualitative screening provides preliminary evidence of phytochemical groups but does not establish the concentration, purity, or individual identity of the constituents. Pasted text
Table 16: Preliminary Phytochemical Screening of Carica papaya Leaf Extract
| Sr. No. | Phytochemical constituent | Test | Result |
|---|---|---|---|
| 1 | Alkaloids | Dragendorff’s / Mayer’s | Present |
| 2 | Flavonoids | Alkaline reagent / Lead acetate | Present |
| 3 | Phenolic compounds | Ferric chloride | Present |
| 4 | Tannins | Ferric chloride | Present |
| 5 | Saponins | Foam test | Present |
| 6 | Terpenoids | Salkowski test | Present |
| 7 | Glycosides | Borntrager’s test | Absent |
| 8 | Carbohydrates | Molisch’s test | Present |
| 9 | Amino acids | Ninhydrin test | Present |
3.2 Physicochemical Evaluation and Characterization of Extract
The dried C. papaya leaf powder showed a moisture content of 8.00% w/w, total ash of 9.00% w/w, and acid-insoluble ash of 1.50% w/w. The water-soluble and alcohol-soluble extractive values were 18.00% and 15.00% w/w, respectively. The aqueous leaf-extract preparation showed a pH of 6.00, while the ethanolic extract was dark green in colour. These parameters provide preliminary quality-control characteristics of the plant material and extract. Pasted text
Table 17: Physicochemical Evaluation of Carica papaya Leaf Powder and Ethanolic Extract
| Parameter | Result |
|---|---|
| Moisture content | 8.00% w/w |
| Total ash value | 9.00% w/w |
| Acid-insoluble ash | 1.50% w/w |
| Water-soluble extractive value | 18.00% w/w |
| Alcohol-soluble extractive value | 15.00% w/w |
| pH | 6.00 |
| Extract colour | Dark green |
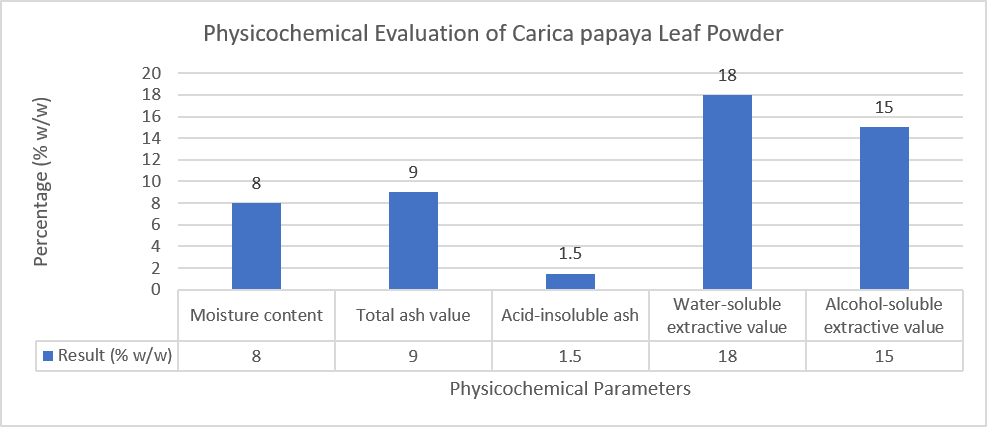
Figure 35: Graphical Representation of Physicochemical Parameters of Carica papaya Leaf Powder.
UV–Visible analysis showed a maximum absorption at 275 nm with an absorbance of 0.313. FTIR analysis demonstrated characteristic absorption bands corresponding to O–H, aliphatic C–H, carbonyl, C=C/aromatic, and C–O/C–O–C functional groups, supporting the presence of different oxygenated and organic structural features in the extract. Pasted text
Table 18: UV–Visible and FTIR Characterization of Carica papaya Leaf Extract
| Characterization | Observation |
|---|---|
| UV λmax | 275 nm |
| UV absorbance | 0.313 |
| O–H stretching | 3390–3421 cm⁻¹ |
| Aliphatic C–H stretching | 2923–2924 cm⁻¹ |
| C–H stretching | 2851–2856 cm⁻¹ |
| C=O stretching | 1730–1737 cm⁻¹ |
| C=C / overlapping vibrations | 1612–1637 cm⁻¹ |
| C–H bending / aromatic vibrations | 1401–1452 cm⁻¹ |
| C–O stretching | 1240–1279 cm⁻¹ |
| C–O / C–O–C vibrations | 1035–1057 cm⁻¹ |
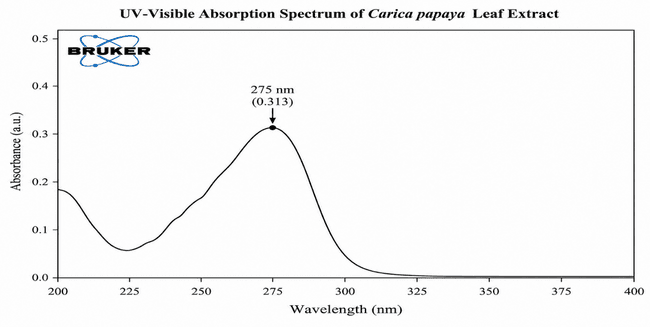
Figure 36: UV–Visible Absorption Spectrum of Ethanolic Extract of Carica papaya L. Leaves.
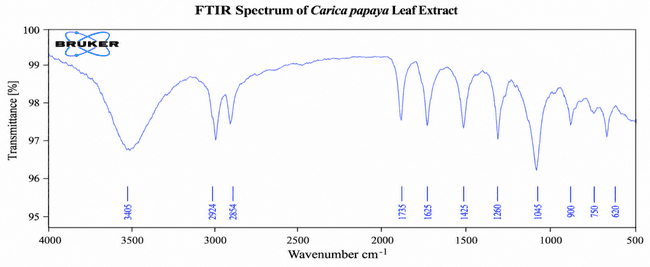
Figure 37: FTIR Spectrum of Ethanolic Extract of Carica papaya L. Leaves.
3.3 Solubility Assessment
The extract exhibited different apparent solubilization behaviours in the selected formulation components. MCT oil showed suspended or undissolved particles, whereas Tween 80 produced a comparatively uniform mixture with some residual particles. Propylene glycol showed a greenish-brown solution or slightly cloudy mixture, with some insoluble material remaining after 24 h. These observations supported the selection of MCT oil, Tween 80, and propylene glycol for further microemulsion development, although visual assessment alone does not establish quantitative solubility. Pasted text
Table 19: Visual Solubility Assessment of Carica papaya Leaf Extract
| Component | Observation after 24 h | Interpretation |
|---|---|---|
| MCT oil | Sediment/undissolved particles | Limited apparent solubilization |
| Tween 80 | Comparatively uniform with some sediment | Improved dispersion |
| Propylene glycol | Slightly cloudy with some residual particles | Solubilization of certain constituents |
3.4 Evaluation of Prepared Microemulsion
The prepared microemulsion showed a greenish-brown and uniform appearance without visible particulate matter, sedimentation, or phase separation. The formulation was slightly cloudy rather than completely transparent. The initial pH was 6.0, indicating a slightly acidic formulation close to neutrality. Pasted text
The DLS analysis recorded a mean droplet size of 85 nm with a PDI of 0.203, indicating a nanoscale dispersed system with a relatively narrow droplet-size distribution. The zeta potential was −19.8 mV, indicating a negative electrokinetic potential. Together with the use of non-ionic Tween 80, these findings provide supportive physicochemical characteristics of the dispersed system, although they should not independently be considered proof of long-term stability. Pasted text
Table 20: Physicochemical Characteristics of the Prepared Carica papaya Leaf Extract-Loaded Microemulsion
| Parameter | Result |
|---|---|
| Colour | Greenish-brown |
| General appearance | Uniform |
| Visible particulate matter | Not observed |
| Sedimentation | Not observed |
| Phase separation | Not observed |
| Clarity | Slightly cloudy |
| pH | 6.0 |
| Mean droplet size | 85 nm |
| PDI | 0.203 |
| Zeta potential | −19.8 mV |
| Viscosity | 50 mPa·s |
| Conductivity | 350 µS/cm |
| Refractive index | 1.42 |
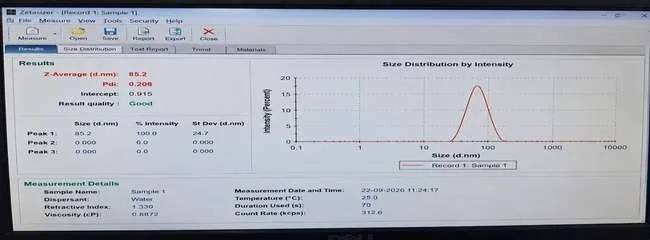
Figure 38: Droplet-Size Distribution of the Prepared Carica papaya Leaf Extract-Loaded Microemulsion.
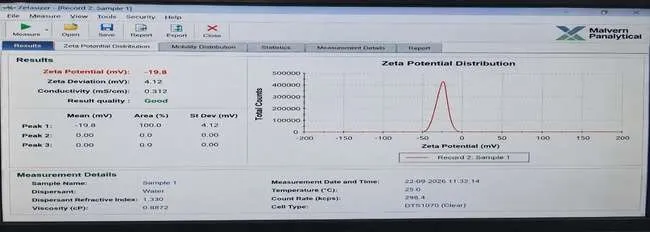
Figure 39: Zeta Potential Distribution of the Prepared Carica papaya Leaf Extract-Loaded Microemulsion.
The viscosity of the formulation was 50 mPa·s at 25 ± 5°C using an RV-2 spindle at 50 rpm. Conductivity was 350 µS/cm, indicating measurable electrical conductivity, while the refractive index was 1.42 at 25°C. These parameters further describe the physicochemical characteristics of the formulation and should be interpreted collectively rather than as independent indicators of microemulsion stability. Pasted text
3.5 Further Physicochemical Evaluation of the Prepared Microemulsion
The prepared Carica papaya leaf extract-loaded microemulsion exhibited a viscosity of 50 mPa·s at 25 ± 5°C, measured using an RV-2 spindle at 50 rpm. The electrical conductivity was 350 µS/cm, while the refractive index was 1.42 at 25°C. These parameters reflected the physicochemical characteristics of the formulation and were considered together with the pH, droplet size, PDI, and other stability-related observations.
Table 21: Viscosity of the Prepared Carica papaya Leaf Extract-Loaded Microemulsion
| Parameter | Observation |
|---|---|
| Instrument | Brookfield DV2T rotational viscometer |
| Spindle | RV-2 |
| Rotational speed | 50 rpm |
| Temperature | 25 ± 5°C |
| Viscosity | 50 mPa·s |
Table 22: Conductivity of the Prepared Carica papaya Leaf Extract-Loaded Microemulsion
| Parameter | Observation |
|---|---|
| Instrument | Mettler Toledo SevenCompact S230 |
| Evaluation | Electrical conductivity |
| Conductivity | 350 µS/cm |
Table 23: Refractive Index of the Prepared Carica papaya Leaf Extract-Loaded Microemulsion
| Parameter | Observation |
|---|---|
| Instrument | ATAGO RX-5000α |
| Measurement temperature | 25°C |
| Refractive index | 1.42 |
3.6 UV–Visible Analysis of the Prepared Microemulsion
The prepared microemulsion exhibited a maximum absorption (λmax) at 273 nm, with an absorbance of 0.45 AU. The observed absorption peak provided a characteristic spectral response of the formulation and may be associated with UV-absorbing phytoconstituents present in the C. papaya leaf extract. However, the spectrum alone does not establish the identity or concentration of individual constituents.
Table 24: UV–Visible Analysis of the Prepared Carica papaya Leaf Extract-Loaded Microemulsion
| Parameter | Observation |
|---|---|
| Instrument | Shimadzu UV-1800 |
| Method | UV–Visible spectrophotometry |
| Scan range | 200–400 nm |
| λmax | 273 nm |
| Absorbance at λmax | 0.45 AU |
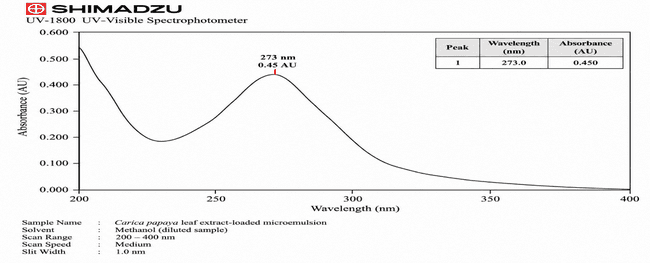
Figure 40: UV–Visible Absorption Spectrum of the Prepared Carica papaya Leaf Extract-Loaded Microemulsion.
3.7 Physical Stability of the Prepared Microemulsion
The formulation maintained its greenish-brown, slightly cloudy and homogeneous appearance throughout 90 days of room-temperature storage. No visible phase separation or sedimentation was observed at any observation interval. The pH remained within a narrow range of 5.9–6.1, indicating only minor variation during the three-month observation period.
Table 25: Stability Assessment of the Prepared Carica papaya Leaf Extract-Loaded Microemulsion During Room-Temperature Storage
| Time interval | Appearance/clarity | Phase separation | Sedimentation | pH |
|---|---|---|---|---|
| Day 0 | Greenish-brown, slightly cloudy, uniform | Not observed | Not observed | 5.9 |
| Day 5 | Greenish-brown, slightly cloudy; no major change | Not observed | Not observed | 6.0 |
| Day 15 | Greenish-brown, slightly cloudy; uniform | Not observed | Not observed | 6.1 |
| Day 30 | Greenish-brown, slightly cloudy; no visible change | Not observed | Not observed | 6.1 |
| Day 60 | Greenish-brown, slightly cloudy; homogeneous | Not observed | Not observed | 6.0 |
| Day 90 | Greenish-brown, slightly cloudy; no visible change from initial | Not observed | Not observed | 6.0 |
3.8 Stress Stability Evaluation
The formulation showed no visible change following centrifugation at 3,000 rpm for 30 min, six heating–cooling cycles between 4°C and 40°C with 48 h at each temperature, and three freeze–thaw cycles between −20°C and 25°C. These observations indicated the absence of obvious macroscopic phase separation or physical changes under the applied stress conditions.
Table 26: Stress Stability Evaluation of the Prepared Carica papaya Leaf Extract-Loaded Microemulsion
| Test | Conditions | Observation |
|---|---|---|
| Centrifugation | 3,000 rpm, 30 min | No visible change |
| Heating–cooling cycle | 4°C/40°C, 48 h at each temperature, 6 cycles | No change reported |
| Freeze–thaw cycle | −20°C/25°C, 3 cycles | No change reported |
3.10 In-vitro Marker Release Study
The prepared Carica papaya leaf extract-loaded microemulsion showed a progressive increase in cumulative marker release during the 24 h in-vitro release study. Marker release increased from 8.7% at 1 h to 84.6% at 24 h, indicating a gradual release profile throughout the study period. The analytical calibration curve demonstrated good linearity (R² = 0.9987), supporting the estimation of the released marker under the applied analytical conditions.
Table 27: Cumulative Marker Release from the Prepared Carica papaya Leaf Extract-Loaded Microemulsion
| Time (h) | Cumulative marker release (%) |
|---|---|
| 0 | 0.00 |
| 1 | 8.7 |
| 2 | 16.4 |
| 4 | 29.8 |
| 6 | 41.6 |
| 8 | 52.9 |
| 12 | 67.8 |
| 24 | 84.6 |
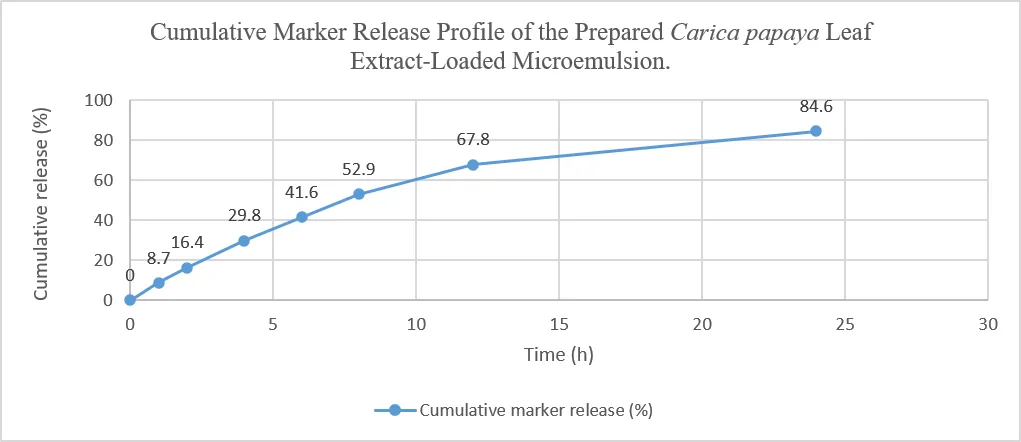
Figure 45: Cumulative Marker Release Profile of the Prepared Carica papaya Leaf Extract-Loaded Microemulsion.
3.11 Release Kinetic Analysis
The cumulative release data were fitted to zero-order, first-order, Higuchi, and Korsmeyer–Peppas models. The zero-order model produced an R² of 0.8749, while the first-order model also showed an R² of 0.8749. The Higuchi model demonstrated a higher correlation (R² = 0.9721), indicating a substantial contribution of diffusion to the observed release profile.
The Korsmeyer–Peppas model provided the highest correlation, with R² = 0.9996 and a release exponent (n) of 0.8663. Under the applied model, this value indicated non-Fickian/anomalous release behaviour. Thus, among the evaluated mathematical models, the Korsmeyer–Peppas model provided the best fit to the experimental release data.
Table 28: Comparison of Release Kinetic Models for the Prepared Carica papaya Leaf Extract-Loaded Microemulsion
| Kinetic model | Regression equation | R² | Key parameter |
|---|---|---|---|
| Zero-order | y = 3.5118x + 12.704 | 0.8749 | — |
| First-order | y = −3.5118x + 87.296 | 0.8749 | — |
| Higuchi | y = 19.149x − 5.4935 | 0.9721 | — |
| Korsmeyer–Peppas | y = 0.8663x − 0.9809 | 0.9996 | n = 0.8663 |
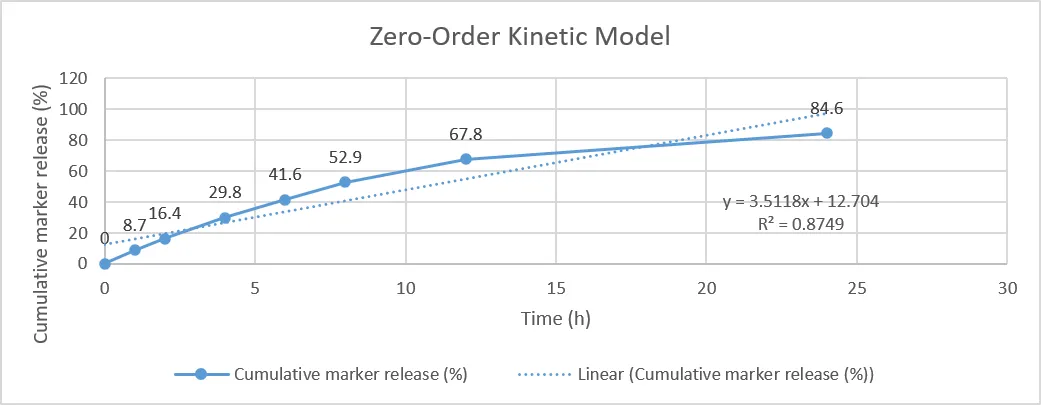
Figure 46: Zero-Order Release Kinetic Plot of the Prepared Carica papaya Leaf Extract-Loaded Microemulsion.
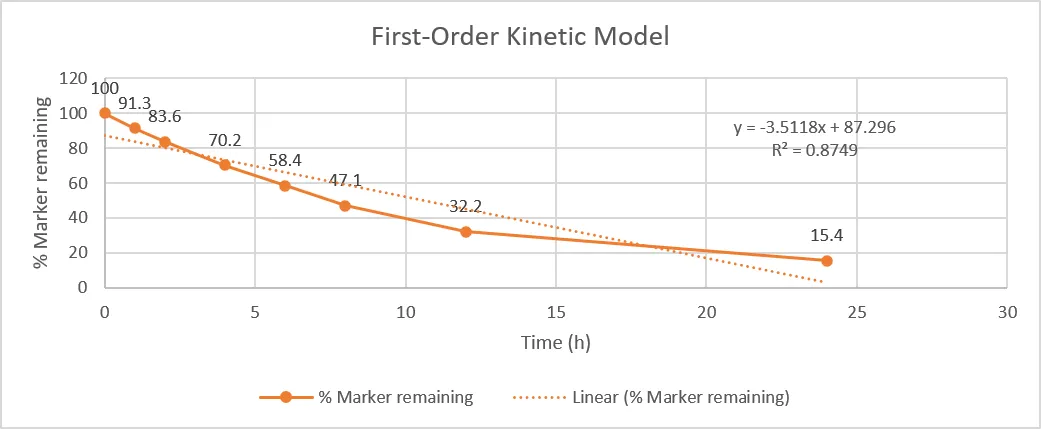
Figure 47: First-Order Release Kinetic Plot of the Prepared Carica papaya Leaf Extract-Loaded Microemulsion.
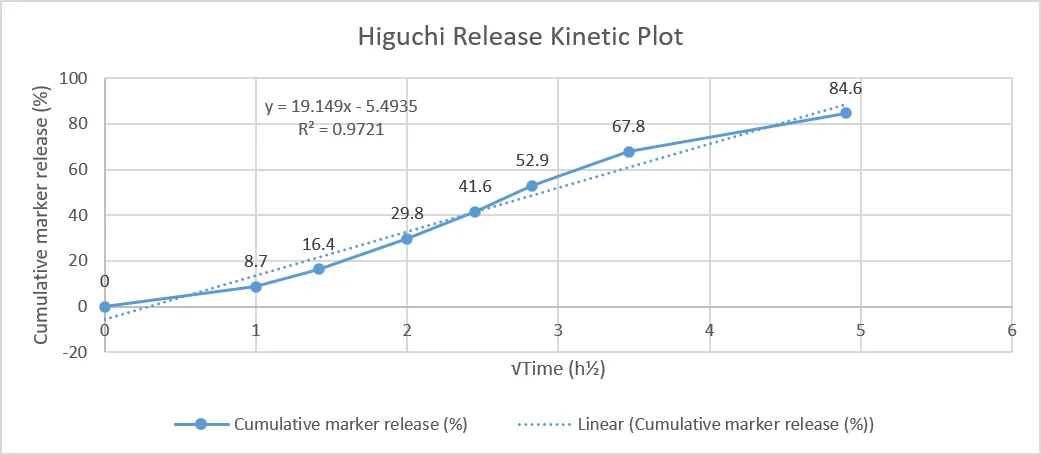
Figure 48: Higuchi Release Kinetic Plot of the Prepared Carica papaya Leaf Extract-Loaded Microemulsion.
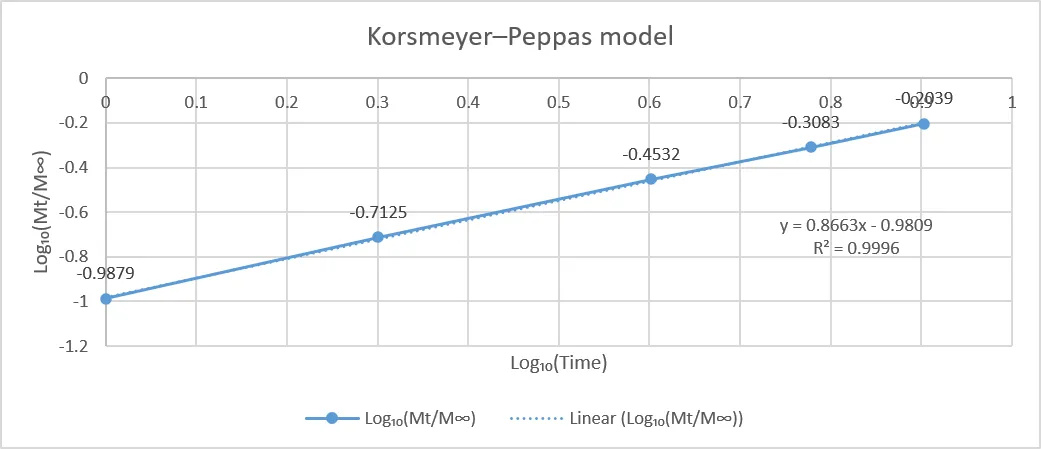
Figure 49: Korsmeyer–Peppas Release Kinetic Plot of the Prepared Carica papaya Leaf Extract-Loaded Microemulsion.
3.12 In-vitro Pharmacological Evaluation
The prepared microemulsion demonstrated concentration-dependent activity in the DPPH antioxidant, BSA protein-denaturation, and dengue virus NS2B–NS3 protease inhibition assays.
3.12.1 Antioxidant Activity
DPPH radical-scavenging activity increased from 18.4% at 25 µg/mL to 77.0% at 400 µg/mL, with an IC₅₀ value of 115 µg/mL. The progressive increase in inhibition with increasing concentration indicated concentration-dependent antioxidant activity.
3.12.2 Anti-inflammatory Activity
The formulation demonstrated concentration-dependent inhibition of BSA protein denaturation, increasing from 19.8% at 25 µg/mL to 74.4% at 400 µg/mL. The IC₅₀ value was 125 µg/mL, indicating appreciable activity in the applied in-vitro protein-denaturation model.
3.12.3 Dengue Virus NS2B–NS3 Protease Inhibition
NS2B–NS3 protease inhibition increased from 10% at 25 µg/mL to 68% at 400 µg/mL, with an IC₅₀ value of 180 µg/mL. The concentration-dependent response indicated inhibitory activity against the selected dengue virus protease target under the applied assay conditions. However, this assay does not establish whole-virus antiviral efficacy, and the specific active constituents responsible for the observed activity cannot be determined from this assay alone.
Table 29: DPPH Radical-Scavenging Activity of the Prepared Carica papaya Leaf Extract-Loaded Microemulsion
| Concentration (µg/mL) | Absorbance | DPPH inhibition (%) |
|---|---|---|
| 25 | 0.71 | 18.4 |
| 50 | 0.60 | 31.0 |
| 100 | 0.47 | 45.9 |
| 200 | 0.32 | 63.2 |
| 400 | 0.20 | 77.0 |
| IC₅₀ | 115 µg/mL |
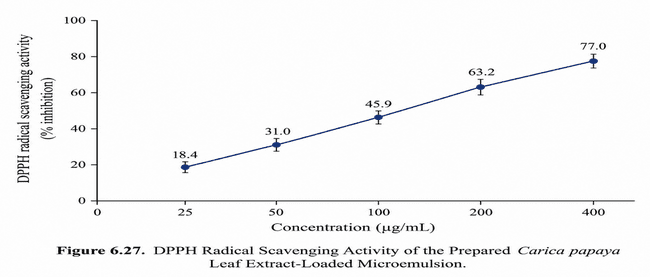
Figure 50: DPPH Radical-Scavenging Activity of the Prepared Carica papaya Leaf Extract-Loaded Microemulsion.
Table 30: BSA Protein-Denaturation Inhibition Activity of the Prepared Carica papaya Leaf Extract-Loaded Microemulsion
| Concentration (µg/mL) | Absorbance | Inhibition (%) |
|---|---|---|
| 25 | 0.69 | 19.8 |
| 50 | 0.59 | 31.4 |
| 100 | 0.46 | 46.5 |
| 200 | 0.33 | 61.6 |
| 400 | 0.22 | 74.4 |
| IC₅₀ | 125 µg/mL |
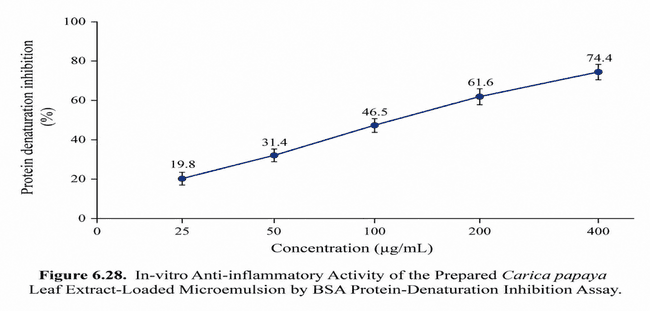
Figure 51: In-vitro Anti-inflammatory Activity of the Prepared Carica papaya Leaf Extract-Loaded Microemulsion by BSA Protein-Denaturation Inhibition Assay.
Table 31: Dengue Virus NS2B–NS3 Protease Inhibition Activity of the Prepared Carica papaya Leaf Extract-Loaded Microemulsion
| Concentration (µg/mL) | NS2B–NS3 protease inhibition (%) |
|---|---|
| 25 | 10 |
| 50 | 20 |
| 100 | 35 |
| 200 | 52 |
| 400 | 68 |
| IC₅₀ | 180 µg/mL |
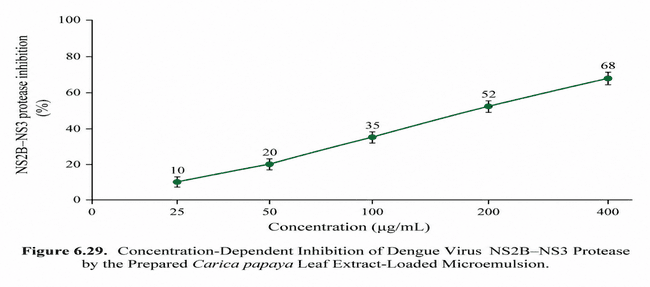
Figure 52: Concentration-Dependent Inhibition of Dengue Virus NS2B–NS3 Protease by the Prepared Carica papaya Leaf Extract-Loaded Microemulsion.
3.13 Accelerated Stability Study
The selected Carica papaya leaf extract-loaded microemulsion was evaluated under accelerated storage conditions at 40 ± 2°C/75 ± 5% RH for 3 months. The formulation maintained its greenish-brown colour, slightly cloudy appearance and uniformity throughout the study, with no visible phase separation or sedimentation.
The pH showed only a minor change from 5.9 to 6.0. Mean droplet size increased gradually from 100 to 109 nm, while PDI increased from 0.20 to 0.23. Zeta potential changed from −20 to −18 mV, and viscosity increased from 50 to 53 mPa·s. Conductivity showed a gradual decrease from 400 to 385 µS/cm. Marker content decreased progressively from 100% to 94.5% at 90 days.
Table 32: Evaluation of the Selected Carica papaya Leaf Extract-Loaded Microemulsion During Accelerated Stability Study
| Sr. No. | Parameter | Day 0 | Day 30 | Day 60 | Day 90 |
|---|---|---|---|---|---|
| 1 | Appearance | Greenish-brown, slightly cloudy | No major change | No major change | No visible change |
| 2 | Colour | Greenish-brown | Greenish-brown | Greenish-brown | Greenish-brown |
| 3 | Homogeneity | Uniform | Uniform | Uniform | Uniform |
| 4 | Clarity | Slightly cloudy | Slightly cloudy | Slightly cloudy | Slightly cloudy |
| 5 | Phase separation | Not observed | Not observed | Not observed | Not observed |
| 6 | Sedimentation | Not observed | Not observed | Not observed | Not observed |
| 7 | pH | 5.9 | 6.0 | 6.0 | 6.0 |
| 8 | Droplet size | 100 nm | 103 nm | 106 nm | 109 nm |
| 9 | PDI | 0.20 | 0.21 | 0.22 | 0.23 |
| 10 | Zeta potential | −20 mV | −19 mV | −18 mV | −18 mV |
| 11 | Viscosity | 50 mPa·s | 51 mPa·s | 52 mPa·s | 53 mPa·s |
| 12 | Conductivity | 400 µS/cm | 395 µS/cm | 390 µS/cm | 385 µS/cm |
| 13 | Drug/marker content | 100% | 97.8% | 96.2% | 94.5% |
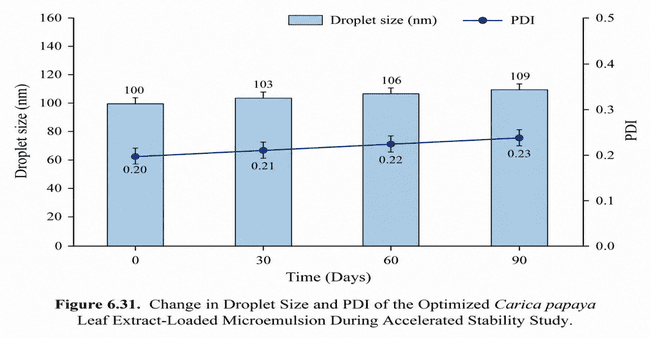
Figure 53: Change in Droplet Size and PDI of the Selected Carica papaya Leaf Extract-Loaded Microemulsion During Accelerated Stability Study.
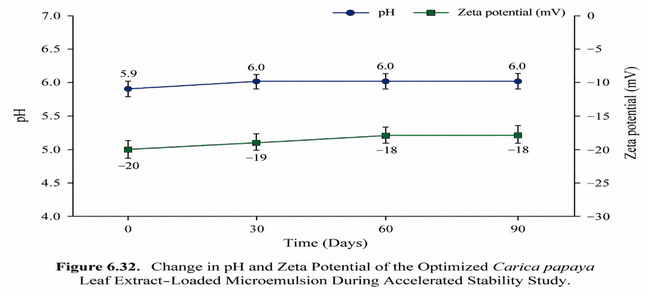
Figure 54: Change in pH and Zeta Potential of the Selected Carica papaya Leaf Extract-Loaded Microemulsion During Accelerated Stability Study.
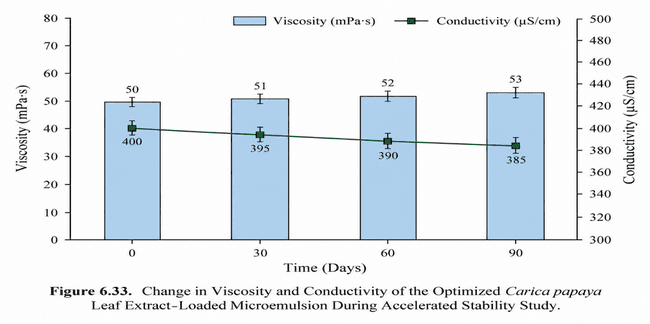
Figure 55: Change in Viscosity and Conductivity of the Selected Carica papaya Leaf Extract-Loaded Microemulsion During Accelerated Stability Study.
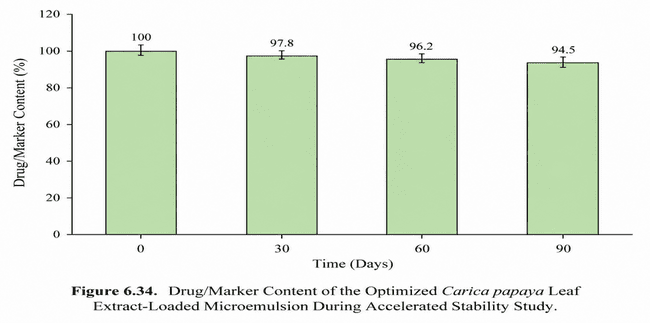
Figure 56: Drug/Marker Content of the Selected Carica papaya Leaf Extract-Loaded Microemulsion During Accelerated Stability Study.
3.14 Overall Discussion
The present study developed and evaluated a Carica papaya leaf extract-loaded microemulsion for potential dengue-related applications. Ethanolic extraction of the leaves produced a 14% w/w extract yield, while preliminary phytochemical screening demonstrated the presence of alkaloids, flavonoids, phenolic compounds, tannins, saponins, terpenoids, carbohydrates and amino acids. Based on preliminary solubility assessment and pseudoternary phase-diagram screening, MCT oil, Tween 80 and propylene glycol were selected as the formulation components, with a Tween 80 glycol Smix ratio of 2:1.
The prepared formulation showed a greenish-brown, uniform and slightly cloudy appearance without visible phase separation or sedimentation. Its preliminary physicochemical characteristics included nanoscale droplet size, relatively narrow size distribution, negative zeta potential, 50 mPa·s viscosity, measurable conductivity and a refractive index of 1.42. The formulation demonstrated gradual marker release, reaching 84.6% cumulative release at 24 h. Among the evaluated kinetic models, the Korsmeyer–Peppas model showed the highest correlation (R² = 0.9996; n = 0.8663), indicating anomalous/non-Fickian release behaviour under the applied model.
The formulation exhibited concentration-dependent antioxidant and anti-inflammatory activities, with 77.0% DPPH radical-scavenging activity and 74.4% inhibition of protein denaturation at 400 µg/mL. The corresponding IC₅₀ values were 115 and 125 µg/mL, respectively. The formulation also produced 68% inhibition of dengue virus NS2B–NS3 protease at 400 µg/mL, with an IC₅₀ of 180 µg/mL, indicating preliminary target-specific activity against the selected protease target.
Accelerated stability evaluation demonstrated maintenance of the formulation's physical appearance and absence of visible phase separation or sedimentation over 90 days at 40 ± 2°C/75 ± 5% RH. Only minor changes were observed in pH, droplet size, PDI, zeta potential, viscosity and conductivity, while 94.5% marker content was retained at the end of the study.
Overall, the developed C. papaya leaf extract-loaded microemulsion demonstrated suitable preliminary formulation characteristics, gradual marker release, antioxidant and anti-inflammatory activities, and preliminary NS2B–NS3 protease inhibitory activity. These findings support the formulation as a candidate for further preclinical investigation. However, the in-vitro protease assay should not be interpreted as confirmation of whole-virus antiviral efficacy or clinical effectiveness against dengue; further mechanistic, cell-based, in-vivo, pharmacokinetic and safety studies are required.
CONCLUSION
The present study successfully developed a Carica papaya leaf extract-loaded microemulsion comprising MCT oil, Tween 80, propylene glycol, and distilled water. Based on pseudoternary phase-diagram studies, a 2:1 Tween 80 glycol Smix ratio was selected for formulation development.
The selected formulation exhibited favourable physicochemical characteristics, including a droplet size of approximately 100 nm, PDI of 0.20, zeta potential of approximately −20 mV, viscosity of 50 mPa·s, and conductivity of 400 µS/cm. The formulation demonstrated 84.6% cumulative marker release over 24 h, with the Korsmeyer–Peppas model providing the best fit (R² = 0.9996; n = 0.8663), indicating anomalous/non-Fickian release behaviour under the applied model.
The formulation demonstrated antioxidant activity with 77.0% inhibition and an IC₅₀ of 115 µg/mL, while the protein-denaturation assay showed 74.4% inhibition with an IC₅₀ of 125 µg/mL. In addition, 68% inhibition of recombinant dengue NS2B–NS3 protease was observed at the highest tested concentration, with an IC₅₀ of 180 µg/mL, indicating preliminary target-specific enzyme inhibitory activity.
Accelerated stability testing at 40 ± 2°C/75 ± 5% RH for 90 days showed no visible phase separation or sedimentation, with 94.5% drug/marker content retained at the end of the study. Overall, the developed C. papaya leaf extract-loaded microemulsion exhibited promising physicochemical properties, sustained marker release, antioxidant and anti-inflammatory potential, and preliminary dengue-related protease inhibitory activity. However, the present findings do not establish whole-virus antiviral or clinical efficacy. Further cell-based, in-vivo, toxicity, pharmacokinetic, and clinical investigations are required to establish its therapeutic potential.
REFERENCES

Prakarsh Giri, Dhananjay Rai, Formulation and Evaluation of Carica Papaya Microemulsion for the Treatment of Dengue Fever, Int. J. of Pharm. Sci., 2026, Vol 4, Issue 10, 3429-3459. https://doi.org/10.5281/zenodo.23633037
 10.5281/zenodo.23633037