

We use cookies to ensure our website works properly and to personalise your experience. Cookies policy
1,2Department of Pharmaceutics, Pallavan Pharmacy College, Kolivakkam, Kanchipuram, Tamil Nadu, India.
3Pallavan Pharmacy College, Kolivakkam, Kanchipuram, Tamil Nadu, India.
4Formulation Research and Development, Sai Mirra Innopharm Pvt. Ltd., Ambattur, Chennai 600098, Tamil Nadu, India.
Objective: To develop and optimise a gastroretentive floating bilayer fixed-dose combination (FDC) tablet releasing rosuvastatin calcium (RC, 10 mg) immediately and enalapril maleate (EM, 10 mg), a Biopharmaceutics Classification System (BCS) Class III drug with an upper-intestinal absorption window, over 12 h. Methods: Immediate-release layers (T1–T9) were screened with croscarmellose sodium, sodium starch glycolate and crospovidone (3–9% w/w). Sustained-release layers (F1–F9) followed a 3² factorial design varying HPMC K100M (40–60 mg) and Carbopol 974P (20–40 mg), with fixed sodium bicarbonate and citric acid. Bilayer tablets (300 mg) were directly compressed and evaluated for FTIR compatibility, physical quality, buoyancy, swelling, dissolution in 0.1 N HCl, release kinetics and three-month stability under ICH conditions. Results: All batches complied with pharmacopoeial limits for weight variation, friability (<1%) and drug content. Carbopol 974P influenced floating lag time, total floating time, swelling and EM release 2.2–3.4-fold more strongly than HPMC K100M (first-order models, R2 ? 0.94). The optimised tablet B9 floated within 49 ± 1 s, remained buoyant for 21.0 ± 0.4 h, released 99.8% of RC within 60 min and sustained EM release over 12 h (t50 ? 5.5 h) by anomalous transport (Korsmeyer–Peppas n = 0.79). After 3 months at 40 °C/75% RH, assay and dissolution changed by ? 2%. Conclusion: A single-tablet biphasic FDC of rosuvastatin calcium and enalapril maleate with prolonged in vitro buoyancy was developed; in vivo gastric retention and pharmacokinetic studies are warranted.
Cardiovascular disease remains the leading cause of death worldwide, and elevated blood pressure and low-density lipoprotein (LDL) cholesterol are its two largest modifiable metabolic risk factors 1. The two conditions frequently coexist, and FDCs that pair an antihypertensive agent with a statin reduce pill burden and improve adherence; polypill trials have shown reductions in major adverse cardiovascular events 2. The development of such products is nevertheless challenging, because the partner drugs often differ in solubility, stability and the release profile that each requires 3.
Enalapril maleate is an angiotensin-converting enzyme (ACE) inhibitor prodrug. Approximately 60% of an oral dose is absorbed and hydrolysed to enalaprilat, which reaches peak plasma concentrations 3–4 h after dosing 4. EM is highly soluble but poorly permeable (BCS Class III), and its absorption is concentrated in the upper small intestine 5. Rosuvastatin calcium is a potent 3-hydroxy-3-methylglutaryl coenzyme A (HMG-CoA) reductase inhibitor with an absolute oral bioavailability of about 20%, a tmax of 3–5 h and an elimination half-life of about 19 h 6, 7; its long half-life makes immediate release appropriate. EM, by contrast, is a rational candidate for prolonged release: delivering it slowly in the stomach, proximal to its absorption window, could attenuate the peak–trough fluctuation of enalaprilat while preserving the fraction absorbed 8, 9.
Gastroretentive drug delivery systems (GRDDS) prolong gastric residence through flotation, mucoadhesion, swelling or high density 8, 9. Effervescent floating matrices are the most widely studied: a hydrophilic polymer such as HPMC hydrates to form a gel that entraps the carbon dioxide (CO2) generated from bicarbonate, so that the tablet density falls below that of gastric fluid (≈ 1.004 g/cm3) while the gel controls drug diffusion 10–12. Floating dosage forms have shown prolonged gastric residence in humans, particularly in the fed state 13. Bilayer compression allows a single tablet to carry an IR layer and a floating SR layer, although risks such as delamination and interlayer migration must be controlled 14.
Floating bilayer FDCs combining an IR statin with an SR antihypertensive have been reported for lovastatin with atenolol 15 and simvastatin with atenolol 16, and related designs exist for losartan with hydrochlorothiazide 17, captopril 18 and esomeprazole with clarithromycin 19. To the best of our knowledge, a floating bilayer FDC of rosuvastatin calcium with enalapril maleate has not been described. Moreover, the relative contributions of HPMC K100M and Carbopol 974P to buoyancy and drug release in acidic medium have been quantified for single-layer floating systems 20, but not within a bilayer FDC in which the floating layer must also support an IR layer.
The objective of this study was therefore to design, optimise by a 3² full factorial design and characterise a floating bilayer tablet comprising an IR RC layer and a floating SR EM layer, including superdisintegrant selection, quantification of polymer effects on buoyancy, swelling and release, elucidation of the release mechanism and assessment of stability (fig. 1).
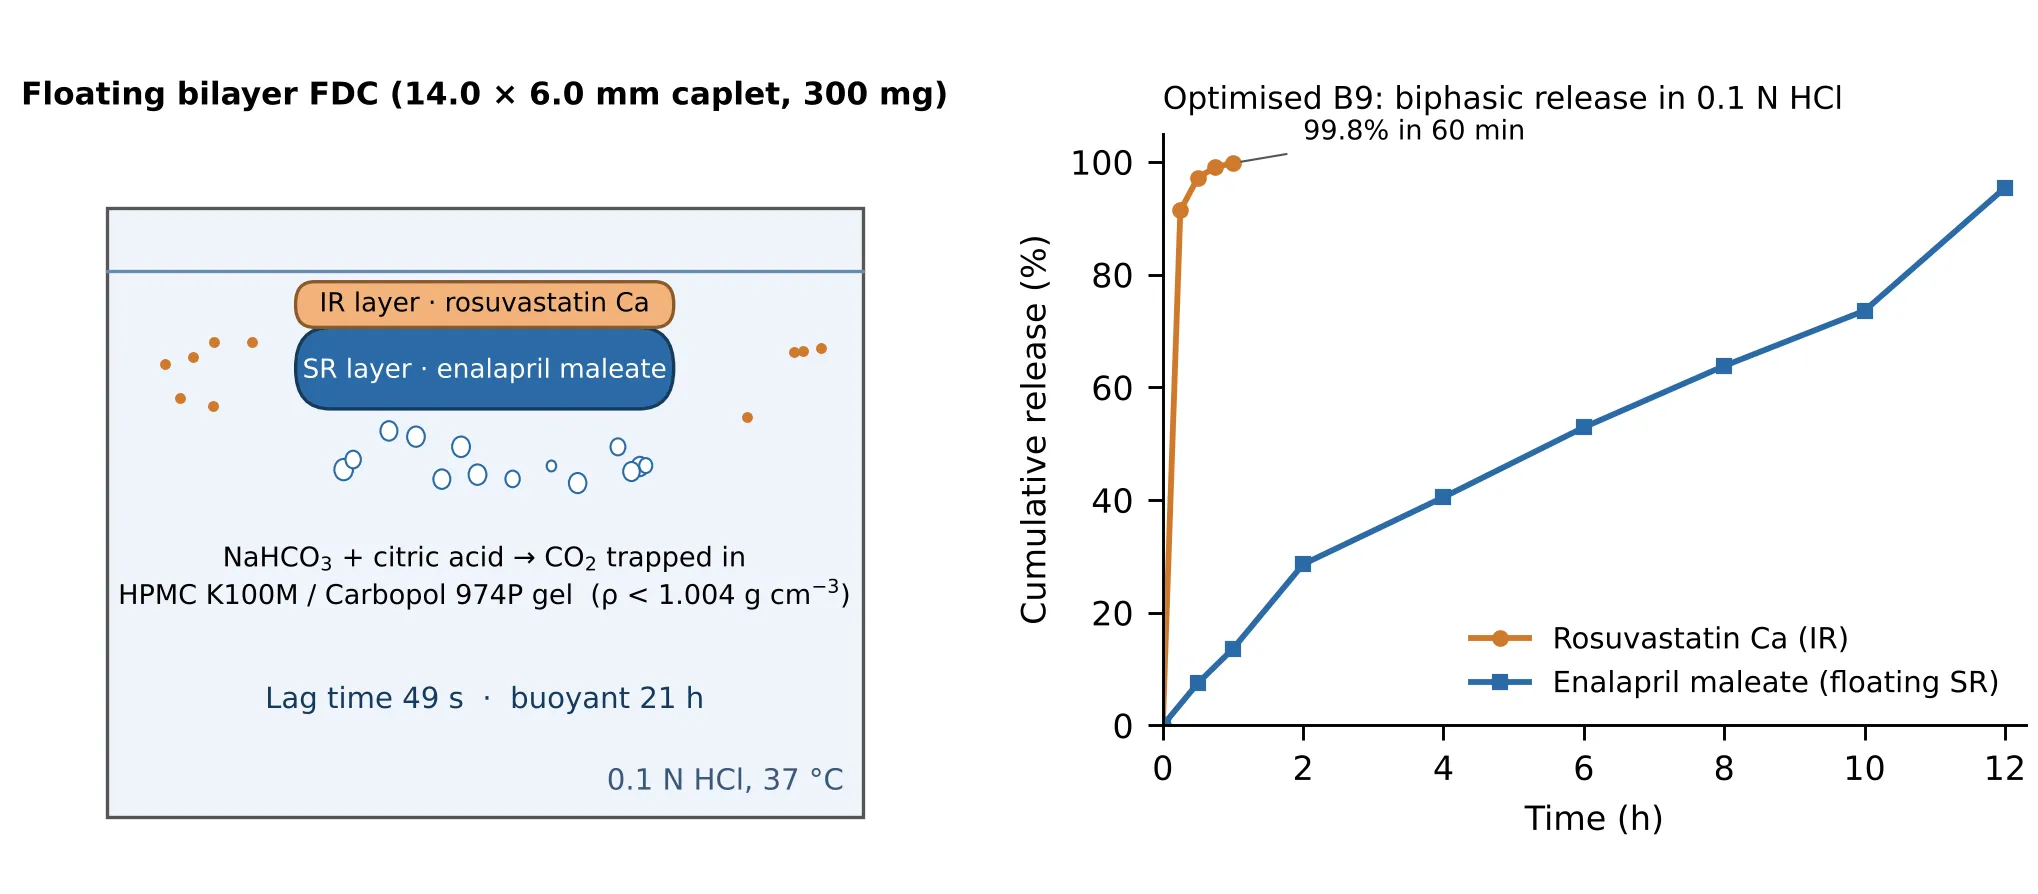
Figure 1: Design Concept of the Floating Bilayer Tablet (Left) and Biphasic Release of Rosuvastatin Calcium (IR Layer) and Enalapril Maleate (Floating SR Layer) from the Optimised Formulation B9 in 0.1 N HCl at 37 °C (Right). IR, Immediate Release; SR, Sustained Release; FDC, Fixed-Dose Combination.
MATERIALS AND METHODS
MATERIALS
Rosuvastatin calcium and enalapril maleate of pharmacopoeial grade were obtained from and used as received. HPMC K100M and METHOCEL™ E3 Premium LV, Carbopol® 974P NF, crospovidone, croscarmellose sodium and sodium starch glycolate were of pharmaceutical grade. Microcrystalline cellulose (MCC PH102), directly compressible lactose (DCL 21), lactose monohydrate, sodium bicarbonate, anhydrous citric acid, colloidal anhydrous silica, talc and magnesium stearate were of pharmacopoeial grade. All other reagents were of analytical grade.
Preformulation studies
Appearance and odour were recorded visually. Melting points were determined in triplicate by the open-capillary method using a melting-point apparatus. Equilibrium solubility was determined by the shake-flask method: excess drug was agitated in distilled water, 0.1 N HCl, phosphate buffer pH 6.8 and methanol for 24 h at room temperature, filtered through Whatman filter paper, suitably diluted and assayed by ultraviolet (UV) spectrophotometry.
Analytical method
UV spectra (200–400 nm) of 10 µg/ml solutions in 0.1 N HCl were recorded on a UV–visible spectrophotometer using 1 cm quartz cells. Stock solutions (100 µg/ml) were diluted to 2–10 µg/ml, and absorbance was measured at 206 nm (EM) and 243 nm (RC). Linearity was assessed by least-squares regression, and the limits of detection (LOD) and quantification (LOQ) were calculated as 3.3σ/S and 10σ/S, where σ is the residual standard deviation of the regression and S its slope 21. Because the spectra of the two drugs overlap, both drugs in tablet, dissolution and stability samples were quantified by the simultaneous-equation (Vierordt) method from absorbances at both wavelengths, using absorptivities determined from the individual calibration sets (equations 1 and 2):


where A1 and A2 are the sample absorbances at 206 and 243 nm, respectively, and a denotes the absorptivity of each drug at each wavelength.
Drug–excipient compatibility study
FTIR spectra of the pure drugs, the optimised IR and SR layer blends and the powdered optimised bilayer tablet were recorded as KBr discs over 4000–400 cm−1 on an FTIR spectrometer. Retention of the characteristic drug bands, without disappearance of bands, appearance of new bands or significant shifts, was taken to indicate compatibility.
Formulation design
Each tablet comprised a 100 mg IR layer (10 mg RC) and a 200 mg floating SR layer (10 mg EM). Nine IR layers (T1–T9) combined three superdisintegrants (croscarmellose sodium, T1–T3; sodium starch glycolate, T4–T6; crospovidone, T7–T9) at 3, 6 and 9 mg per layer (3–9% w/w), with MCC PH102 adjusted to maintain constant layer weight (table 1). Nine SR layers (F1–F9) followed a 3² full factorial design 20, 22 with HPMC K100M (X1: 40, 50 and 60 mg; coded −1, 0, +1) and Carbopol 974P (X2: 20, 30 and 40 mg; coded −1, 0, +1) as independent variables. Sodium bicarbonate (24 mg) and citric acid (12 mg) were held constant, and lactose monohydrate was adjusted to maintain a layer weight of 200 mg (table 2). Bilayer tablets B1–B9 paired Ti with Fi (B1 = T1 + F1, …, B9 = T9 + F9).
Table 1: Composition of the Immediate-Release Rosuvastatin Calcium Layers (mg per Tablet)
| Ingredient | T1 | T2 | T3 | T4 | T5 | T6 | T7 | T8 | T9 |
|---|---|---|---|---|---|---|---|---|---|
| Rosuvastatin calcium | 10 | 10 | 10 | 10 | 10 | 10 | 10 | 10 | 10 |
| Lactose DCL 21 | 20 | 20 | 20 | 20 | 20 | 20 | 20 | 20 | 20 |
| MCC PH102 | 57 | 54 | 51 | 57 | 54 | 51 | 57 | 54 | 51 |
| METHOCEL E3 Premium LV | 6 | 6 | 6 | 6 | 6 | 6 | 6 | 6 | 6 |
| Croscarmellose sodium | 3 | 6 | 9 | – | – | – | – | – | – |
| Sodium starch glycolate | – | – | – | 3 | 6 | 9 | – | – | – |
| Crospovidone | – | – | – | – | – | – | 3 | 6 | 9 |
| Colloidal anhydrous silica | 2 | 2 | 2 | 2 | 2 | 2 | 2 | 2 | 2 |
| Magnesium stearate | 2 | 2 | 2 | 2 | 2 | 2 | 2 | 2 | 2 |
| Layer weight | 100 | 100 | 100 | 100 | 100 | 100 | 100 | 100 | 100 |
MCC, microcrystalline cellulose; –, not included.
Table 2: Composition of the Floating Sustained-Release Enalapril Maleate Layers (mg per Tablet) and 3² Factorial Coding
| Ingredient | F1 | F2 | F3 | F4 | F5 | F6 | F7 | F8 | F9 |
|---|---|---|---|---|---|---|---|---|---|
| X1 coded level | −1 | 0 | +1 | −1 | 0 | +1 | −1 | 0 | +1 |
| X2 coded level | −1 | −1 | −1 | 0 | 0 | 0 | +1 | +1 | +1 |
| Enalapril maleate | 10 | 10 | 10 | 10 | 10 | 10 | 10 | 10 | 10 |
| HPMC K100M (X1) | 40 | 50 | 60 | 40 | 50 | 60 | 40 | 50 | 60 |
| Carbopol 974P (X2) | 20 | 20 | 20 | 30 | 30 | 30 | 40 | 40 | 40 |
| Sodium bicarbonate | 24 | 24 | 24 | 24 | 24 | 24 | 24 | 24 | 24 |
| Citric acid (anhydrous) | 12 | 12 | 12 | 12 | 12 | 12 | 12 | 12 | 12 |
| Lactose monohydrate | 86 | 76 | 66 | 76 | 66 | 56 | 66 | 56 | 46 |
| Talc | 4 | 4 | 4 | 4 | 4 | 4 | 4 | 4 | 4 |
| Magnesium stearate | 4 | 4 | 4 | 4 | 4 | 4 | 4 | 4 | 4 |
| Layer weight | 200 | 200 | 200 | 200 | 200 | 200 | 200 | 200 | 200 |
X1, HPMC K100M (−1 = 40 mg, 0 = 50 mg, +1 = 60 mg); X2, Carbopol 974P (−1 = 20 mg, 0 = 30 mg, +1 = 40 mg); HPMC, hydroxypropyl methylcellulose.
Preparation of bilayer tablets
All ingredients except the lubricants and glidant were passed through a #40 sieve; magnesium stearate, talc and colloidal silica were passed through a #60 sieve. For each layer, the drug was blended geometrically with the diluents and polymers (SR layer: polymers, then sodium bicarbonate and citric acid, then lactose); the glidant was blended for 3–5 min and the lubricant for 2–3 min. The SR blend (200 mg) was filled into the die of a rotary tablet press fitted with 14.0 × 6.0 mm caplet punches and lightly pre-compressed; the IR blend (100 mg) was then added and both layers were compressed together. The main compression force was adjusted to give adequate hardness and interlayer bonding without capping or delamination. Tablets were stored in airtight containers until evaluation.
Micromeritic properties of powder blends
The angle of repose (θ) was determined by the fixed-funnel method. Bulk (ρb) and tapped (ρt, 500 taps) densities were measured in a graduated cylinder, and Carr’s compressibility index (CI) and the Hausner ratio (HR) were calculated 23, 24 (equations 3–5):
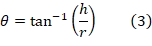
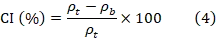
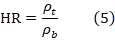
where h and r are the height and radius of the powder cone, respectively.
Physical evaluation of bilayer tablets
Weight variation (n = 20) was assessed against the ± 5% limit applicable to tablets weighing more than 250 mg 25. Thickness was measured with a Vernier caliper (n = 3–5). Breaking force was measured by diametral compression with a Monsanto hardness tester and is reported in newtons (1 kgf = 9.807 N) 26. Friability was determined on 10 tablets in a Roche-type friabilator at 25 rpm for 100 revolutions (limit <1%). Content uniformity was determined on 10 individually assayed tablets against the acceptance-value criterion of USP ⟨905⟩/IP, which applies because each drug is present at <25 mg per unit 25, 27.
In vitro buoyancy study
One tablet was placed in 100 ml of 0.1 N HCl (pH 1.2) maintained at 37 ± 0.5 °C. The floating lag time (FLT) was recorded as the time required for the tablet to rise to the surface, and the total floating time (TFT) as the duration for which it remained continuously buoyant 28 (n = 6).
Swelling study
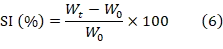
Pre-weighed tablets (W0) were immersed in 0.1 N HCl at 37 ± 0.5 °C, removed at 1, 2, 4, 6, 8 and 12 h, blotted and reweighed (Wt). Because the IR layer disintegrates within minutes, the swelling index (SI) mainly reflects the hydrating SR matrix, but it is expressed relative to the initial bilayer tablet weight (equation 6):
In vitro dissolution study
Dissolution was performed in a USP Apparatus II (paddle; containing 900 ml of 0.1 N HCl at 37 ± 0.5 °C and 50 rpm 27 (n = 6 tablets per batch). Samples (5 ml) were withdrawn at 5, 10, 15, 30 and 45 min and at 1, 2, 3, 4, 6, 8, 10 and 12 h, filtered and replaced with an equal volume of fresh pre-warmed medium. Cumulative drug release was corrected for sampling losses.
Release kinetics and profile comparison
EM release data (0.5–12 h) were fitted to the zero-order, first-order, Higuchi, Hixson–Crowell, Korsmeyer–Peppas and Peppas–Sahlin models 29–34 (equations 7–12):






Models were fitted to untransformed cumulative release data by non-linear least squares, which avoids the error distortion introduced by linearising transformations. Korsmeyer–Peppas and Peppas–Sahlin fits were restricted to Mt/M∞ ≤ 0.60, and the release exponent n was interpreted for cylindrical geometry (n ≤ 0.45, Fickian diffusion; 0.45 < n < 0.89, anomalous transport; n ≥ 0.89, Case II transport) 31, 32; m was fixed at 0.45. Goodness of fit was compared using the coefficient of determination (R2), adjusted R2 and Akaike’s information criterion, AIC = N ln (SSR/N) + 2p, where N is the number of data points, SSR the residual sum of squares and p the number of model parameters 35. Dissolution efficiency (DE), mean dissolution time (MDT) and the time for 50% release (t50) were calculated 36, and release profiles were compared using the similarity factor f2 37. Calculations were performed in Python using SciPy and statsmodels 38, 39.
Factorial analysis
For each response Y (FLT, TFT, SI at 12 h, EM released at 1 h and 8 h, and t50), first-order and full quadratic models in the coded factors were fitted by ordinary least squares, and model terms were tested at α = 0.05 (equation 13):

where β0 is the intercept, β1 and β2 are the main-effect coefficients, β12 is the interaction coefficient, and β11 and β22 are the quadratic coefficients.
Stability study
The optimised tablets were packed in HDPE bottle and stored in a stability chamber at 25 ± 2 °C/60 ± 5% RH and 40 ± 2 °C/75 ± 5% RH for 3 months 40. At 0, 1, 2 and 3 months, tablets were examined for appearance, assay of both drugs and dissolution (RC at 60 min; EM at 12 h). The acceptance criteria were 90.0–110.0% of label claim and no significant change in dissolution.
Statistical analysis
Results are expressed as mean ± standard deviation (SD); the number of replicates is stated in each table and figure legend. Factorial effects were assessed by ordinary least-squares regression with t-tests on the model coefficients and an overall F-test, and dissolution profiles were compared using the similarity factor f2. A value of p < 0.05 was considered statistically significant.
RESULTS AND DISCUSSION
Preformulation and analytical method
Both drugs were white, odourless powders. The melting point of EM (144 °C) agreed with the reported range of 143–145 °C, whereas RC, which is amorphous, softened at 122–125 °C. The measured solubilities are presented in Supplementary Table S1. EM was highly soluble in all aqueous media, consistent with its BCS Class III classification 5. Its apparent aqueous solubility (120.5 mg/ml), however, is several-fold higher than the compendial description of EM as “sparingly soluble in water” 41; because equilibration was performed at uncontrolled room temperature and without control of final pH, the value should be regarded as apparent rather than thermodynamic solubility. RC showed higher apparent solubility in 0.1 N HCl (1.82 mg/ml) than at pH 6.8 (0.52 mg/ml), which is contrary to expectation for a weak acid with a pKa of 4.6 42. Acid-catalysed lactonisation of rosuvastatin during the 24 h equilibration, together with the inability of the UV method to discriminate the parent drug from its lactone, may have contributed to this observation, which should be confirmed by a chromatographic method.
The UV spectra exhibited absorption maxima at 206 nm (EM) and 243 nm (RC) (Supplementary fig. S1). Both calibration curves were linear over 2–10 µg/ml (table 3). Because the EM wavelength lies in the far-UV region, where the maleate counter-ion and the citric acid of the SR layer also absorb, specificity against a placebo matrix must be demonstrated before the method can be considered fully validated in accordance with ICH Q2 (R2) 21.
Table 3: Calibration Parameters of the UV Spectrophotometric Method in 0.1 N HCL
| Parameter | Enalapril maleate | Rosuvastatin calcium |
|---|---|---|
| λmax (nm) | 206 | 243 |
| Linearity range (µg/ml) | 2–10 | 2–10 |
| Slope ± SE (AU ml/µg) | 0.0514 ± 0.0006 | 0.0416 ± 0.0006 |
| Intercept (AU) | 0.0007 | 0.0082 |
| Coefficient of determination (R2) | 0.9996 | 0.9994 |
| LOD (µg/ml) | 0.23 | 0.31 |
| LOQ (µg/ml) | 0.71 | 0.92 |
Regression based on five concentration levels. SE, standard error; AU, absorbance units; LOD, limit of detection; LOQ, limit of quantification.
Drug–excipient compatibility
The FTIR spectra are shown in fig. 2, and the diagnostic bands are summarised in table 4. Pure EM showed aliphatic C–H stretching (2982 cm−1), the ester and carboxylic acid carbonyl doublet (1752/1729 cm−1), the amide I band overlapping maleate C=C/COO− (1643 cm−1), and C–O and aromatic out-of-plane bands (1224–1189, 747 and 701 cm−1). Pure RC showed O–H/N–H stretching (3395 and ≈ 3310 cm−1), carboxylate and pyrimidine/aromatic ring bands (1591 and 1522 cm−1), the sulfonyl band (≈ 1336 cm−1) and C–O stretching (1046 cm−1).
In the optimised tablet, all diagnostic RC bands were retained within 0–6 cm−1, except the sulfonyl band, which appeared at 1327 cm−1. The EM bands at 1545 and 1189 cm−1 were retained. The EM carbonyl doublet was not resolved in the SR blend, in which EM constitutes only 5% w/w, and in the tablet it merged into a broad band at 1718 cm−1 shared with the carboxyl groups of Carbopol. Strong bands at 2918/2850 cm−1 arise from magnesium stearate, and those at 1074/1040 cm−1 from HPMC. No new bands appeared, indicating the absence of gross chemical interaction. Because FTIR is relatively insensitive at these drug loadings, compatibility should be further confirmed by differential scanning calorimetry (DSC) of 1:1 binary mixtures and by stability-indicating chromatography.
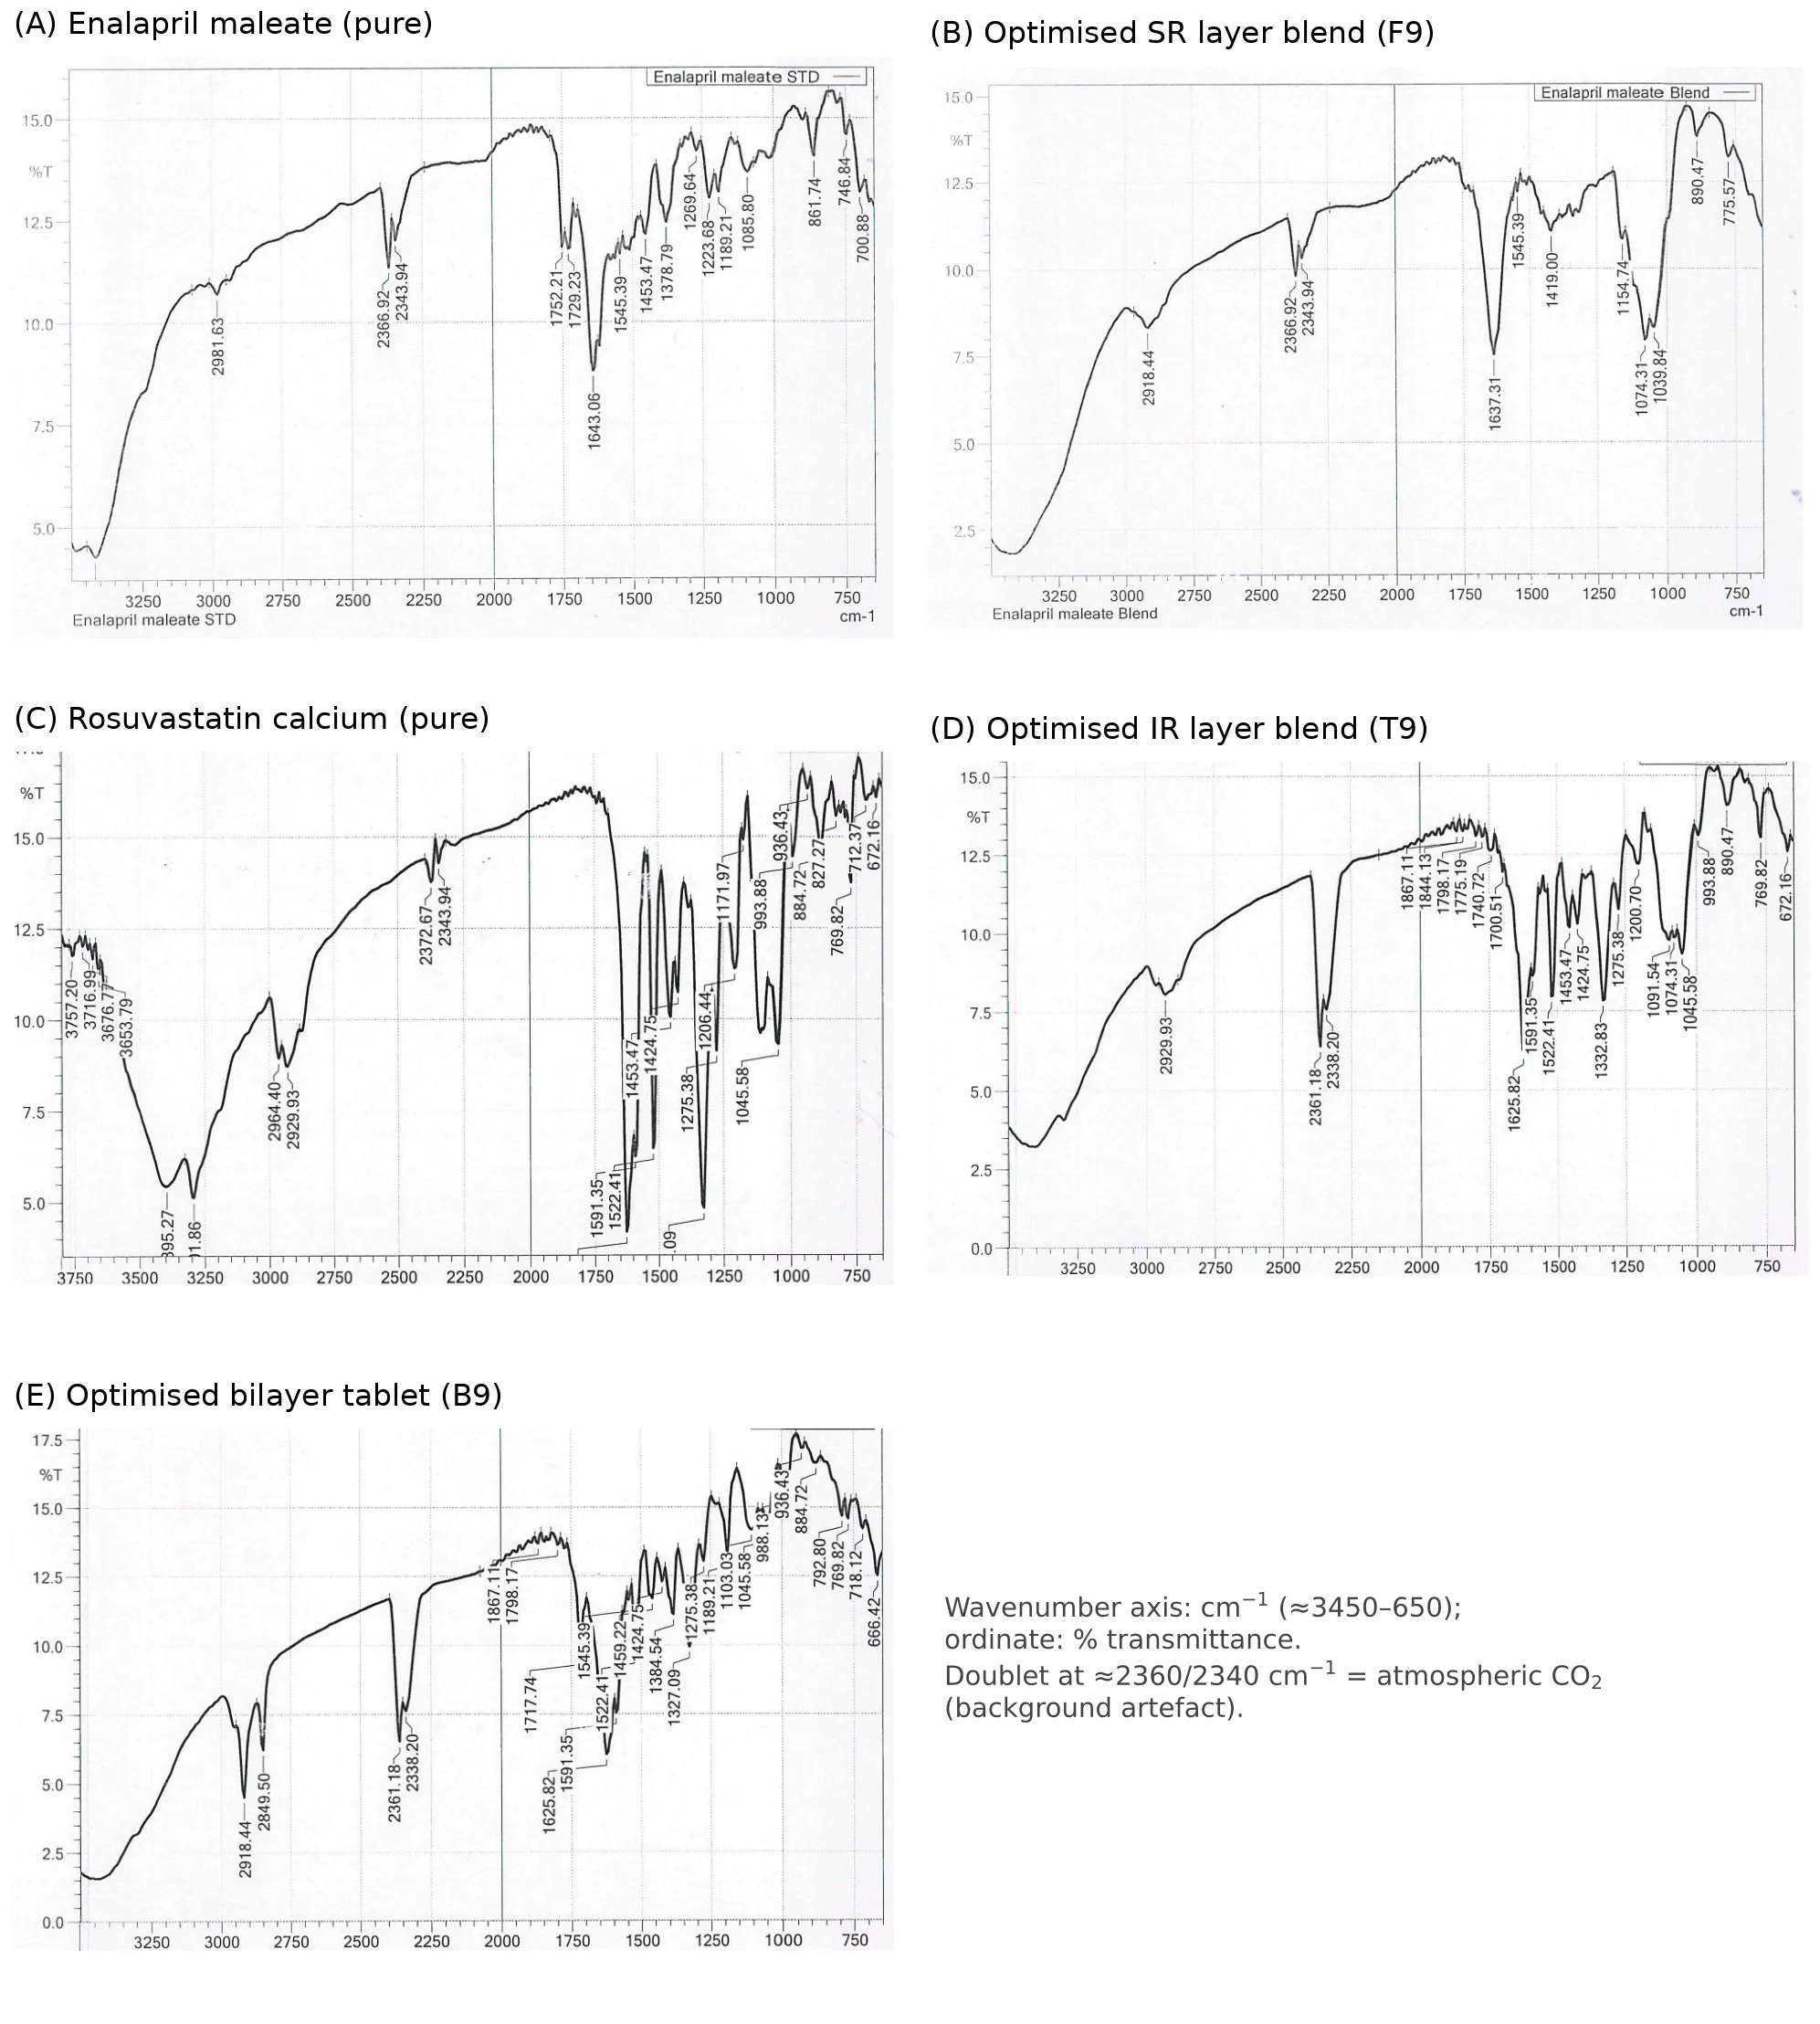
Figure 2: FTIR Spectra (KBr Disc) of (a) Enalapril Maleate, (B) Optimised SR Layer Blend F9, (C) Rosuvastatin Calcium, (D) Optimised IR Layer Blend T9 and (E) Optimised Bilayer Tablet B9. Abscissa, Wavenumber (cm−1); Ordinate, Transmittance (%). the Doublet at ≈ 2360/2340 cm−1 Arises from Atmospheric CO2.
Table 4: Diagnostic FTIR Bands (cm−1) of the Drugs, the Optimised Layer Blends and the Optimised Bilayer Tablet
| Assignment | Pure drug | Layer blend (T9 or F9) | Bilayer tablet B9 |
|---|---|---|---|
| RC: carboxylate/ring stretch | 1591 | 1591 | 1591 |
| RC: ring C=C/C=N | 1522 | 1522 | 1522 |
| RC: CH2/CH3 bending | 1453, 1425 | 1453, 1425 | 1459, 1425 |
| RC: SO2 asymmetric stretch | ≈ 1336 | 1333 | 1327 |
| RC: C–N/C–O | 1275, 1046 | 1275, 1046 | 1275, 1046 |
| EM: ester/acid C=O | 1752, 1729 | – | 1718 (broad) |
| EM: amide I | 1643 | 1637 | 1626 |
| EM: amide II/maleate | 1545 | 1545 | 1545 |
| EM: C–O stretch | 1189 | – | 1189 |
RC, rosuvastatin calcium (IR layer blend T9); EM, enalapril maleate (SR layer blend F9); –, not resolved.
Micromeritic properties and tablet quality
All blends exhibited good flow (Supplementary Table S2): angles of repose were 26.7–31.4° for the IR blends and 28.2–33.8° for the SR blends, Carr’s indices were 6.1–18.4% and Hausner ratios 1.06–1.22 23, 24. All bilayer batches complied with the pharmacopoeial limits (table 5). Mean tablet weights were within 299.4–301.4 mg (limit ± 5%), breaking force was 53–64 N and friability 0.39–0.72%, and no capping or delamination was observed. The content of both drugs was 96.9–99.8% of label claim. Breaking force increased and friability decreased from B1 to B9, in line with the higher polymer content of the later SR layers.
Table 5: Physical Properties of Bilayer Tablets B1–B9
| Batch | Weight (mg) | Thickness (mm) | Breaking force (N) | Friability (%) | RC content (%) | EM content (%) |
|---|---|---|---|---|---|---|
| B1 | 299.4 ± 1.8 | 5.82 ± 0.03 | 53.0 ± 2.0 | 0.72 | 97.24 ± 0.54 | 96.85 ± 0.62 |
| B2 | 300.2 ± 2.1 | 5.85 ± 0.04 | 54.9 ± 2.9 | 0.68 | 97.88 ± 0.61 | 97.42 ± 0.58 |
| B3 | 301.1 ± 2.0 | 5.87 ± 0.05 | 56.9 ± 2.0 | 0.64 | 98.15 ± 0.49 | 97.96 ± 0.67 |
| B4 | 299.8 ± 1.9 | 5.84 ± 0.03 | 57.9 ± 2.0 | 0.61 | 98.42 ± 0.52 | 98.20 ± 0.55 |
| B5 | 300.6 ± 2.2 | 5.89 ± 0.04 | 58.8 ± 2.9 | 0.58 | 98.76 ± 0.47 | 98.64 ± 0.51 |
| B6 | 301.4 ± 2.3 | 5.93 ± 0.05 | 59.8 ± 2.0 | 0.54 | 99.04 ± 0.58 | 98.92 ± 0.60 |
| B7 | 300.8 ± 1.7 | 5.95 ± 0.03 | 60.8 ± 2.0 | 0.49 | 99.21 ± 0.41 | 99.10 ± 0.46 |
| B8 | 300.3 ± 1.5 | 5.98 ± 0.02 | 62.8 ± 1.0 | 0.41 | 99.68 ± 0.38 | 99.54 ± 0.42 |
| B9 | 300.7 ± 1.6 | 6.01 ± 0.03 | 63.7 ± 2.0 | 0.39 | 99.84 ± 0.35 | 99.72 ± 0.40 |
Data are mean ± SD; n = 20 (weight), 3–5 (thickness), 10 (friability, content). Breaking force converted from kgf (× 9.807). RC, rosuvastatin calcium; EM, enalapril maleate.
Buoyancy, swelling and factorial effects of HPMC K100M and Carbopol 974P
All tablets floated. FLT decreased from 98 ± 2 s (B1) to 49 ± 1 s (B9), and TFT increased from 10.5 ± 0.3 h to 21.0 ± 0.4 h (table 6); with the exception of B1 (10.5 h) and B2 (11.2 h), every batch remained afloat for at least the 12 h release period. Swelling was rapid in the first hour (SI 52–87%) and continued to 112–181% at 12 h without loss of matrix integrity (fig. 3A).
First-order models in the coded factors described all six responses with R2 ≥ 0.94 (table 7). Both polymers were significant for every response, but Carbopol 974P exerted the larger effect, with coefficients 2.2–3.4 times those of HPMC K100M (fig. 3B). One coded step in Carbopol 974P (10 mg) shortened FLT by 19.0 s, lengthened TFT by 4.2 h, increased SI12 by 27.5 percentage points and delayed t50 by 0.93 h; the corresponding HPMC K100M effects were 6.2 s, 1.3 h, 8.3 percentage points and 0.29 h. Interaction terms were small and not significant, except for EM released at 8 h (β12 = 0.23, p = 0.045). Curvature in Carbopol 974P was significant only for TFT and Q8 (p = 0.022–0.023). The response surfaces (fig. 4) show that the shortest lag time, longest buoyancy and slowest release all lie at the high-polymer corner of the design space occupied by F9.
Table 6: Buoyancy and Swelling of Bilayer Tablets in 0.1 N HCL
| Batch | HPMC K100M/Carbopol 974P (mg) | FLT (s) | TFT (h) | SI at 1 h (%) | SI at 12 h (%) |
|---|---|---|---|---|---|
| B1 | 40/20 | 98 ± 2.4 | 10.5 ± 0.3 | 52.4 | 112.4 |
| B2 | 50/20 | 92 ± 2.1 | 11.2 ± 0.4 | 56.8 | 118.3 |
| B3 | 60/20 | 86 ± 1.9 | 12.0 ± 0.3 | 60.5 | 126.1 |
| B4 | 40/30 | 82 ± 2.0 | 12.8 ± 0.4 | 63.2 | 132.5 |
| B5 | 50/30 | 75 ± 1.8 | 14.1 ± 0.5 | 67.9 | 141.7 |
| B6 | 60/30 | 69 ± 1.7 | 15.3 ± 0.4 | 72.3 | 151.4 |
| B7 | 40/40 | 61 ± 1.5 | 17.5 ± 0.3 | 78.4 | 163.9 |
| B8 | 50/40 | 52 ± 1.3 | 20.4 ± 0.5 | 84.2 | 176.5 |
| B9 | 60/40 | 49 ± 1.2 | 21.0 ± 0.4 | 86.7 | 181.3 |
Table 7: First-Order Factorial Models for the Responses (Coded Factors)
| Response | Fitted model | R2 (adjusted R2) | p (X1) | p (X2) |
|---|---|---|---|---|
| FLT (s) | 73.8 − 6.17X1 − 19.0X2 | 0.993 (0.990) | 0.0001 | <0.0001 |
| TFT (h) | 15.0 + 1.25X1 + 4.20X2 | 0.954 (0.938) | 0.019 | <0.0001 |
| SI12 (%) | 144.9 + 8.33X1 + 27.5X2 | 0.988 (0.984) | 0.0006 | <0.0001 |
| EM released at 1 h (%) | 22.4 − 2.07X1 − 4.55X2 | 0.945 (0.926) | 0.006 | 0.0001 |
| EM released at 8 h (%) | 69.6 − 1.53X1 − 4.78X2 | 0.996 (0.994) | <0.0001 | <0.0001 |
| EM t50 (h) | 4.42 + 0.29X1 + 0.93X2 | 0.995 (0.994) | <0.0001 | <0.0001 |
X1, HPMC K100M; X2, Carbopol 974P. All coefficients were significant (p < 0.05). SI12, swelling index at 12 h; t50, time for 50% release.
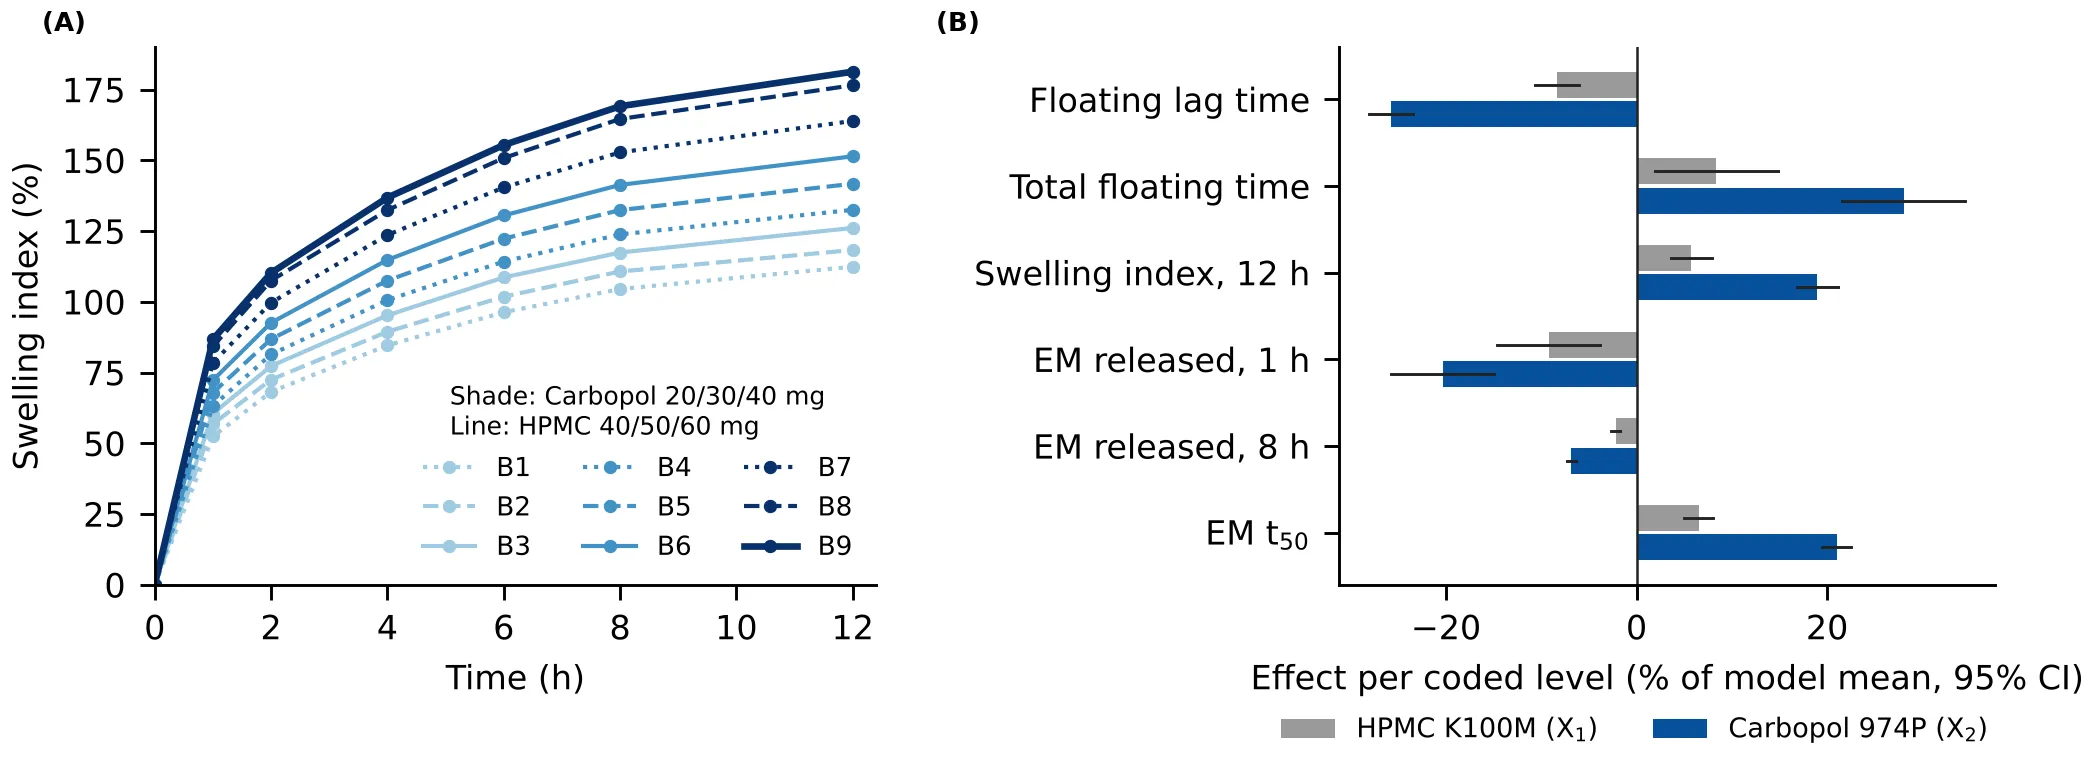
Fig. 3: (A) Swelling index of bilayer tablets B1–B9 in 0.1 N HCl at 37 °C; colour shade encodes the Carbopol 974P level and line style the HPMC K100M level. (B) Effect of one coded step of each polymer on each response, expressed as a percentage of the model mean, with 95% confidence intervals. EM, enalapril maleate; t50, time for 50% release.
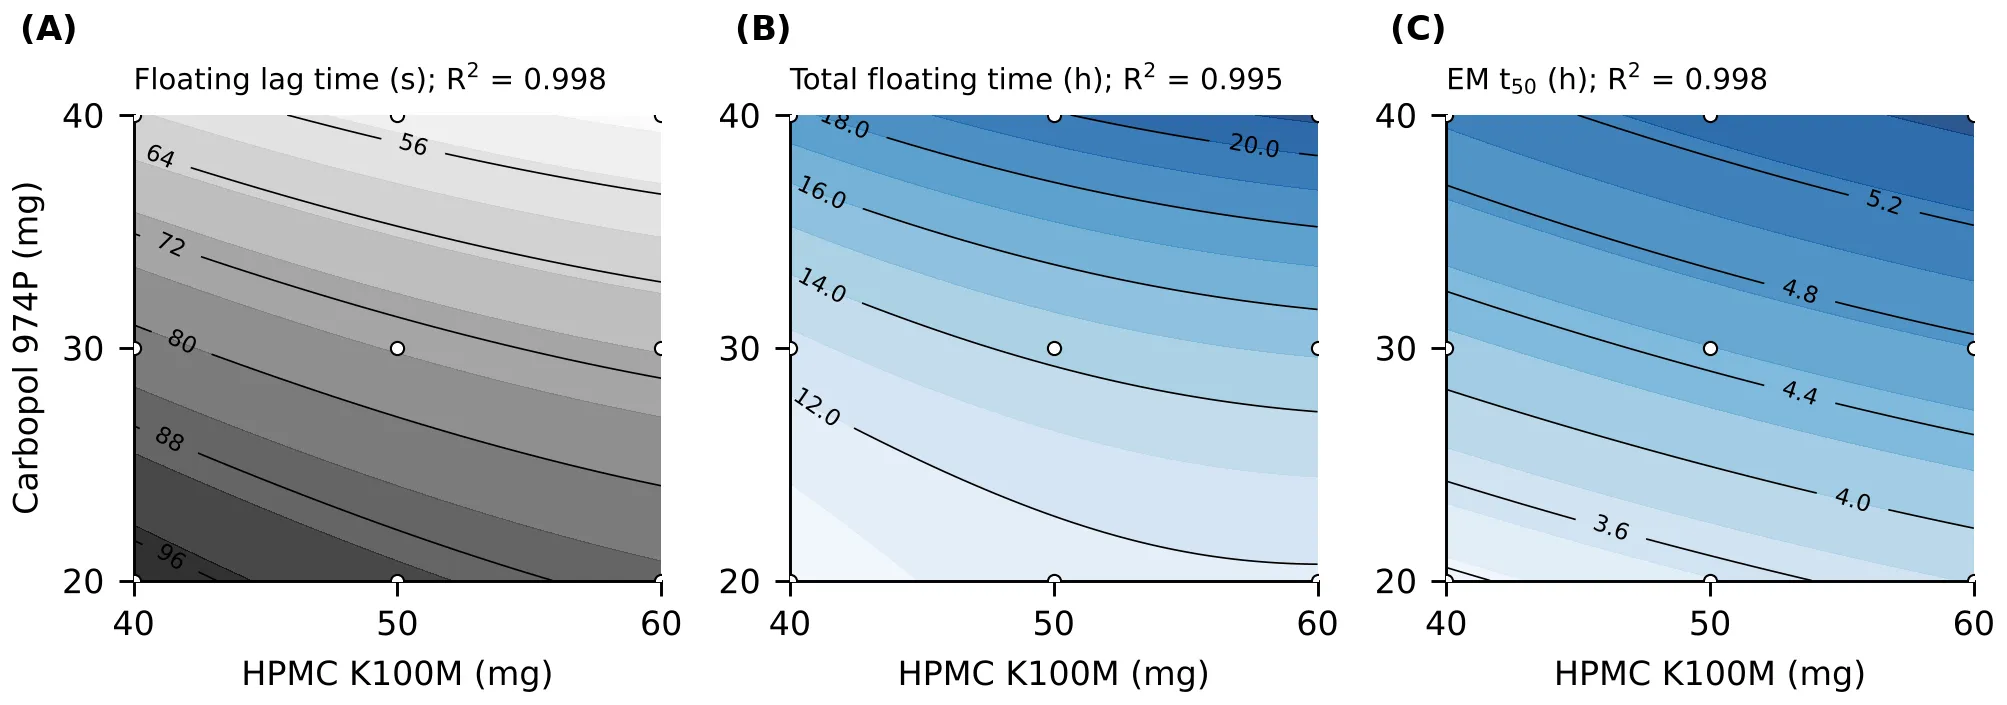
Figure 4: Contour Plots of (a) Floating Lag Time, (B) Total Floating Time and (C) Enalapril Maleate T50 as Functions of HPMC K100M and Carbopol 974P Levels, Generated from Full Quadratic Models (Open Circles, Design Points).
The dominance of Carbopol 974P in acidic medium warrants explanation. At pH 1.2, its carboxyl groups (pKa ≈ 6) are largely protonated, so it swells far less than at neutral pH 43, and ionic swelling cannot account for its effect. A more plausible mechanism is hydrogen bonding between the protonated carbomer carboxyl groups and the ether oxygens of HPMC; such interpolymer complexation would stiffen the hydrated gel, retain CO2 and retard water and drug transport. This hypothesis was not tested in the present work and could be examined by oscillatory rheology or texture analysis of the hydrated gel. A formulation feature also contributes: each polymer increment replaced soluble lactose (86 mg in F1 to 46 mg in F9). Lactose dissolves to form pores and weakens the gel, so part of each apparent polymer effect reflects removal of this channelling agent. Because the gas-generating couple was held constant, the faster flotation at high polymer levels most likely reflects more rapid formation of a continuous surface gel that entraps the CO2 generated in the first minute, rather than greater gas production. In batches B3–B9, TFT equalled or exceeded the 12 h release period, indicating that the gel framework persists beyond drug depletion.
In vitro drug release
Rosuvastatin calcium (IR layer). All batches released ≥ 85% of RC within 45 min and ≥ 90% within 60 min (fig. 5A). Release depended on both superdisintegrant type and level. An additive model described the 15 min data well (R2 = 0.998): Q15 = 64.7 + 8.2 (SSG) + 17.9 (crospovidone) + 0.97 × level (mg), with croscarmellose sodium as the reference category. Only the crospovidone layers (B7–B9) released ≥ 85% within 15 min, the criterion for very rapid dissolution, and B9 (9% crospovidone) released 91.4% at 15 min and 99.8% at 60 min. This ranking is mechanistically consistent: croscarmellose sodium and sodium starch glycolate are carboxymethylated polymers whose swelling is suppressed when their carboxylate groups are protonated in 0.1 N HCl, whereas crospovidone is non-ionic and acts mainly through wicking and strain recovery, which are pH-independent 44.
Enalapril maleate (floating SR layer). All batches sustained EM release over 12 h (91.4–95.4% at 12 h; fig. 5B). Increasing polymer content progressively lowered the 1 h release (from 28.4% to 13.6%) and DE12 (from 62.6% to 51.2%), and prolonged t50 from 3.2 to 5.5 h and MDT from 4.0 to 5.6 h (table 8). B8 and B9 gave similar EM release profiles (f2 = 77.6), whereas B1 and B9 did not (f2 = 45.5) 37. B9 was selected as the optimised formulation in preference to B8 because it combined the fastest RC release with the shortest lag time and the longest buoyancy.
In every batch, the release rate between 10 and 12 h (4.4–10.9% h−1) exceeded that between 8 and 10 h (3.9–4.9% h−1), and the acceleration was most pronounced in the high-polymer batches (B9: 10.9 vs 4.9% h−1). This pattern is not expected from diffusion through a gel that is still swelling at 12 h (fig. 3A). It may reflect late-stage gel erosion following polymer chain disentanglement, and it should be confirmed by additional sampling at 11 h with replicate vessels.
Table 8: Release Parameters of Enalapril Maleate from Bilayer Tablets B1–B9
| Batch | Q1h (%) | Q8h (%) | Q12h (%) | t50 (h) | DE12 (%) | MDT (h) | n (Korsmeyer–Peppas) | R2 |
|---|---|---|---|---|---|---|---|---|
| B1 | 28.4 | 76.3 | 93.4 | 3.17 | 62.6 | 3.95 | 0.54 | 0.987 |
| B2 | 26.9 | 74.5 | 91.4 | 3.46 | 61.0 | 4.00 | 0.56 | 0.986 |
| B3 | 25.1 | 72.8 | 94.2 | 3.75 | 59.7 | 4.40 | 0.59 | 0.986 |
| B4 | 23.8 | 70.9 | 95.3 | 4.12 | 58.0 | 4.69 | 0.59 | 0.988 |
| B5 | 22.6 | 69.3 | 93.6 | 4.50 | 56.3 | 4.79 | 0.59 | 0.990 |
| B6 | 21.4 | 67.8 | 95.2 | 4.80 | 55.0 | 5.06 | 0.60 | 0.991 |
| B7 | 20.3 | 66.4 | 94.5 | 5.06 | 53.8 | 5.17 | 0.61 | 0.991 |
| B8 | 19.2 | 64.7 | 92.8 | 5.36 | 52.2 | 5.25 | 0.63 | 0.991 |
| B9 | 13.6 | 63.8 | 95.4 | 5.53 | 51.2 | 5.57 | 0.79 | 0.984 |
Q1h, Q8h, Q12h, cumulative release at 1, 8 and 12 h; t50, time for 50% release; DE12, dissolution efficiency over 0–12 h; MDT, mean dissolution time. n was fitted to Mt/M∞ ≤ 0.60 (4–5 points). DE12 and MDT were calculated over 0–12 h by the trapezoidal method.
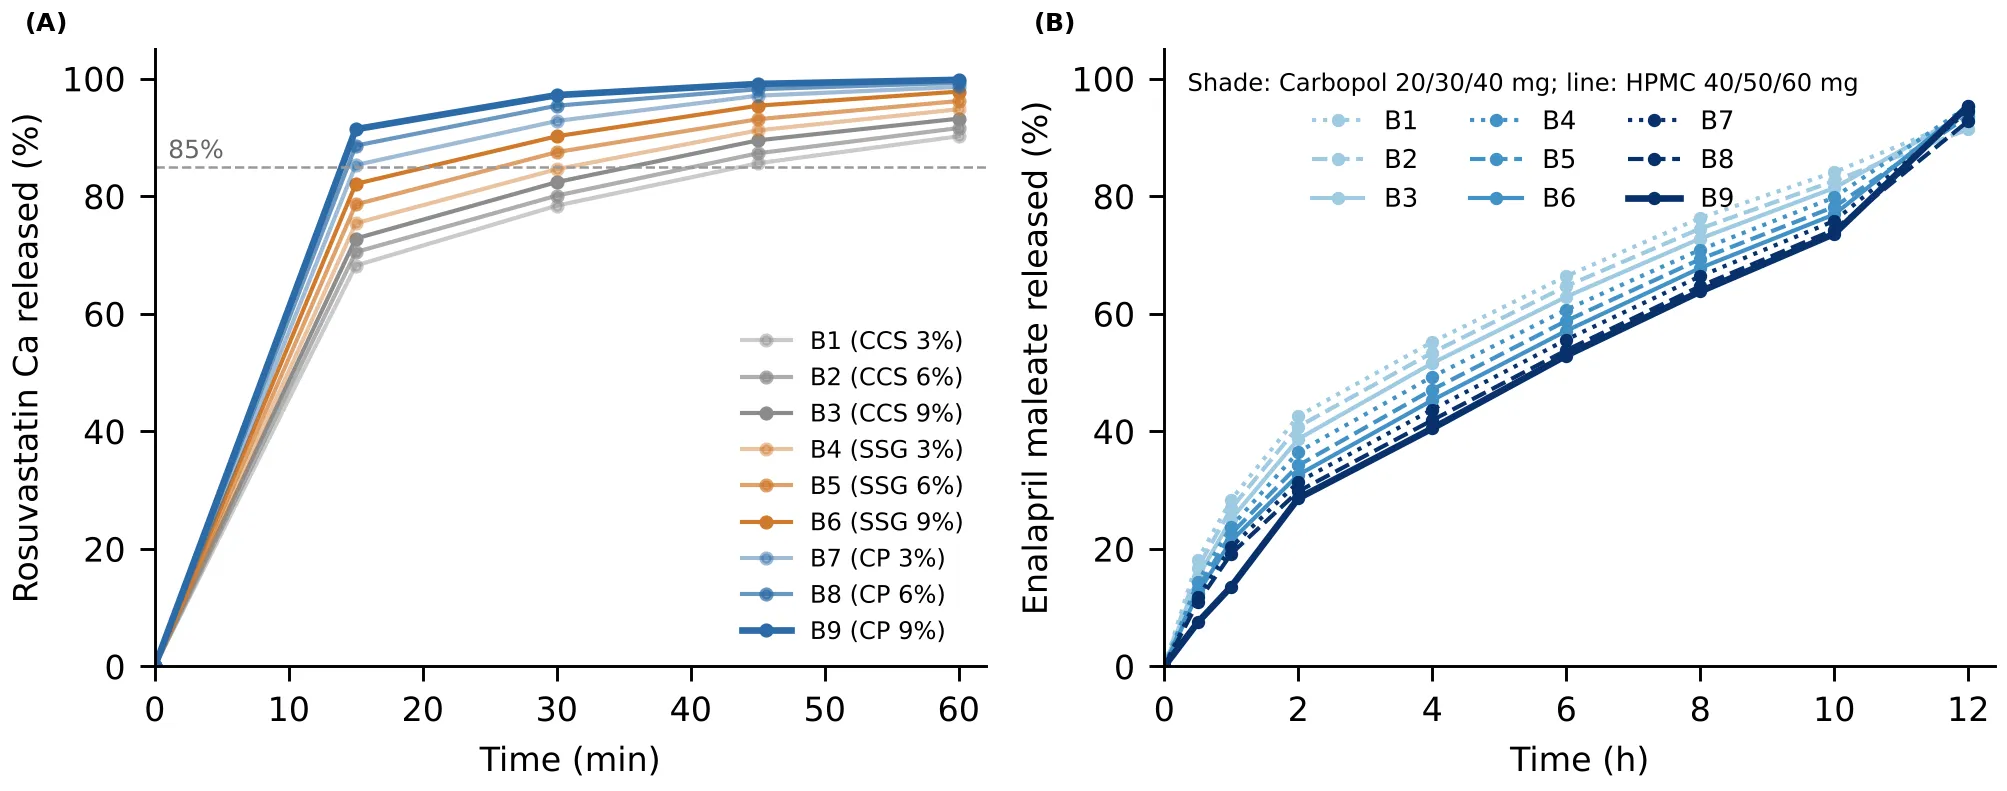
Figure 5: Cumulative Drug Release in 0.1 N HCl (USP Apparatus II, 50 rpm, 37 °C) of (a) Rosuvastatin Calcium from the IR Layers and (B) Enalapril Maleate from the Floating SR Layers of Bilayer Tablets B1–B9. CCS, Croscarmellose Sodium; SSG, Sodium Starch Glycolate; cp, Crospovidone; the Dashed Line in (a) Marks 85% Release.
Release mechanism of the optimised tablet
Model fits for B9 are compared in table 9 and fig. 6. On untransformed data, the first-order (AIC 29.5) and Hixson–Crowell (AIC 29.7) models fitted best and were practically equivalent (ΔAIC < 2), followed by the zero-order model (ΔAIC = 2.5), whereas the Higuchi model fitted worst (ΔAIC = 5.1). Near-equivalence of first-order and erosion-based descriptions is typical of swellable matrices, in which several mechanisms operate simultaneously, and no single empirical model should be over-interpreted.
The Korsmeyer–Peppas exponent was more informative. For B9, n was 0.79 (R2 = 0.984), within the anomalous range for a cylinder (0.45 < n < 0.89) and approaching Case II transport 31, 32. The Peppas–Sahlin fit yielded comparable diffusional and relaxational constants (kd = 8.48, kr = 6.98), so that the relaxation-to-diffusion ratio, (kr/kd)t0.45, increased from 0.82 at 1 h to 1.8 at 6 h 34. Release from B9 therefore shifts from diffusion-dominated to relaxation-dominated as the HPMC–Carbopol gel layer thickens, consistent with the behaviour described for HPMC matrices by Siepmann and Peppas 45. This transition explains the nearly constant release rate of about 5.6% h−1 between 2 and 10 h. Across the factorial batches, n increased with polymer content (0.54 in B1 to 0.63 in B8); the higher value for B9 (0.79) is driven largely by its low early release (7.5% at 0.5 h).
Table 9: Kinetic Model Fitting for Enalapril Maleate Release from the Optimised Tablet B9
| Model | Parameter(s) | R2 | Adjusted R2 | AIC |
|---|---|---|---|---|
| First-order | k1 = 0.143 h−1 | 0.961 | 0.955 | 29.5 |
| Hixson–Crowell | kHC = 0.201 %1/3 h−1 | 0.960 | 0.954 | 29.7 |
| Zero-order | k0 = 8.06% h−1 | 0.947 | 0.939 | 32.0 |
| Higuchi | kH = 23.3% h−0.5 | 0.927 | 0.915 | 34.6 |
| Korsmeyer–Peppas (≤ 60%, 5 points) | k = 0.138 h−n; n = 0.79 | 0.984 | – | – |
| Peppas–Sahlin (≤ 60%, m = 0.45) | kd = 8.48; kr = 6.98 | 0.981 | 0.962 | – |
Non-linear least-squares fits to data from 0.5–12 h unless stated otherwise. AIC, Akaike’s information criterion; –, not applicable.
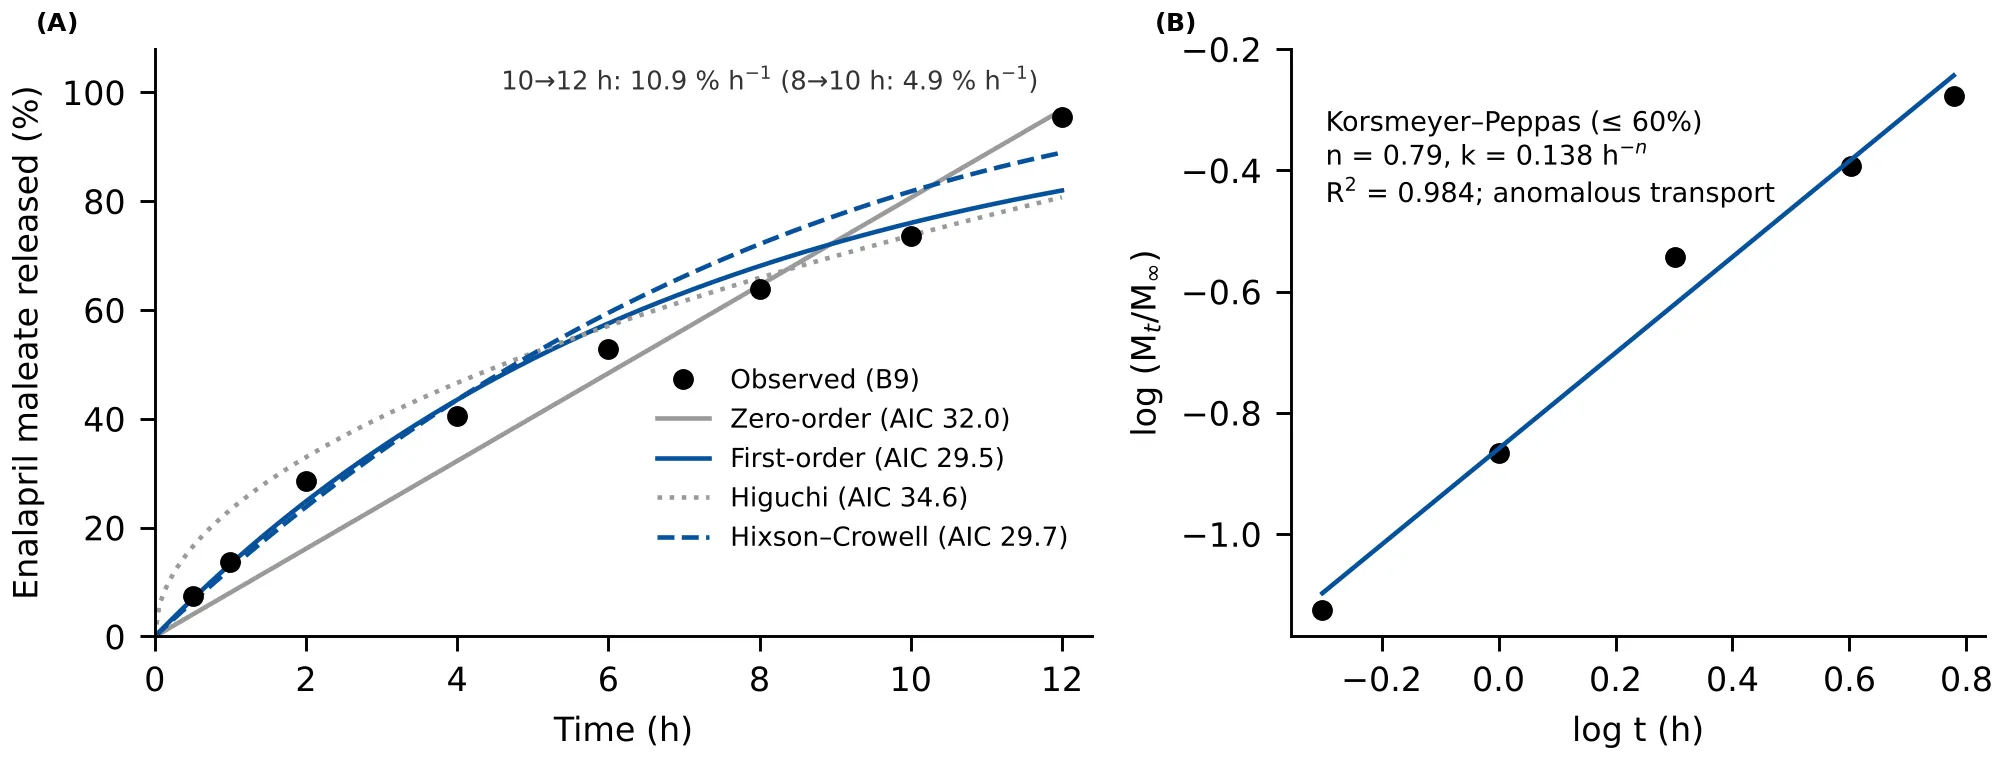
Figure 6: (A) Enalapril Maleate Release from the Optimised Tablet B9 with Non-Linear Model Fits (Zero-Order, First-Order, Higuchi and Hixson–Crowell). (B) Korsmeyer–Peppas Plot of the First 60% of Release (Log Fraction Released Versus Log Time).
Stability
B9 showed no change in appearance or bilayer integrity under either storage condition over 3 months (fig. 7). Assay declined linearly by about 0.30% per month at 25 °C/60% RH and about 0.54% per month at 40 °C/75% RH. At 3 months under accelerated conditions, the assay values were 98.21 ± 0.58% (RC) and 98.06 ± 0.63% (EM), well within the 90–110% limit. Under the same conditions, RC released at 60 min decreased from 99.80% to 97.84% and EM released at 12 h from 92.40% to 90.42%. The larger changes under accelerated conditions are consistent with moisture-mediated degradation: enalapril is prone to intramolecular cyclisation to its diketopiperazine and to hydrolysis to enalaprilat, and rosuvastatin to lactonisation. Because the UV method cannot resolve these degradants, the assay values indicate only the absence of gross drug loss, and a stability-indicating high-performance liquid chromatography (HPLC) method is required to confirm chemical stability. The stability batch showed a lower initial EM release at 12 h (92.40%) than the development batch (95.4%); storage-related changes are therefore expressed relative to the 0-month value of the stability batch.
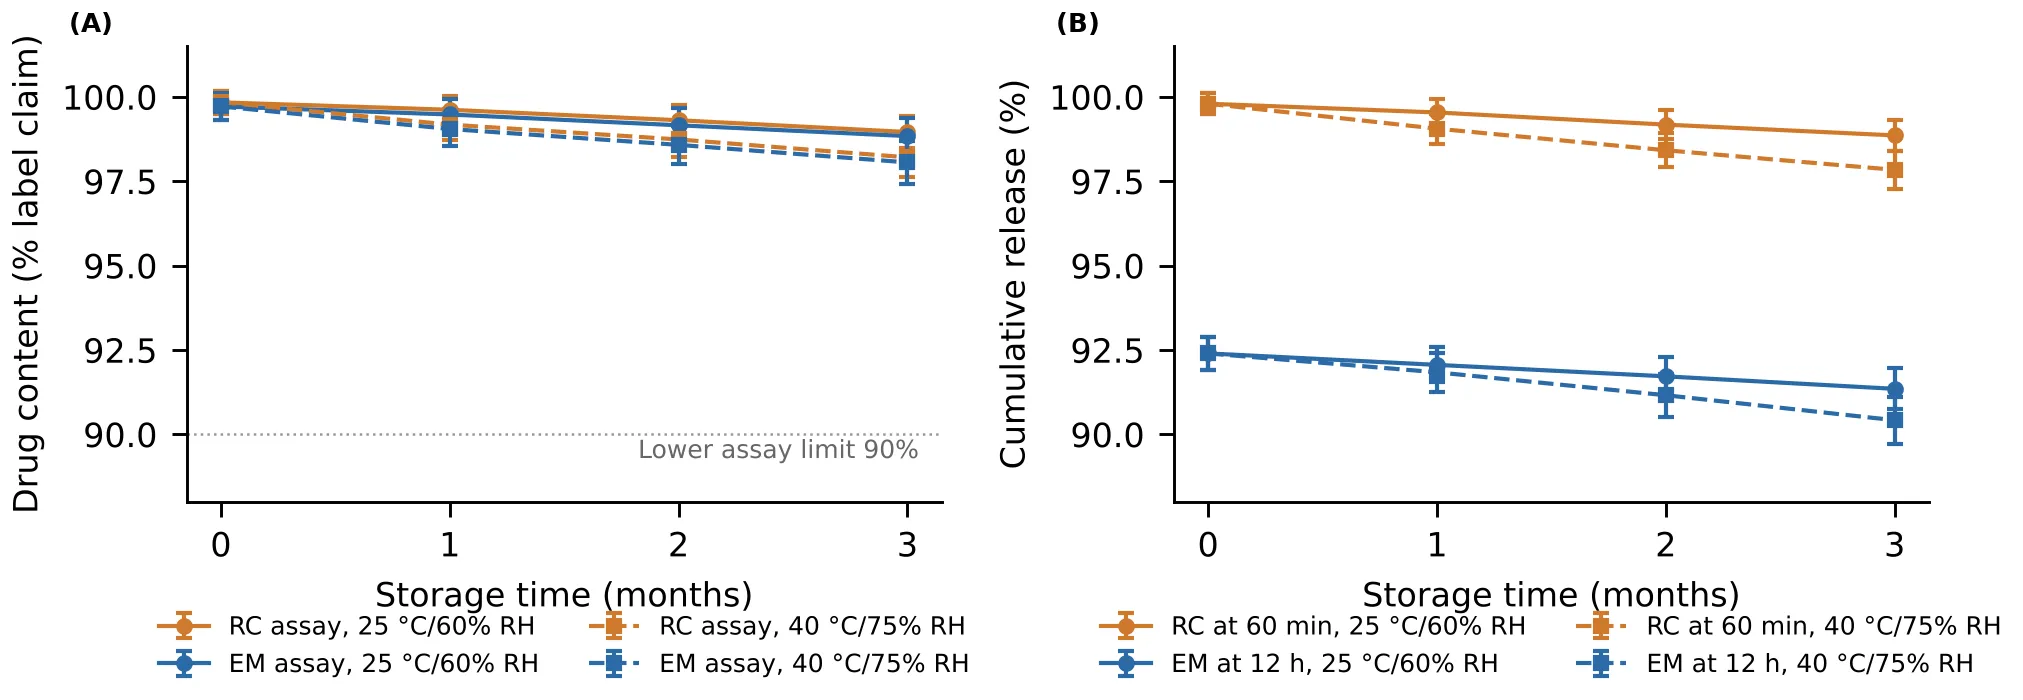
Figure 7: Stability of the Optimised Tablet B9 at 25 °C/60% RH (Solid Lines) and 40 °C/75% RH (Dashed Lines): (A) Assay of Rosuvastatin Calcium (RC) and Enalapril Maleate (EM); (B) RC Released at 60 min and EM Released at 12 H.
Comparison with reported floating bilayer FDCs
The performance of B9 compares favourably with earlier statin–antihypertensive floating bilayer tablets. The lovastatin–atenolol tablet floated after up to 15 min 15 and the simvastatin–atenolol tablet after 9 min 16, whereas B9 floated within 49 s. Each of those tablets remained buoyant for more than 12 h, compared with 21 h for B9, and all three statin layers released more than 90% of drug within about 30 min. Like those studies, the present work is limited to in vitro evaluation. Kulkarni and Bhatia observed that in vivo buoyancy (at 8 h by radiography) fell well short of in vitro buoyancy 15; the 21 h value obtained here should therefore be interpreted as a ranking metric rather than a prediction of gastric residence time.
Limitations
This study has several limitations. Evaluation was confined to in vitro testing in 0.1 N HCl; dissolution in biorelevant fed-state media and in vivo gastric retention and pharmacokinetic studies are required. The UV method was not stability-indicating, and its specificity against the placebo matrix at 206 nm remains to be demonstrated. Compatibility was assessed by FTIR alone. Finally, stability data cover 3 months, whereas ICH Q1A (R2) requires 6 months of accelerated and at least 12 months of long-term data for registration batches 40.
CONCLUSION
A floating bilayer FDC tablet combining an IR rosuvastatin calcium layer with an SR enalapril maleate layer was successfully developed by direct compression. The optimised tablet, B9, contained 9% w/w crospovidone in the IR layer and 60 mg HPMC K100M with 40 mg Carbopol 974P in the floating layer. B9 floated within 49 s, remained buoyant for 21 h, released 91.4% of rosuvastatin within 15 min and sustained enalapril release over 12 h by anomalous, increasingly relaxation-controlled transport (n = 0.79). The 32 factorial analysis showed that, in acidic medium, Carbopol 974P governs buoyancy, swelling and release two to three times more strongly than HPMC K100M, providing a quantitative basis for tuning the floating layer. The tablet retained its physical and UV-assayed quality attributes over 3 months under ICH accelerated conditions. In vivo gastric retention and pharmacokinetic studies are warranted to establish the clinical potential of this single-tablet combination.
AUTHORS' CONTRIBUTIONS
Dineshrajan D.: Investigation, formulation development, data curation and writing of the original draft. Mariyappan G.: Conceptualisation, methodology and supervision. Karthi J.: Resources, supervision and critical review of the manuscript. Prakash Murugan: Methodology, formal analysis, technical guidance and review and editing of the manuscript. All authors read and approved the final manuscript.
ACKNOWLEDGEMENT
The authors gratefully acknowledge AARTI PHARMA LABS LTD for providing rosuvastatin calcium and enalapril maleate as gift samples, and Sai Mirra Innopharm Pvt. Ltd., Chennai, India, for providing the facilities and technical support required for this work. The authors also thank the Management and Principal of Pallavan Pharmacy College for their encouragement and institutional support.
REFERENCES


D. Dineshrajan, G. Mariyappan, J. Karthi, P. Murugan, Gastroretentive Floating Bilayer Fixed-Dose Combination Tablet of Rosuvastatin Calcium and Enalapril Maleate: 3² Factorial Optimisation of Buoyancy and Biphasic Drug Release, Int. J. of Pharm. Sci., 2026, Vol 4, Issue 10, 3571-3585. https://doi.org/10.5281/zenodo.23637094
Severity: 8192
Message: substr(): Passing null to parameter #1 ($string) of type string is deprecated
Filename: frontend/article.php
Line Number: 706
Severity: 8192
Message: substr(): Passing null to parameter #1 ($string) of type string is deprecated
Filename: frontend/article.php
Line Number: 706
Severity: 8192
Message: substr(): Passing null to parameter #1 ($string) of type string is deprecated
Filename: frontend/article.php
Line Number: 741
 10.5281/zenodo.23637094
Severity: 8192
Message: substr(): Passing null to parameter #1 ($string) of type string is deprecated
Filename: frontend/article.php
Line Number: 890
Severity: 8192
Message: substr(): Passing null to parameter #1 ($string) of type string is deprecated
Filename: frontend/article.php
Line Number: 925
Severity: 8192
Message: substr(): Passing null to parameter #1 ($string) of type string is deprecated
Filename: frontend/article.php
Line Number: 925
Severity: 8192
Message: substr(): Passing null to parameter #1 ($string) of type string is deprecated
Filename: frontend/article.php
Line Number: 957
Severity: 8192
Message: substr(): Passing null to parameter #1 ($string) of type string is deprecated
Filename: frontend/article.php
Line Number: 957