

We use cookies to ensure our website works properly and to personalise your experience. Cookies policy
Department of Pharmaceutics, Siddhi’s Institute of Pharmacy, Nandgaon Murbad Thane 421401 (Affiliated to Dr. Babasaheb Ambedkar Technological University, Lonere Raigad).
Quantitative structure–activity relationship (QSAR) modelling connects the chemical structure of compounds described using values to their biological effects how the body handles them or their harmful properties. This review looks at how QSAR has changed since the 1960s starting with the Hansch and Free–Wilson methods and how it has grown into today’s use of machine learning. It covers the types of molecular descriptors the modelling techniques used validation practices and how QSAR helps in designing new drugs. The review is based on peer-reviewed studies found in PubMed, Scopus, Web of Science and Google Scholar with attention to guidelines from the OECD and recent improvements in the field. Traditional 2D and 3D-QSAR methods like CoMFA and CoMSIA are still useful especially when working with compounds and when understanding the science behind the results is important. For more varied datasets modern methods such as random forests support vector machines, deep neural networks and graph neural networks show better performance.. Success doesn’t come just from using advanced algorithms. The reliability of a QSAR model depends a lot on how well the data is cleaned and prepared how it is tested using both internal and external validation whether y-randomisation is done and how clearly the models applicability domain is defined. QSAR plays a role in many areas of drug development. It is used in screening to find promising compounds in optimizing lead molecules in predicting absorption, distribution, metabolism, excretion and toxicity (ADMET) and in predicting harmful effects.
Drug discovery is a costly and high-attrition process and computational methods are now used routinely to prioritise compounds before synthesis and testing [1,2]. Among these quantitative structure–activity relationship (QSAR) modelling is one of the oldest and widely applied. QSAR rests on the similar-property principle: similar molecules tend to exhibit similar biological effects so activity can be expressed as a mathematical function of molecular structure Activity = f (descriptors) [3,4].
The field began in the 1960s, when Hansch and co-workers related the potency of phenoxyacetic acids to Hammett electronic constants and the octanol–water partition coefficient [5,6] and Free and Wilson proposed a group-contribution model [7]. The introduction of three- field-based methods CoMFA [8] and CoMSIA [9] brought spatial information into the models. Over the two decades large public bioactivity repositories such as ChEMBL and PubChem [10,11] and advances in machine learning [12–14] have transformed QSAR into a throughput, data-intensive discipline [15,16].
Despite this progress published QSAR models vary widely in quality. Common pitfalls include curated structures, overfitting, misuse of the cross-validated coefficient q² as a proof of predictivity and the absence of a defined applicability domain [17–19]. This review therefore (i) summarises the evolution and theory of QSAR, (ii) compares descriptor types and modelling algorithms (iii) discusses validation and regulatory principles, (iv) highlights applications, in drug design and (v) outlines challenges and future directions.
2. Scope and Review Methodology
The searches used combinations of the terms "QSAR" "3D‑QSAR" " descriptors" "machine learning" "deep learning" "model validation" "applicability domain" "virtual screening" and "ADMET”.
Priority was given to (a) methodological papers, (b) validation and best‑practice guidelines including the OECD principles [20] (c) benchmark and application studies in drug discovery and (d) authoritative reviews.
Table 1 summarises the scope, in a PICO‑style format adapted for modelling studies.
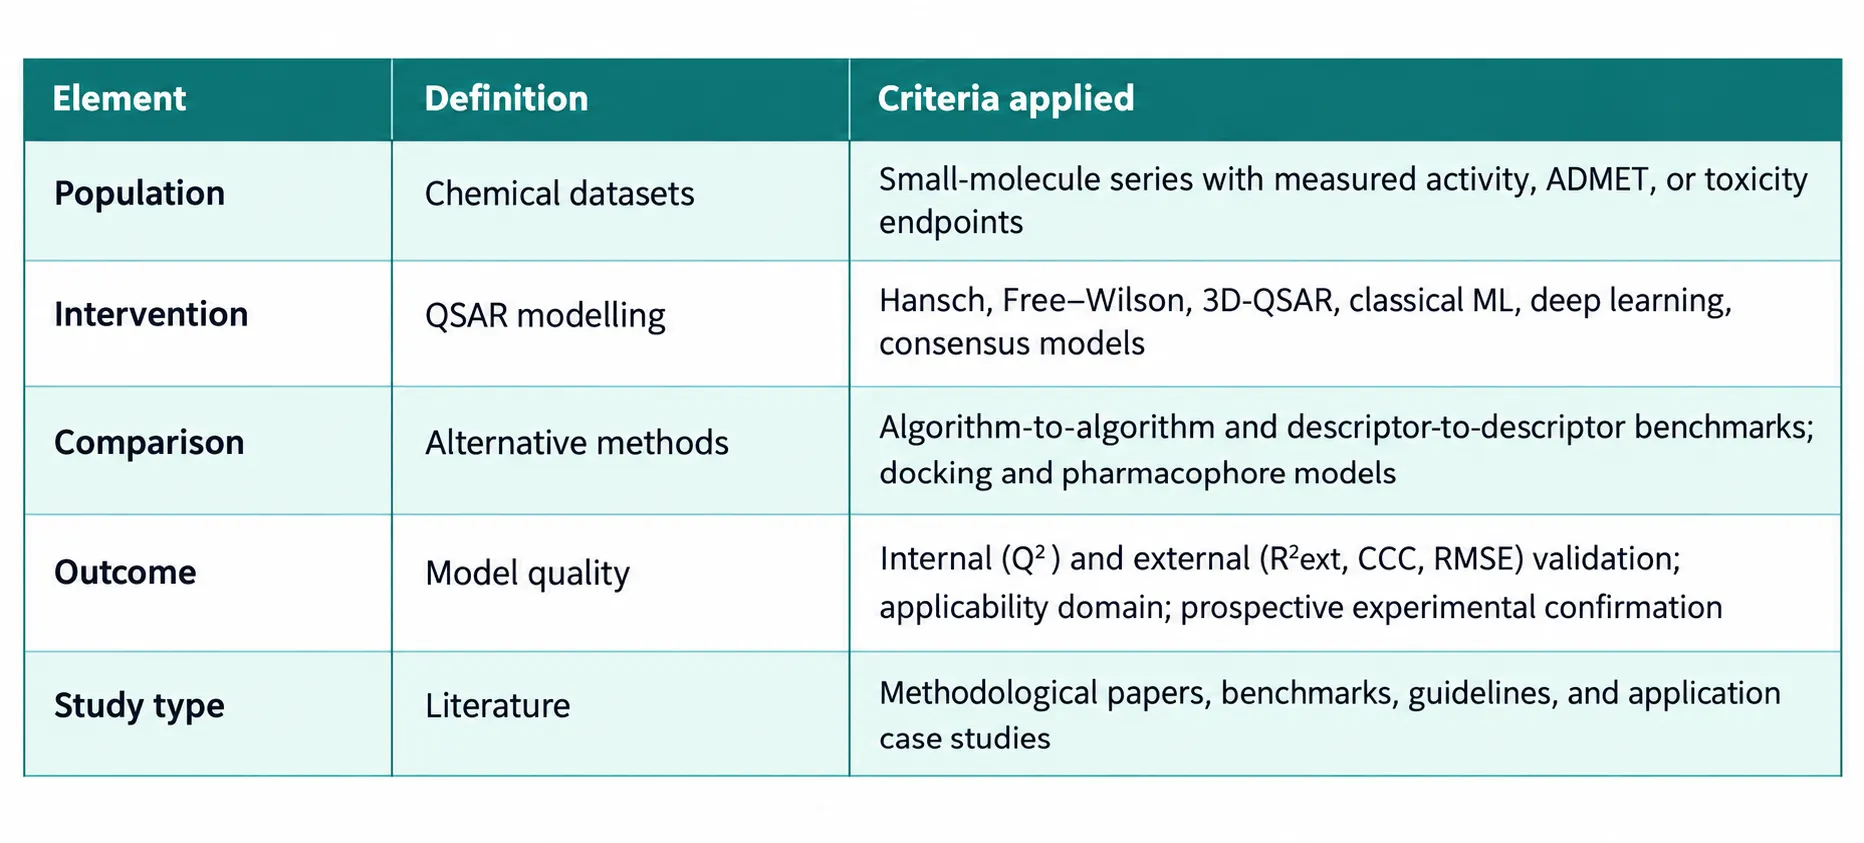
Table 1: Scope of the review (PICO-style framework adapted to computational studies)
3. Evolution and Fundamentals of QSAR
QSAR has evolved through four overlapping phases. In the phase of the 1960s QSAR used linear free‑energy relationships, where activity was modelled with lipophilic, electronic and steric parameters [5–7]. The second phase, during the 1980s to 1990s brought 3D‑QSAR. In 3D‑QSAR molecules are aligned on a grid and interaction energies are linked to activity using partial least squares regression [8,9,21]. The third phase in the 2000s saw QSAR move to descriptor spaces and ensemble learning and a stronger focus, on validation [20,22,23]. Today QSAR is dominated by learning and graph‑based methods and by approaches that aim to be explainable [13,14,24].
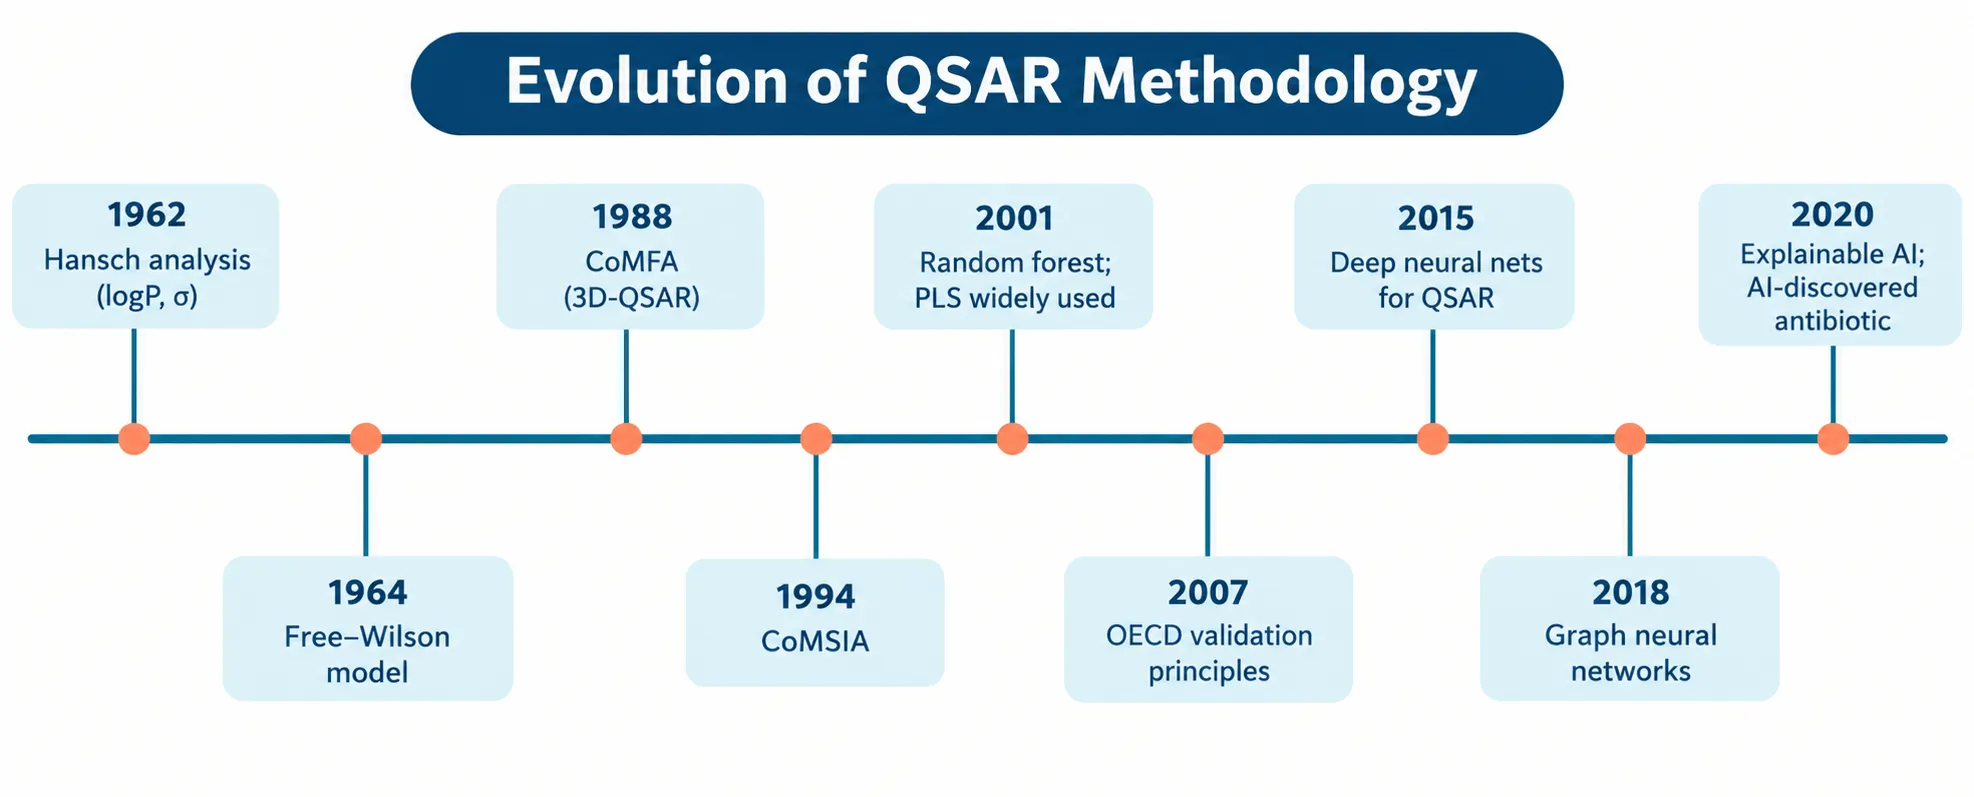
Figure 1: Timeline of major milestones in the development of QSAR methodology, from classical Hansch analysis to graph neural networks and explainable artificial intelligence
A QSAR model is built on three components. The first component is a training set of compounds that have comparable biological measurements. The second component is a representation of the chemical structure, such as descriptors or learned embeddings. The third component is an machine‑learning algorithm that links the representation to the response. The response variable can be continuous for example pIC₅₀ or pKᵢ for regression models or categorical such as /inactive or toxic/non‑toxic for classification models. Figure 2 shows the generalised workflow. In this workflow curation, validation and applicability‑domain assessment are as important, as model fitting [3,4].
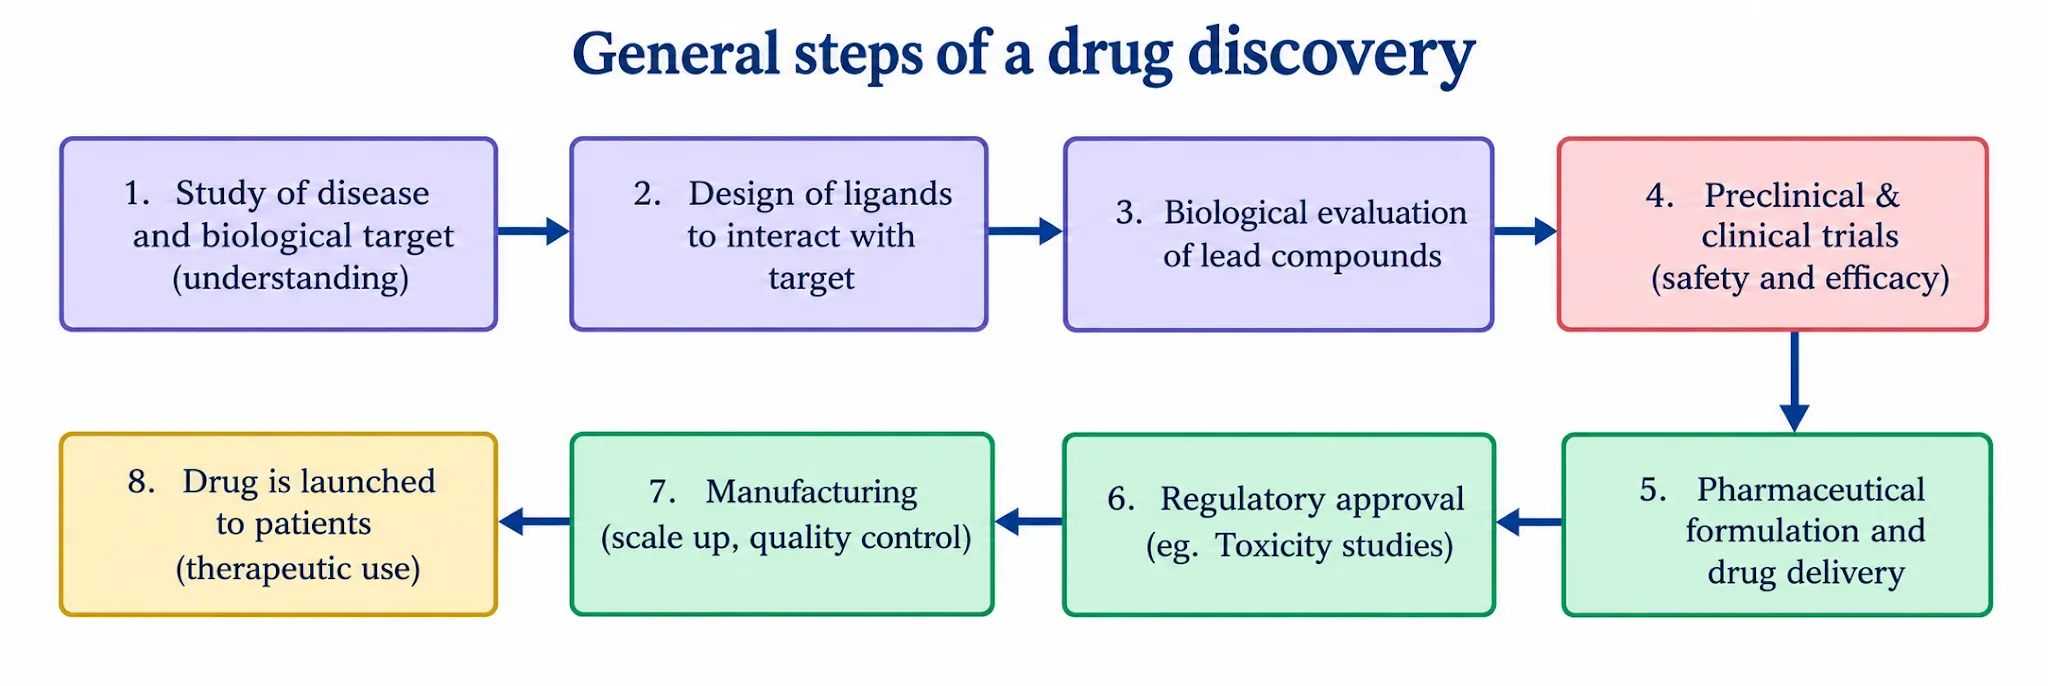
Figure 2: Generalised QSAR modelling workflow, from data curation through model building, internal and external validation, applicability-domain definition, and application in drug-design decision making.
4. Molecular Descriptors and Data Curation
4.1 Data curation
Model quality is limited by data quality. Structural errors including stereochemistry, salts, tautomers and duplicates and varying assay data are common in public databases. Fourches et al. Found that curation significantly improves predictivity [18]. Recommended steps include standardizing structures removing inorganic and mixture records handling duplicates and activity cliffs and when combining data from labs limiting to similar assay conditions [10,11,25].
4.2 Descriptor classes
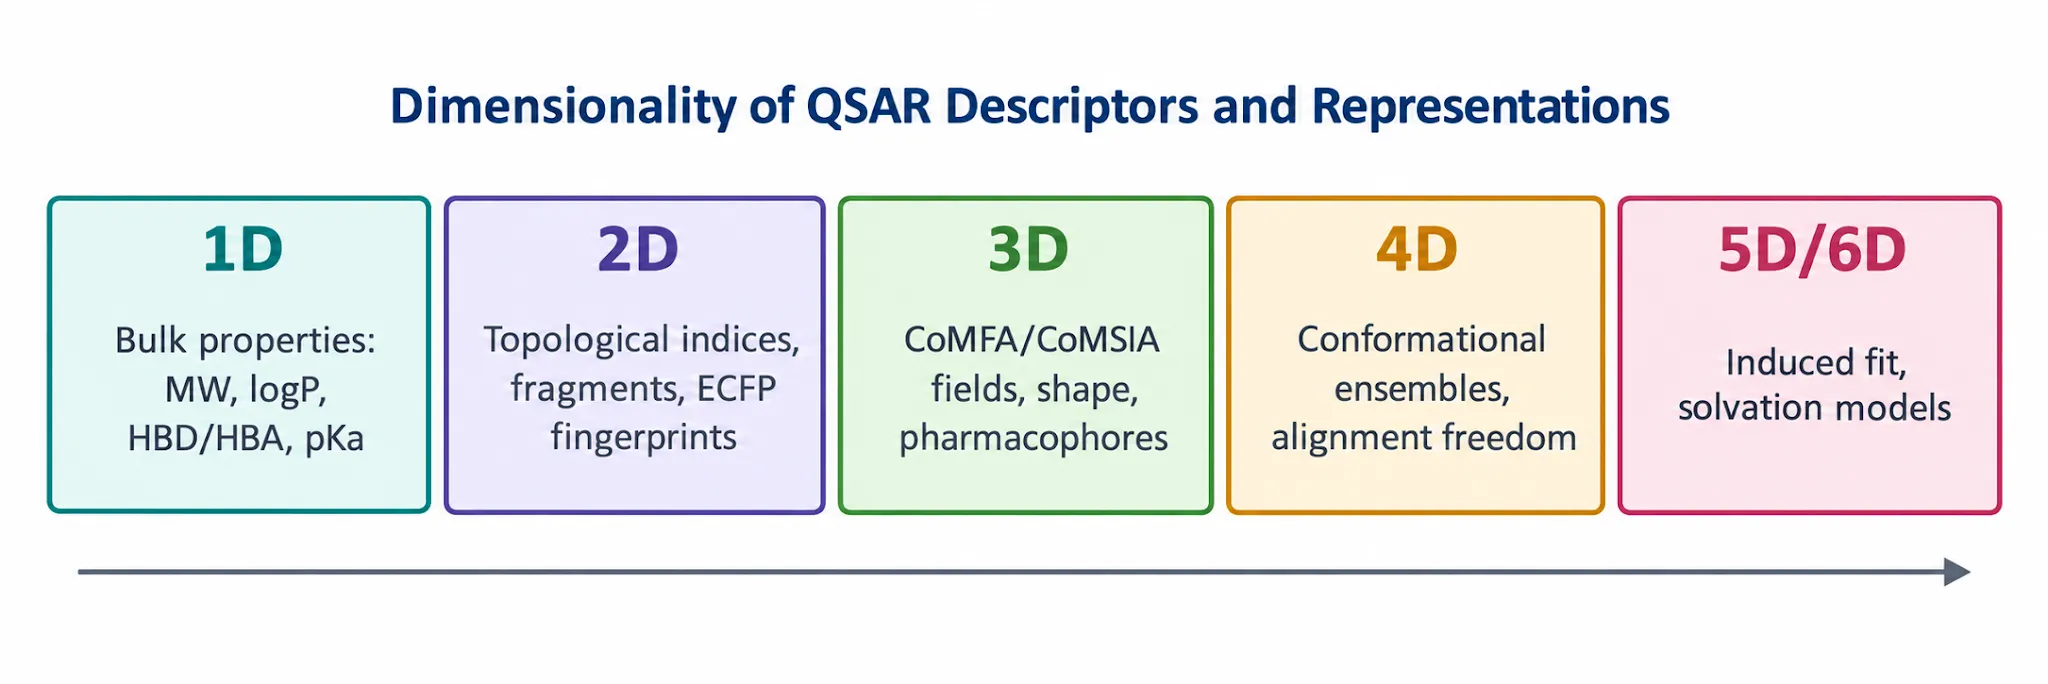
Figure 3: Hierarchy of QSAR descriptors and representations by dimensionality, with increasing structural information and computational cost from 1D bulk properties to multidimensional (5D/6D) approaches.
Descriptors are grouped based on the dimensionality of the information they represent (Figure 3). Many descriptors can be calculated using software like PaDEL-Descriptor and Mordred [26,27]. The theory is explained in detail by Todeschini and Consonni [28]. Circular fingerprints such, as ECFP are some of the commonly used 2D representations [29]. Table 2 shows the types of descriptors.
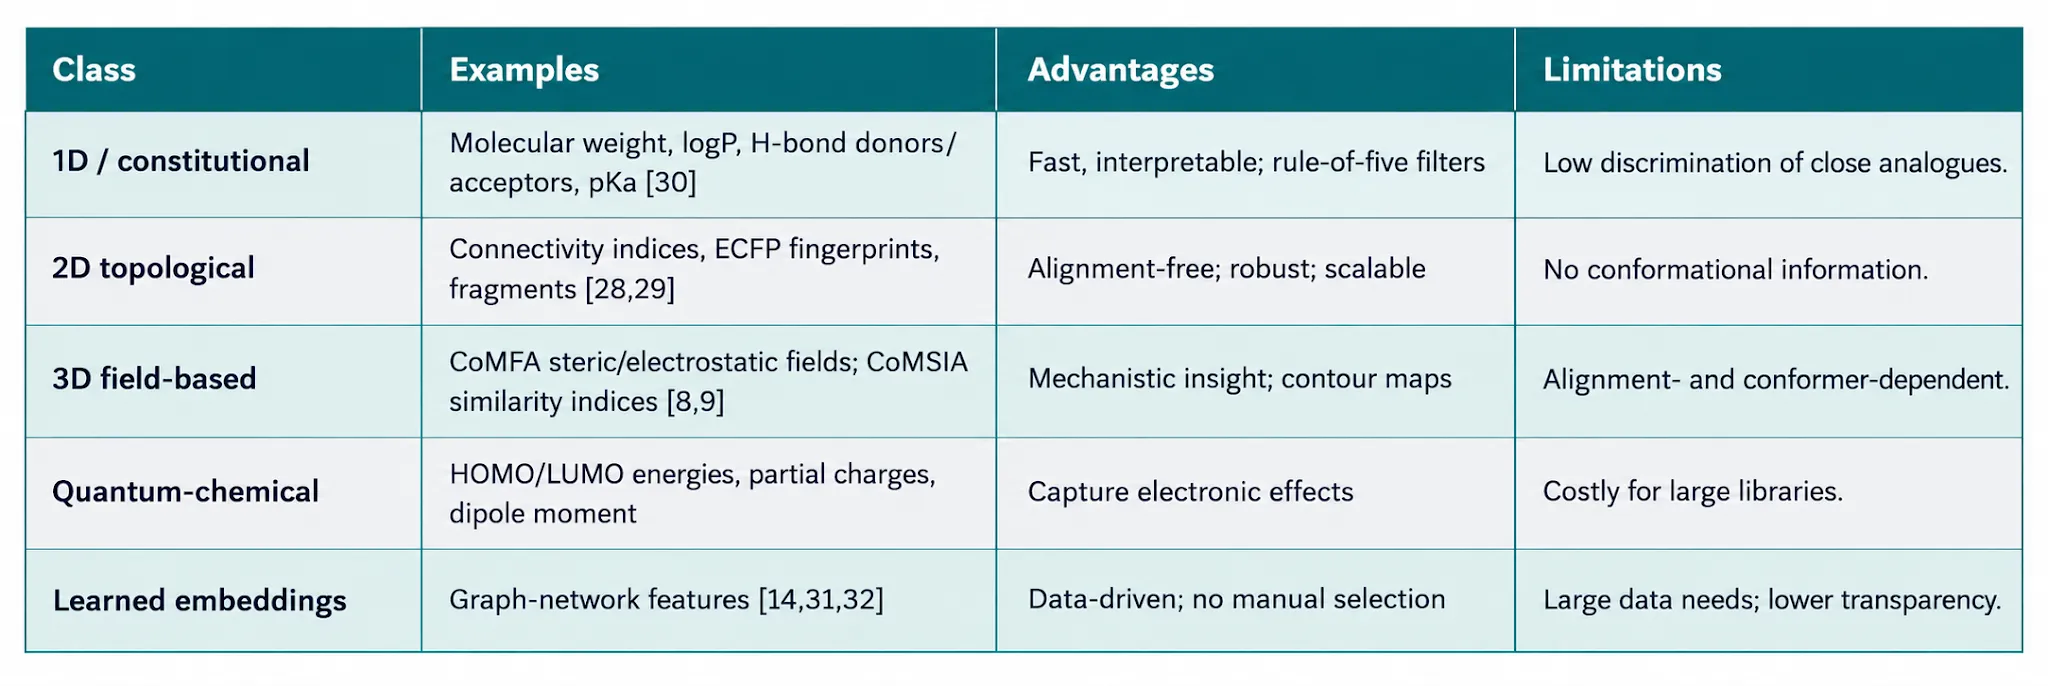
Table 2: Major Classes of Molecular Descriptors Used in QSAR
I find that when many descriptors are correlated with compounds we must use feature selection methods such as algorithms, stepwise selection, LASSO or random‑forest importance. We also need dimensionality reduction techniques, like PCA or PLS. These steps are essential to limit overfitting [4,21].
5. Modelling Algorithms
regression, especially multiple linear regression (MLR) and PLS continues to be useful for small similar datasets because the coefficients can be understood directly [4,21]. Non-linear machine-learning methods are now common for datasets. Random forests use separate decision trees and are good with noise need very little adjustment and show which variables are most important [12,22]. Support vector machines (SVM) use functions to handle non-linear patterns and work well with datasets that are not too big [33]. Multi-task deep neural networks, trained with thousands of features across targets did better than random forests in a big industry test [13] and DeepTox won the Tox21 challenge [34].
In times graph neural networks (GNNs) take information directly from the molecular graph so there is no need for manual feature creation [31,32]. Directed message-passing networks reached the results, on many tests [14,25] and a GNN-based search found a new type of antibiotic called halicin [35]. However when looking closely it is clear that on noisy data, simple methods and groups of models often do just as well as deep models [16,36]. Table 3 shows the strengths of the different algorithms.
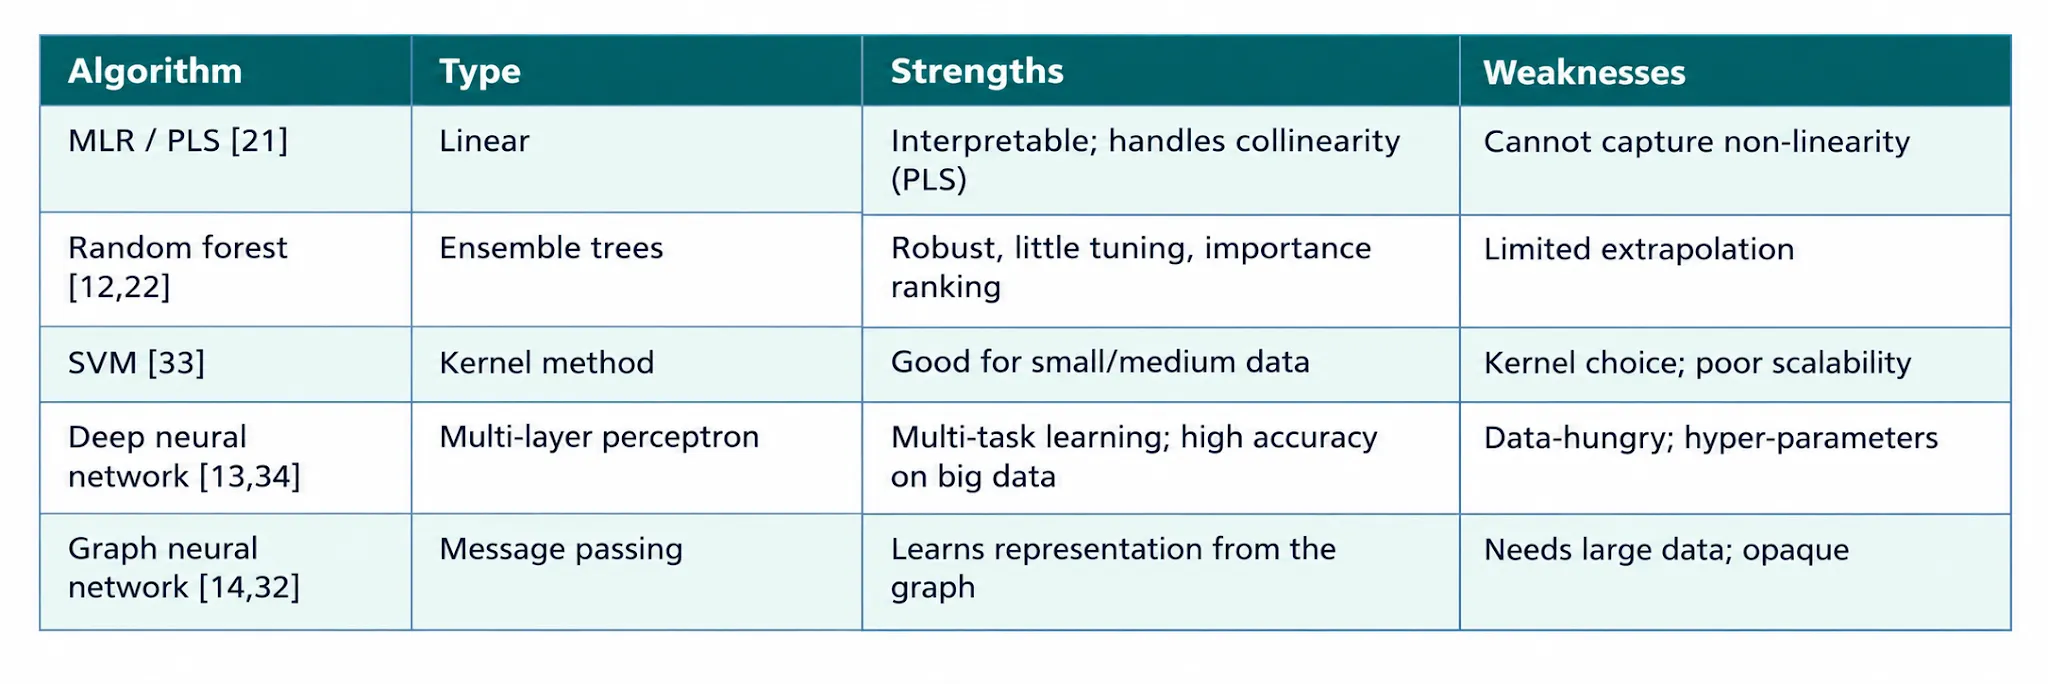
Table 3: Comparison of commonly used QSAR modelling algorithms
6. Validation and the Applicability Domain
The OECD principles state that a QSAR model must have an endpoint a well-defined algorithm, a defined domain of applicability good measures of fit, robustness and predictivity and a mechanistic explanation when possible [20]. Validation of a QSAR model involves steps [19,23].
Internal validation uses methods like leave-one-out or k-fold cross-validation to calculate Q². A high Q² value is important. It is not enough to ensure that the model can predict well [17]. To check for correlations y-randomisation is used. This means the activity values are randomly shuffled. A good model should not work well when the response is scrambled [37].
The important step is external validation, which uses a separate test set that was never involved in building or tuning the model. This test set shows how well the model performs on data. Common metrics, for this include R²ext, RMSE and the concordance correlation coefficient (CCC) [17,38,39]. Acceptance criteria that are often used are shown in Table 4.
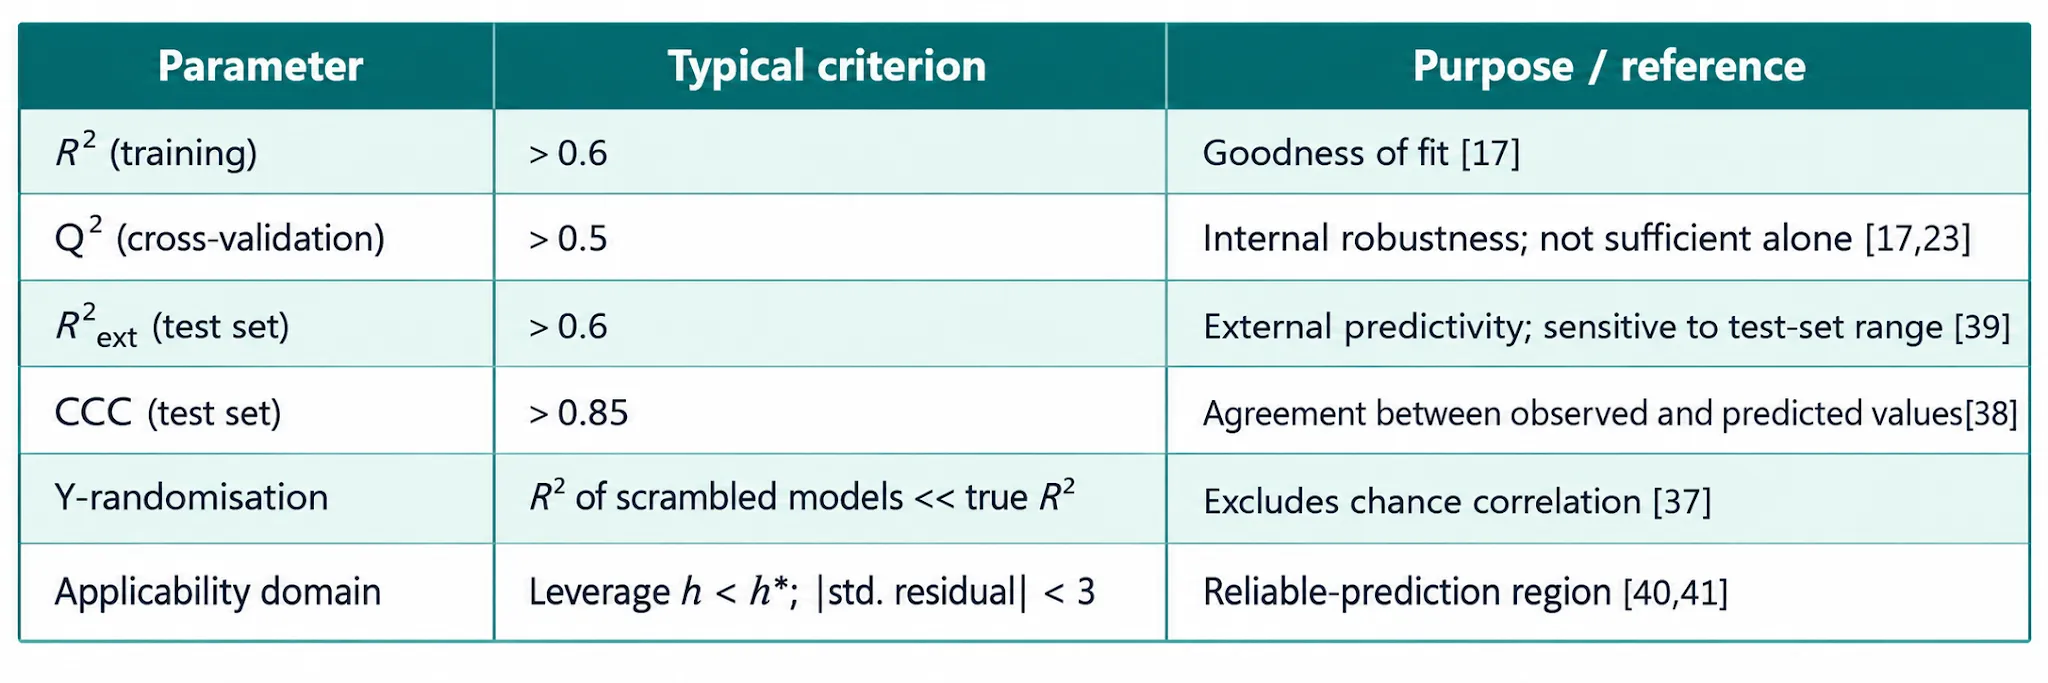
Table 4: Frequently used statistical criteria for QSAR model validation
The applicability domain, abbreviated AD sets the chemical space where predictions can be trusted. Methods used to determine this domain include geometric techniques, distance‑to‑model calculations and the leverage approach that is shown in the Williams plot [40,41]. If a compound lies outside the AD it should be flagged, not reported as reliable. Figure 4 shows the diagnostic plots that help validate the model.
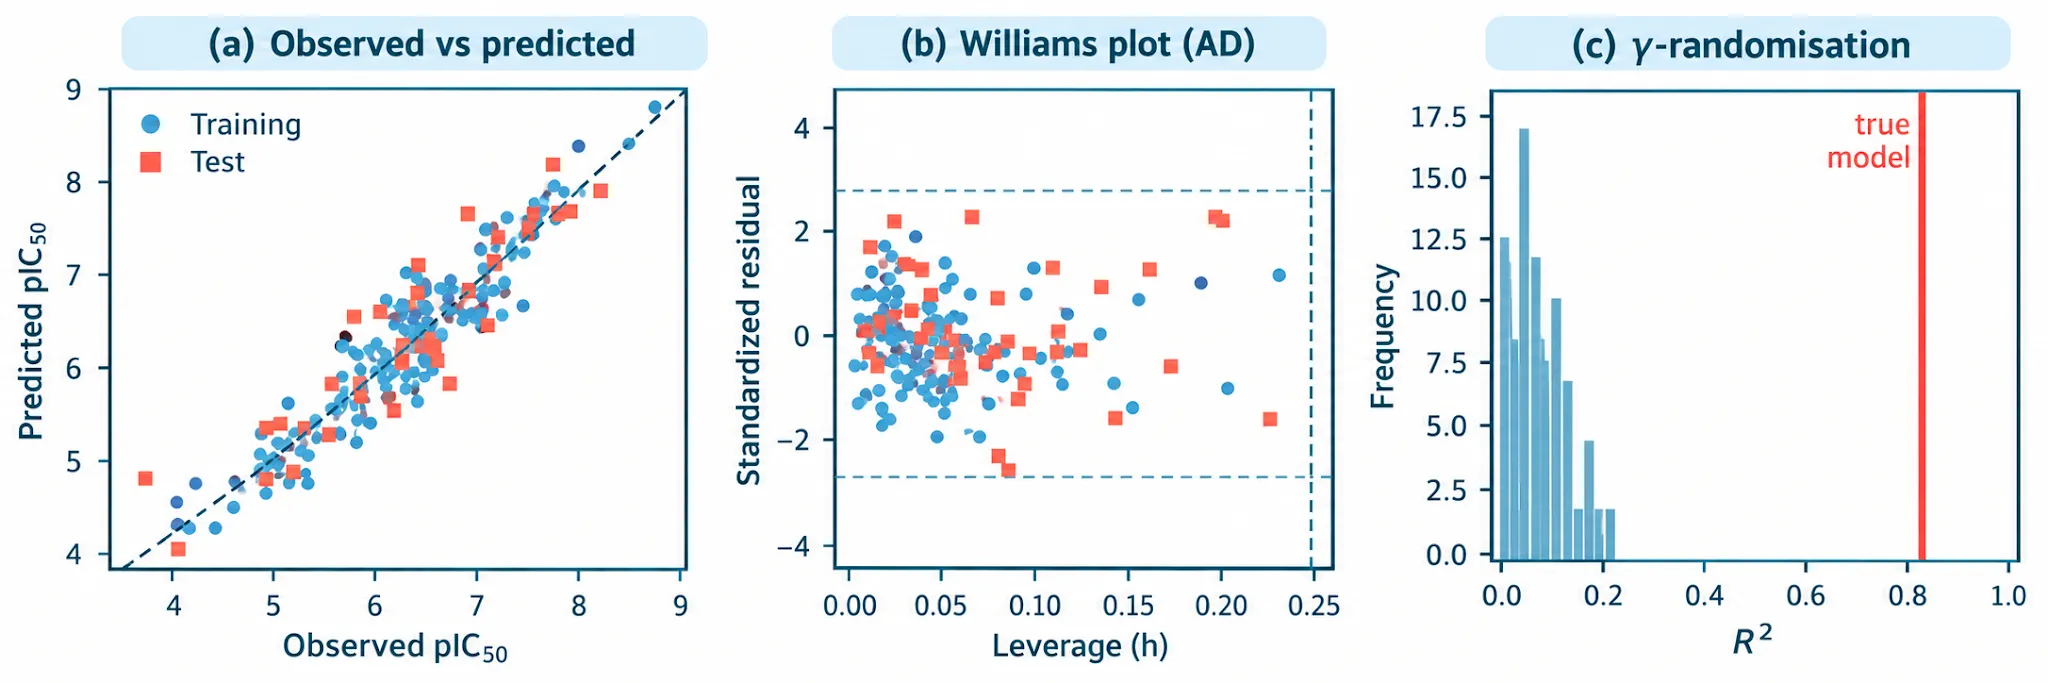
Figure 4: Illustrative validation diagnostics (simulated data for demonstration only): (a) observed versus predicted activity for training and test sets; (b) Williams plot defining the applicability domain by leverage (h*) and standardised residuals (±3); (c) y-randomisation test, in which the true model (red line) is well separated from models built on scrambled activities.
7. Applications in Drug Design
7.1 screening and lead optimisation
QSAR models help scientists sort through huge virtual collections of molecules. QSAR models reduce the number of compounds that need to be built or tested making the search faster. QSAR models also show which parts of a molecule should change to improve the lead. 3D‑QSAR contour maps reveal where large groups, hydrogen‑bond donors or charges are beneficial giving clues for medicinal chemists [8,9]. When the target shape is partly known, QSAR models, together with docking and pharmacophore models give extra support based on how the ligand looks [2,15].
7.2 ADMET and toxicity prediction
Poor pharmacokinetics and high toxicity still cause many drug projects to fail later. Simple physicochemical rules, such as Lipinski’s rule of five are early filters for oral absorption [30]. Multi‑task deep learning models predict toxicity points from the Tox21 programme. QSAR models are also accepted by regulators as a way to reduce animal testing when they are validated following OECD principles [3,20].
7.3 Learning-enabled discovery
A directed‑message‑passing neural network trained on growth‑inhibition data from a few thousand molecules was used to screen more than 100 million compounds. The network found halicin and other antibacterial candidates, with different structures and these were later confirmed in experiments. This example shows how modern QSAR can go beyond tweaking known scaffolds and can hop between different scaffolds across a large chemical space [1,16].
8. Future Perspectives
Data quality and quantity. I find that experimental noise, assay heterogeneity and publication bias reduce the accuracy that can be achieved and that benchmark datasets may not match the realities of discovery settings [18,25,36]. Activity. Extrapolation. I see that small structural changes can lead to differences in potency and that most models struggle with this effect. Interpretability. Black‑box models need explanations after the fact and tools like SHAP and attribution maps help medicinal chemists make sense of predictions [24,42]. Uncertainty quantification. I believe that calibrated confidence estimates and defined applicability domains are crucial when making decisions [16,40]. Prospective validation. I think that retrospective statistics need to be paired with synthesis and testing just like the halicin study showed [35].
Promising directions include transfer learning and multi‑task learning that make the most of data the blending of QSAR with structure‑based design and molecular dynamics federated learning that lets organisations collaborate without revealing proprietary structures and generative models that suggest new molecules while keeping QSAR‑predicted properties in check [1,16,36]. I feel that adopting community standards, for curation, reporting and benchmarking will be essential if we want results to be reproducible [3,20].
CONCLUSION
QSAR has changed over six decades from linear relationships into a group of data-driven methods that help almost every part of drug discovery. The information shown here shows that good predictions mainly rely on collected data the right descriptors, strong outside testing and a clear area where the model can be used not just, on how complicated the algorithm is. Deep and graph-based models help QSAR reach more varied chemical areas but they need to have ways to explain their results and show how sure they are. When used with experiments and other tools that look at structures QSAR will keep being a part of smart and affordable drug development.
REFERENCES

Araj Ranee D., Jadhav Mohit M., Adhikari Samidha S., Adhikari Ishawari L., Padwal Krutika B., Quantitative Structure–Activity Relationship (QSAR) in Modern Drug Design: A Review of Methods, Validation, Applications, and Future Perspectives, Int. J. of Pharm. Sci., 2026, Vol 4, Issue 11, 2285-2293. https://doi.org/10.5281/zenodo.24271173
 10.5281/zenodo.24271173