

We use cookies to ensure our website works properly and to personalise your experience. Cookies policy
1Department of Pharmaceutical Analysis,PES college of Pharmacy, Hanumanthanagar,banglore,Karnataka.
2Department of Pharmacology,Ikon college of Pharmacy Bheemanahalli,Banglore,Karnataka.
A simple isocratic RP-HPLC method for the determination of Lidocaine was developed. Separations were performed on Xterra RP C18 column (150×4.6×3.5µm) particle column at 30?C.The mobile phase consisted of buffer and acetonitrile (70:30%v/v) pH was adjusted to 8 with 40%w/v sodium hydroxide. Lidocaine hydrochloride was internal standard. The flow rate was 1ml/min and uv detection was performed at 230nm.Liocaine was resolved on the stationary phase and the retention time was 4.77 min with the total run time of 30min..The detector response was found linear with a coorelation coefficient of 1.The calibration curve were linear in the concentration of range of 2-20 ?g/mL for Lidocaine..
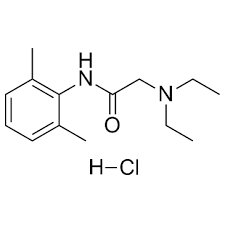
Figure 1: Structure of Lidocaine Hydrochloride
Lidocaine (LID) belongs to the family of narcotic drugs. It can be used as a topical anesthetic by stabilizing the nervous membrane which produces sensation of pain. It can be used to relieve the discomfort resulting from the virus Herpes which affects the skin as well as it is used in different types of minor surgery and dental treatment, childbirth and epidural anesthesia at birth, it is used particularly for the treatment of cardiac arrhythmias after having a heart attack.
[1]
Various formulations of Lidocaine are available in market. On basis of site of application formulations are classified into topical and parental. Topical formulations include gel, ointment, spray, Transdermal Patch. Parental formulations are available rather as Lidocaine-HCL or in combination with epinephrine to subside pain at site of application [2], HPLC-UV [3] thin-layer chromatography (TLC) for the Determination of Hydrocortisone Acetate and Lidocaine in a Pharmaceutical Preparation [4]
In the development of Assay method for Lidocaine Ointment USP 5% 2 trials out of 3 were performed and the 3rd trial was finalized. First trial was failed due to to low sample concentration and the peak was failed to elute within the set run time of 20minutes..The second trial was failed to meet the system suitability parameters after the change in the concentration of reference and test solution. The third trial was passed with system suitability parameters and it was finalized for the assay method.
In the proposed work, Analytical Method development for Lidocaine ointment has been developed by chromatographic methods and to validate the proposed method with ICH and Pharmacopoeial guidelines for the intended analytical application.
The following methods have been reported for the estimation of lidocaine.
*Analytical methods development and validation of lidocaine in ointment formulation by *spectrometric method,.
*Stability indicating UPLC method for the determination of lidocaine and its degradation impurities.
*HPLC-DA stability indicating determination of Lidocaine hydrochloride and nitrofurazone in their combined topical dosage form.
*HPLC-MS/MS method for the simultaeneous determination of Nifidipine and Lidocaine in human plasma
*Development and validation of HPLC method for the simultaeneous determination of Lidocaine in topical formulation.
Review of Literature
The following methods have been reported for the estimation of Lidocaine
OBJECTIVE
In the proposed work attempts have been made
MATERIALS AND METHODS
Formulation Details
| SR.No | Ingredients | %w/w |
|---|---|---|
| 1 | Lidocaine USP | 5 |
| 2 | Polyethylene Glycol | 38 |
| 3 | Polyethylene Glycol | 57 |
APPARATUS AND SOFTWARE
HPLC (Agilent) computer loaded Chromeleon 6.8 software was used for all the HPLC measurements. The column was a Xterra RP C18, 150 x 4.6 x 5 μm was used. Volumetric flask with Class A, glass beakers, Measuring cylinders of Class A grade were used.Pippets of Class A grade (both bulb and graduated)were used. Balance with sensitivity of 0.01mg was used.
REAGENTS AND CHEMICALS
Lidocaine Ointment formulation was provided a from formulation department of STRIDES ACROLAB PVT.limited.
HPLC grade Acetonitrile from Spectrochem and Potassium di hydrogen, potassium Dihydrogen phosphate AR grade was purchased from Merck and HCL AR grade was purchased from SDFCL Respectively. Water used throughout the experiment was Purified HPLC grade water.
STANDARD
Lidocaine Hydrochloride (B.No/WS No-400) with a potency of 93.8% was used
SAMPLE
Lidocaine Ointment USP5% with Batch No (2004124-001) was used.
*All the materials used were within the expiry date and were stored at recommended storage condition.
STANDARD PREPARATION
PREPARATION OF LIDOCAINE HYDROCHLORIDE STANDARD SOLUTION
40.09 mg of Lidocaine reference standard were accurately weighed on weighing balance. The weighed quantity was transferred to 100ml volumetric flask.1ml of 0.1M HCL was added and sonicated for 5mins to ensure complete solubilization and diluted to volume with mobile phase .
PREPARATION OF SAMPLE SOLUTION:
800 mg of sample was accurately weighed and was transferred to 100ml volumetric flask.1ml of 0.1M HCL was added and sonicated for 5mins to ensure complete solubilization.
PREPARATION OF PLACEBO
800 mg of placebo was accurately weighed and was transferred to 100ml volumetric flask.1ml of 0.1M HCL was added and sonicated for 5mins
PREPARATION OF MOBILE PHASE:
Acetonitrile HPLC (70%) & Water (30%) were mixed and sonicated for 5 minutes.
BUFFER PREPARATION
9.703gm of Potassium Dihydrogen Orthophosphate was dissolved in 2000ml of water, adjusted the pH to 8 with 40%w/v of sodium Hydroxide solution. The solution was filtered through to 0.45 µm membrane filter & degassed for 5minutes.
Diluent Preparation:
Mobile phase was used as diluent.
OPTIMIZED METHOD
Optimized method for the Assay of Lidocaine by HPLC was finally achieved by using the following chromatographic condition
Table 1: Optimized Method
| Chromatographic Condition | |
|---|---|
| Mobile Phase | 70:30 Buffer : water, the mobile phase sonicated for 5minutes |
| Column | X Terra RPC18, 150 x 4.6 mm |
| Flow Rate | 1.0 ml/min |
| Wavelength | 230 nm |
| Injection volume | 20 µl |
| Run time | 30min |
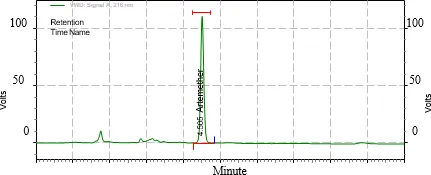
Figure 2: Chromatogram for Optimized Method
RESULTS AND DISCUSSION
1. System suitability
Standard solution of Lidocaine was injected three times into HPLC system as per test procedure. The system suitability parameters were evaluated from standard chromatograms obtained by calculating the %RSD of retention times, tailing factor, theoretical plates and peak areas from three replicate injections.
Table 2: System Suitability Parameter of Lidocaine
| Retention Time | Mean Peak area | |
|---|---|---|
| 1 | 4.874 | 4081652.637 |
| 2 | 4.875 | 4081798.438 |
| 3 | 4.874 | 4084310.151 |
| 4 | 4.877 | 4084824.975 |
| 5 | 4.877 | 4086987.932 |
| Mean | 4.876 | 4083914.827 |
| SD | 0.0022 | |
| %RSD | 0.1 | 1.93 |
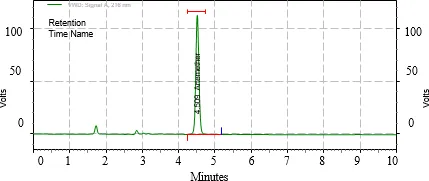
Figure 3: Chromatogram for System Suitability
2. Specificity by forced degradation studies
Specificity is the ability to assess unequivocally the analytes in the presence of components which may be expected to be present. Forced degradation of lidocaine ointment shall be carried out to confirm that during stability study or through out thr shelf life,any degradation product if found should not interfere with the main peak of lidocaine. The forced degradation pathway helps to identify the type of degradation pathway (oxidative, alkali hydrolysis, acid hydrolysis,water hydrolysis)for each of the degrades.
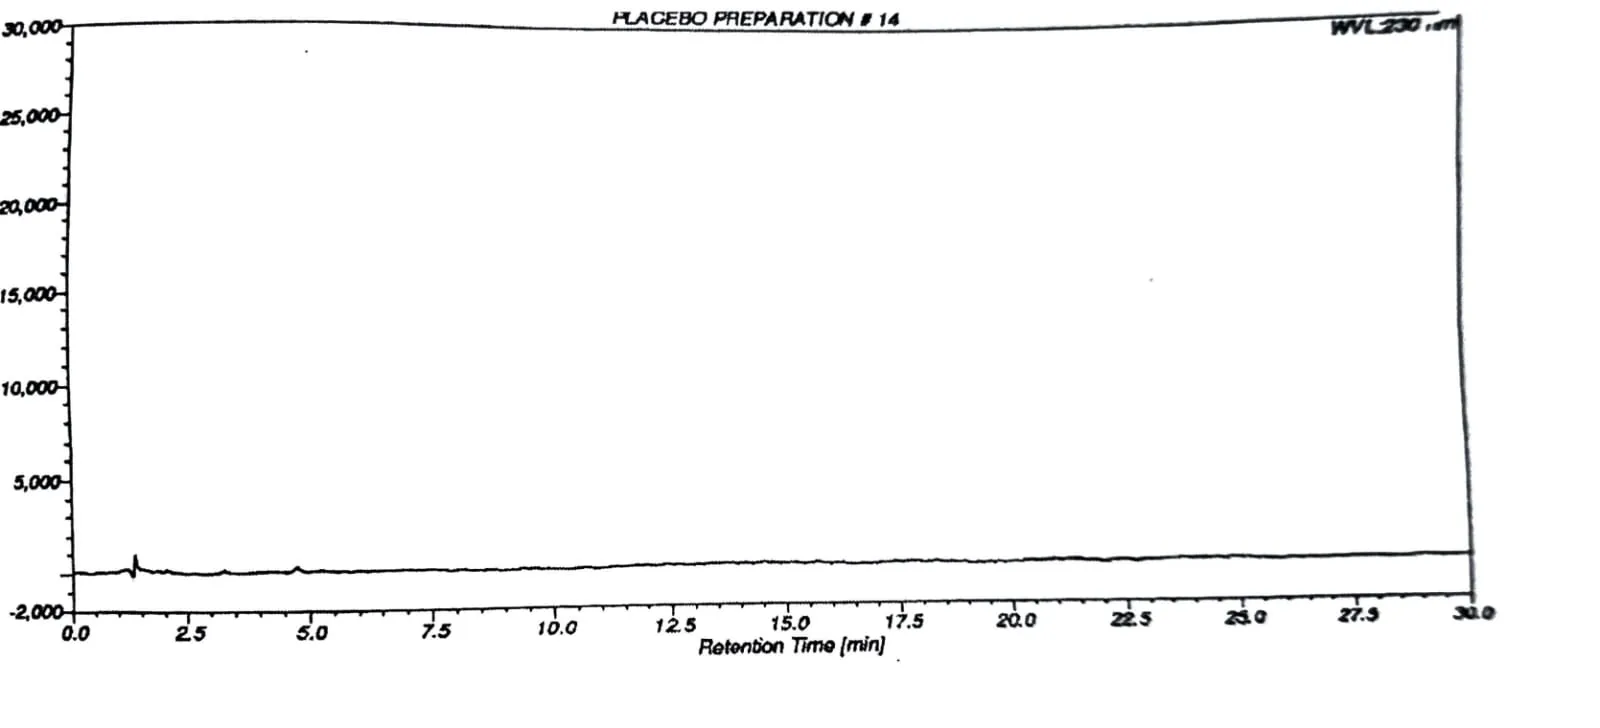
Figure 4: Chromatogram for Placebo
Figure 4: Chromatogram for Acid Stressed Sample
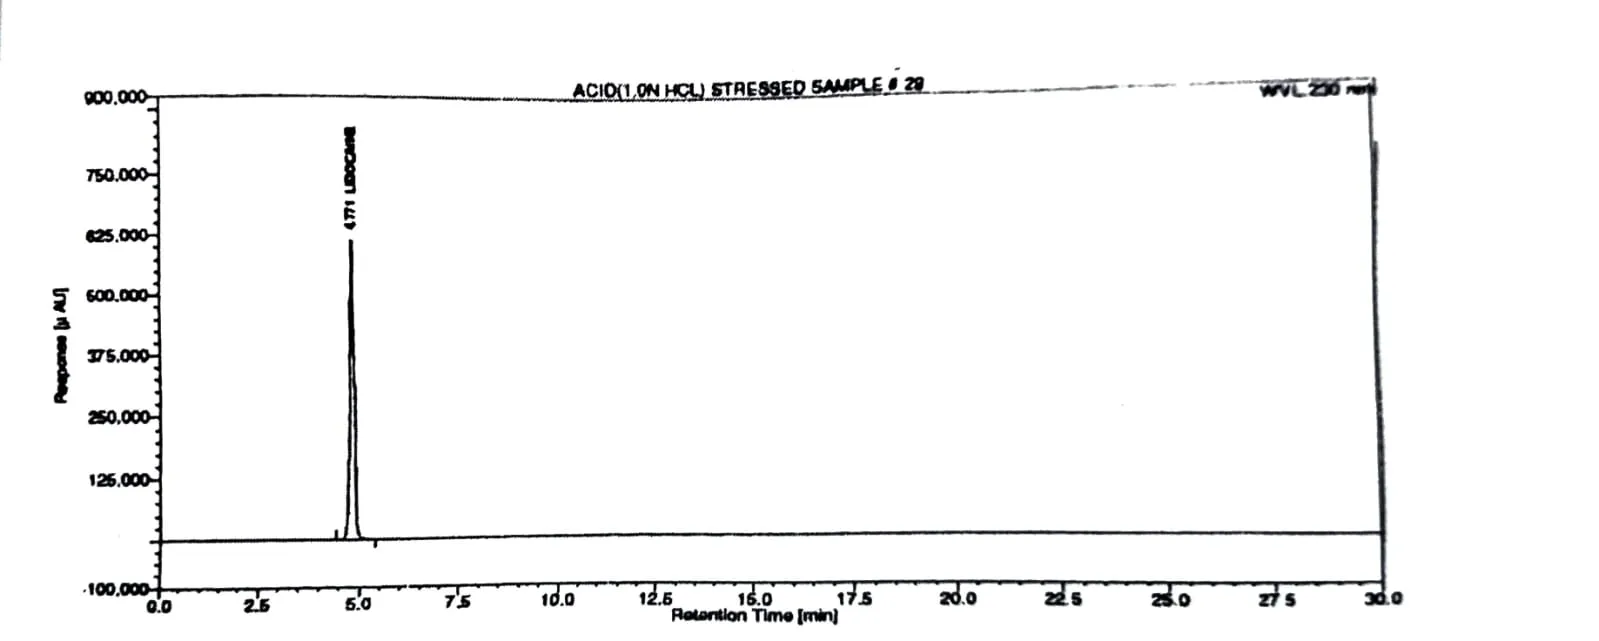
Figure 5: Chromatogram for Alkali Stressed
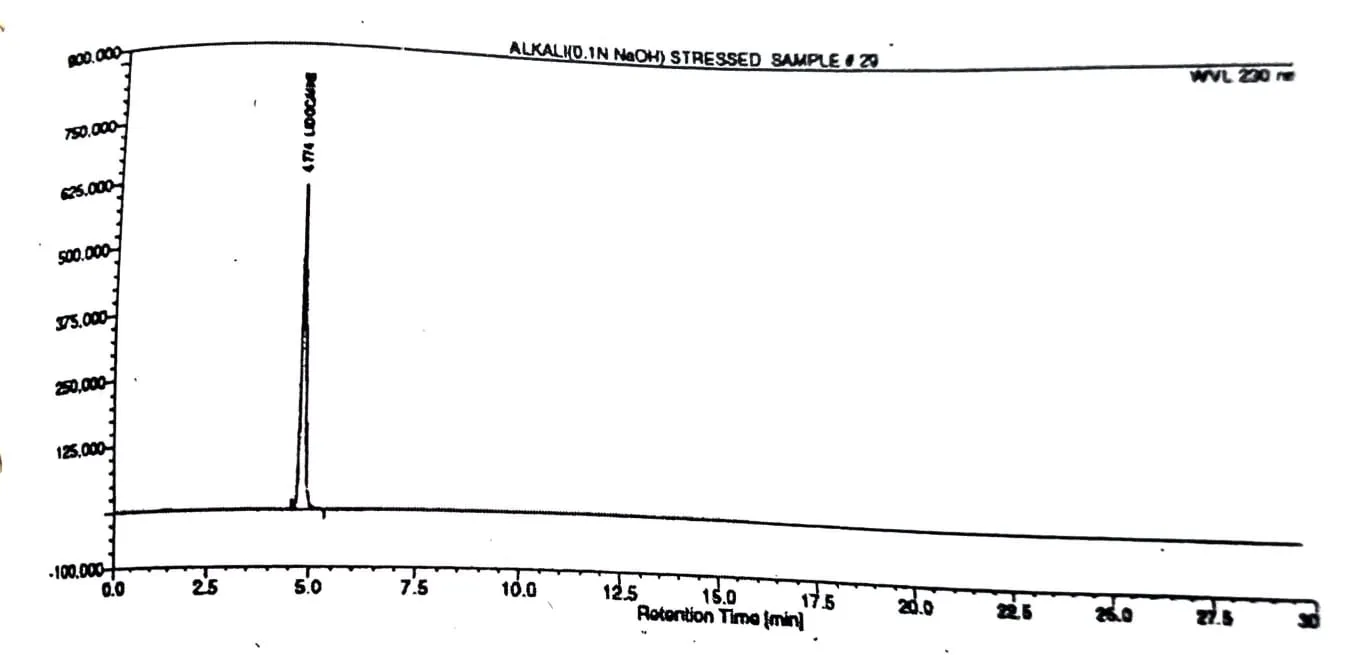
Table 3: Forced Degradation Studies
| Stressed condition | Lidocaine | Assay in % | |
|---|---|---|---|
| Peak purity | Purity match | ||
| Sample as such | 1000 | 990 | 97.6 |
| N HCL | 1000 | 990 | 95.9 |
| 1.0HCL | 1000 | 990 | 95.9 |
| 0.1N NaoH | 1000 | 990 | 96.1 |
| 1.0N NaoH | 1000 | 990 | 96.2 |
| 0.3%Hydrogen Peroxide | 1000 | 990 | 83.9 |
| Neutral | 1000 | 990 | 96.6 |
| Sunlight | 1000 | 990 | 95.8 |
| thermal | 1000 | 990 | 95.8 |
3. Precision
The precision of an analytical procedure expresses the closeness of agreement (degree of scatter) between a series of measurement obtained from multiple sampling of the same homogeneous sample under the prescribed conditions
System precision
The system precision is checked by using standard chemical substance to ensure that the analytical system is working properly. The retention time and area response of six determinations should be measured and calculated the relative standard deviation.
Table 4: System Precision
| Injection | Retention Time | Mean Peak area |
|---|---|---|
| 1 | 4.874 | 4081652.637 |
| 2 | 4.875 | 4081798.438 |
| 3 | 4.874 | 4084310.151 |
| 4 | 4.877 | 4084824.975 |
| 5 | 4.877 | 4086987.932 |
| 6 | 4.878 | 4084857.353 |
| Mean | 4.876 | 4084071.914 |
| %RSD | 0.0% | 0.0% |
4. Method Precision
In method precision a homogeneous sample of single batch should be analysed six times.This indicates a method is giving consistent results of single batch.
Table 5: Method Precision
| Set | Assay in % |
|---|---|
| 1 | 97.8 |
| 2 | 97.9 |
| 3 | 97.2 |
| 4 | 97.9 |
| 5 | 97.0 |
| 6 | 98.6 |
| Mean | 97.7 |
| %RSD | 0.0% |
5. Intermediate Precision
The intermediate precision should be carried out to ensure that the analytical results will remain unaffected with the change in instrument ,analyst,column and day.
Table 6: Intermediate Precision
| Set | Assay in % |
|---|---|
| 1 | 96.2 |
| 2 | 96.5 |
| 3 | 95.7 |
| 4 | 97.6 |
| 5 | 97.8 |
| 6 | 97.9 |
| Mean | 96.8 |
| %RSD | 1.1% |
6. Stability in Analytical Solution
Evaluated the stability in analytical solution by injecting the standard preparation and sample preparation at regular interval.
standard solution at room temperature
Table 7: Stability in Analytical Solution
| Lidocaine standard preparation | ||
|---|---|---|
| Time (Hrs) | Area | %Difference |
| Initial | 4081652.637 | -- |
| 8hrs | 4092162.271 | 0.3 |
| 9hrs | 4096913.382 | 0.4 |
| 12hrs | 4103463.055 | 0.5 |
| 13hrs | 4103612.506 | 0.5 |
| 19hrs | 4100645.846 | 0.5 |
| 22hrs | 4106576.726 | 0.6 |
| 26hrs | 4111607.756 | 0.7 |
| 28hrs | 4060600.688 | -0.5 |
| 29hrs | 4063228.011 | -0.5 |
| 31hrs | 4078570.074 | -0.1 |
| 32hrs | 4071826.861 | -0.2 |
| 33hrs | 4075413.206 | -0.2 |
| 34hrs | 4083076.019 | 0. |
| 35hrs | 4075508.154 | -0.2 |
| 36hrs | 4068000.828 | -0.3 |
| 37hrs | 4071620.425 | -0.2 |
7. Mobile phase hold time study
Evalauted the stability of mobile phase by injecting the standard standard solution in
conjuctive (like day1,day2)days and checked the system suitability parameters.
Table 8: Mobile Phase Hold Time Study
| Sr.No | Days | %RSD lidocaine peak from standard solution should not be more than 2.0 | Tailing factor for lidocaine peak from standard solution should not be more than 2.0 | Theoretical plates for lidocaine peak from standard solution should not be lesscthan 2000 |
|---|---|---|---|---|
| 1 | Day-1 | 0.1% | 1.18 | 8828 |
| 2 | Day-2 | 0.1% | 1.21 | 8828 |
| 3 | Day-3 | 0.1% | 1.19 | 8809 |
8. Linearity and range
Six different concentration ranging 50% to 150% of lidocaine labelled claim for linearity standard solution ranging 203µg/ml to 596µg/ml. The calibration curve obtained by plotting peak area against concentration and injected under optimized chromatographic condition.
Table 9: Concentration and Peak Area of Linearity Study
| Sr. No. |
Description | Concentration in µg/ml |
Area response | |
|---|---|---|---|---|
| 1. | Linearity 50% | 203.6534 | 2209736.995 | |
| 2. | Linearity 80% | 323.4496 | 3441818.610 | |
| 3. | Linearity 90% | 403.317 | 4239278.265 | |
| Linearity 100% | 443.2457 | 4649363.387 | ||
| 4. | Linearity 110% | 443.2457 | 4649363.387 | |
| 5. | Linearity 120% | 477.1880 | 5028432.442 | |
| 6. | Linearity 150% | 596.9841 | 6278506.854 | |
| Regression Equation | y=10353.055x+76115.262 | |||
| Correlation Coefficient(R²) | R²=1.000 | |||
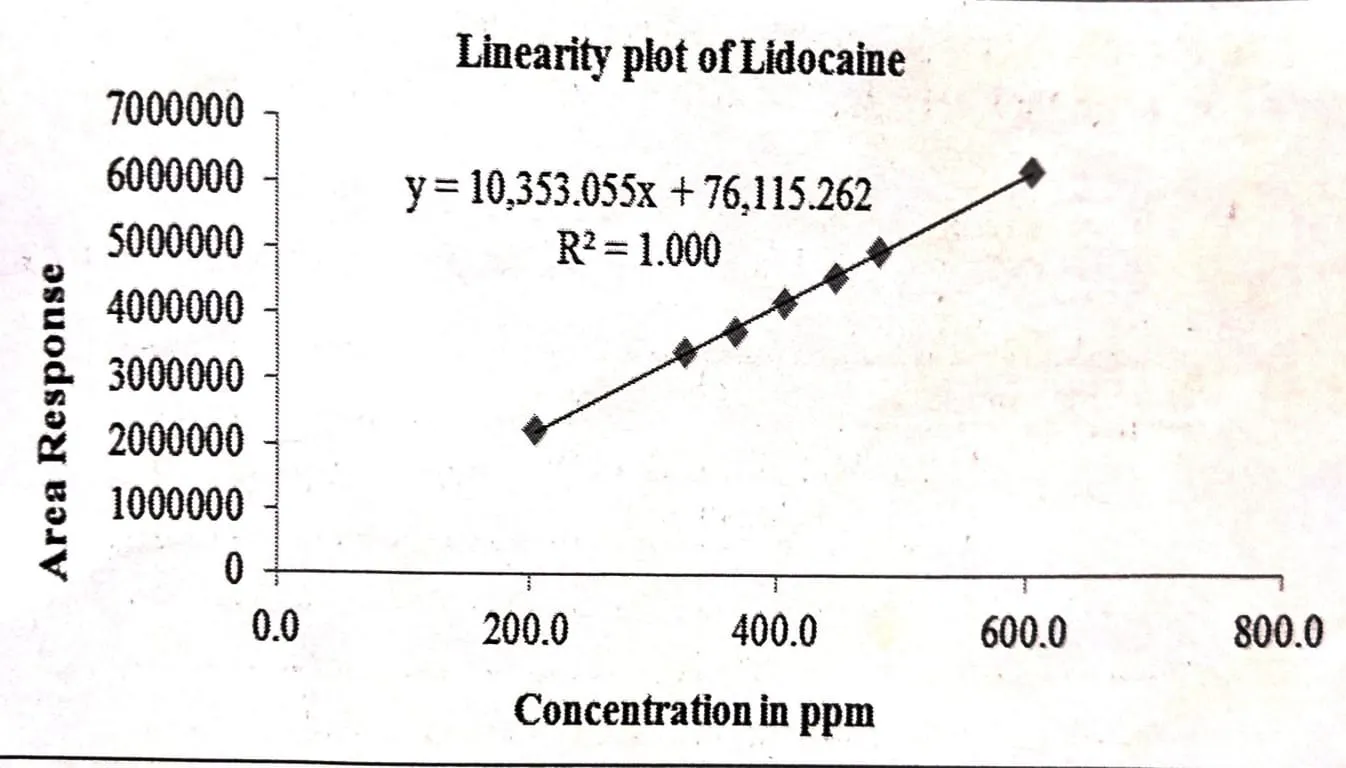
Figure 6: Linearity
9. RANGE
The range of analytical method is the interval between the upper and lower level if analyte that has been demonstrated to be determined with suitable accuracy and linearity
Table 10: Range Studies
| Lidocaine | ||
|---|---|---|
| Level | Mean Area of linearity | Mean area of accuracy |
| Linearity 50% | 2209736.995 | 2116407.746 |
| Linearity 100% | 4239278.265 | 4172029.322 |
| Linearity 150% | 6278506.854 | 6026720.931 |
| Correlation Coefficient(R²) | 1.000 | 1.000 |
| RSD for accuracy | 1.3% | |
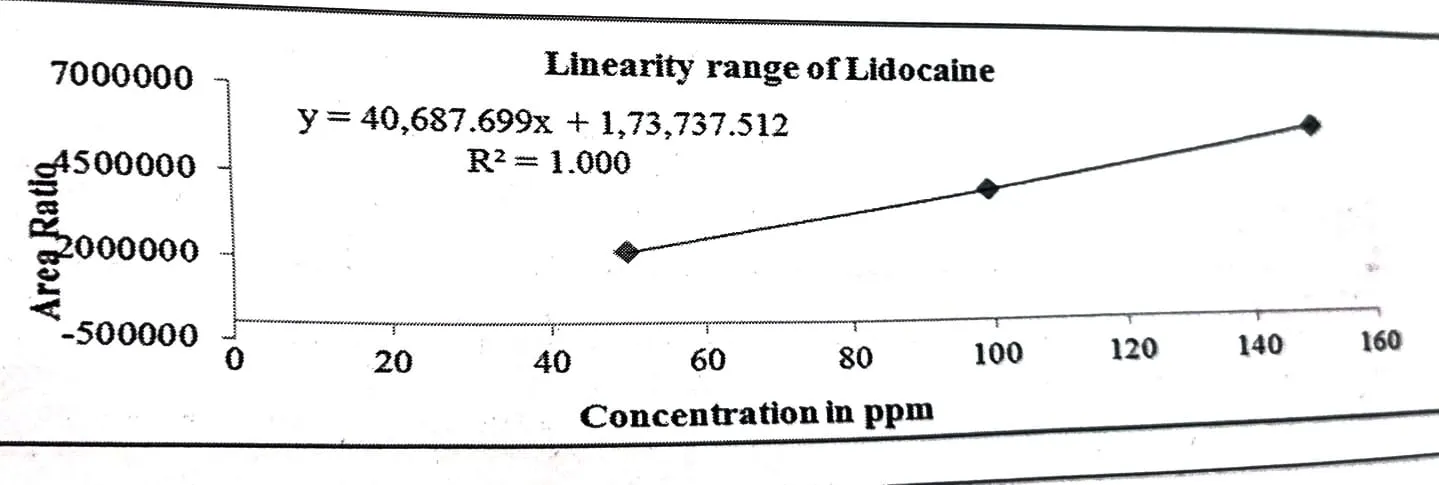
Figure 7: Range Study
10. Accuracy
The accuracy of an analytical procedure expresses the closeness of agreement between the value which is accepted as either accepted value or an accepted reference value .This is sometimes termed trueness.
Table 10: Range Studies
| Sr.No | Levels | Area Response |
*mg addedActual) | *mg recovered | %Recovery | Mean% | %RSD |
|---|---|---|---|---|---|---|---|
| 1 | 50% | 2116491.551 | 20.56 | 20.4637 | 101.4 | 100.9% | 0.6% |
| 2 | 2115663.966 | 20.78 | 20.4557 | 100.2 | |||
| 3 | 2117067.721 | 20.62 | 20.4693 | 101.1 | |||
| 1 | !00% | 4171173.909 | 40.87 | 40.3299 | 100.5 | 100.7% | 0.3% |
| 2 | 4174996.625 | 40.69 | 40.3668 | 101.0 | |||
| 3 | 4169917.432 | 40.82 | 40.3177 | 100.6 | |||
| 1 | 150% | 6021804.494 | 60.38 | 58.2231 | 98.2 | 98.4% | 0.2% |
| 2 | 6022821.071 | 60.18 | 58.2329 | 98.5 | |||
| 3 | 6035537.228 | 60.32 | 58.3558 | 98.5 |
Figure 9: Accuracy Study
11. Robustness
Robustness studies were carried out using slight modifications in chromatographic such as:
1) Change in column temperature ±5ºC
2) Change in flow rate ±0.2mL/min
3) Change in pH±0.2 unit
4) Change in organic phase±5%
Table 11: Robustness Studies
| Sr.No | %RSD lidocaine peak from standard should not be more than 2 | The tailing factor for lidocaine peak from standard should not be more than 2 | The theoretical plates for lidocaine peak from standard should not be less than 2000 |
|---|---|---|---|
| 1 | 0.0% | 1.18 | 8828 |
| 2 | 0.1% | 1.17 | 8501 |
| 3 | 0.1% | 1.21 | 9093 |
| 4 | 0.0% | 1.18 | 9701 |
| 5 | 0.0% | 1.19 | 8109 |
| 6 | 0.1% | 1.15 | 8109 |
| 7 | 0.0% | 1.14 | 9480 |
| 8 | 0.1% | 1.21 | 9356 |
| 9 | 0.1% | 1.18 | 8914 |
REFERENCES

M. S. Supritha, M. S. Sahana, RP-HPLC Assay Method Development and Validation for Lidocaine Ointment 5% USP, Int. J. of Pharm. Sci., 2026, Vol 4, Issue 10, 3769-3777. https://doi.org/10.5281/zenodo.23640803
 10.5281/zenodo.23640803