
We use cookies to ensure our website works properly and to personalise your experience. Cookies policy
Rajarambapu College of Pharmacy, Kasegaon Dist- Sangli, Maharashtra, India-415 404
The aim of this research was to develop and validate a stability-indicating Reverse Phase High Performance Liquid Chromatography (RP-HPLC) method for the estimation of Andiabetic drug in bulk and tablet dosage forms. Chromatographic separation was achieved using a C18 column (250 mm × 4.6 mm, 5 ?m particle size) with a mobile phase consisting of Propylene glycol: Water (pH 4.5) (pH adjusted with Orthophosphoric acid): Methanol in the ratio of 50:40:10. The flow rate was maintained at 1.0 mL/min, and detection was carried out at 215 nm using a UV detector. The retention time of drug was found to be 5.793 for Gliclazide (GLZ). The method was validated according to ICH guidelines for linearity, accuracy, precision, specificity, limit of detection (LOD), limit of quantification (LOQ), and robustness. Linearity was observed in the concentration range of 10-50 ?g/mL for GLZ, with correlation coefficients (r²) of 0.9993. The method demonstrated good accuracy, with recovery rates found in the range of 99.80% to 100.86 % for GLZ. Precision, both intra-day and inter-day, showed relative standard deviation (RSD) values of less than 2%. The stability study involves the good results in all stability conditions. The marketed formulation of gliclazide was analysis using UV and RP-HPLC the percent assay by both method was found to be 98.23% and 98.68% respectively. The developed RP-HPLC method is reliable, efficient, and suitable for the estimation of Gliclazide in in bulk and tablet dosage forms. It can be successfully applied for routine quality control and stability testing of these agents.
In the ever-evolving field of pharmaceutical sciences, the development of reliable and efficient analytical methods plays a pivotal role in ensuring the quality, safety, and efficacy of pharmaceutical products. Analytical techniques are fundamental in every stage of drug development-from initial formulation and stability testing to routine quality control of final products.1-5 Among the various tools available, Ultraviolet-Visible (UV-Vis) spectrophotometry and High-Performance Liquid Chromatography (HPLC) are two of the most widely employed analytical techniques in pharmaceutical analysis due to their versatility, sensitivity, and precision. The current research focuses on the development and validation of UV and Reverse Phase-High Performance Liquid Chromatography (RP-HPLC) methods for the estimation of Gliclazide, a widely prescribed oral hypoglycemic agent, in its tablet dosage form.6-8 Gliclazide is a second-generation sulfonylurea that is commonly used for the treatment of Type 2 Diabetes Mellitus (T2DM). It functions primarily by stimulating the insulin secretion from pancreatic beta cells and improving peripheral insulin sensitivity. Its unique antioxidant properties and ability to reduce microvascular complications make it a preferable choice among sulfonylureas. Since the drug is administered in chronic conditions and requires long-term patient compliance, maintaining strict quality standards for its dosage forms is essential. Therefore, the need for validated analytical methods for its quantification in pharmaceutical formulations is both regulatory and therapeutic in nature.9-12

Figure 1: Structure of Gliclazide
While UV spectrophotometry is advantageous due to its simplicity, cost-effectiveness, and ease of operation, it may lack specificity in complex pharmaceutical matrices where multiple excipients or degradation products can interfere. On the other hand, RP-HPLC offers a more selective and reproducible platform, capable of resolving Gliclazide from related substances with high precision and accuracy. RP-HPLC is particularly effective for stability-indicating assays and quantitative determinations in both bulk drug and finished dosage forms. The synergistic use of UV and RP-HPLC methods provides comprehensive insight into the quality profile of the drug product and aids in cross-verification of analytical results. The core objective of this research is to develop precise, robust, and validated UV and RP-HPLC methods for the determination of Gliclazide in tablet dosage forms, following International Council for Harmonisation (ICH) guidelines (Q2(R1)). The validation parameters include specificity, linearity, range, accuracy, precision (repeatability and intermediate precision), robustness, limit of detection (LOD), and limit of quantification (LOQ). The implementation of these validation parameters ensures that the developed methods are scientifically sound and suitable for their intended analytical purposes, particularly in routine quality control and regulatory submissions.13-15 Furthermore, the significance of this study lies in its contribution to establishing a dependable analytical framework that can be easily adopted by quality control laboratories in the pharmaceutical industry. By offering both a simple UV spectrophotometric method and a highly sensitive RP-HPLC method, this research not only broadens the analytical options for Gliclazide but also enhances regulatory compliance and product consistency. Ultimately, these validated methods will support the pharmaceutical sector in delivering high-quality, safe, and effective antidiabetic medications to the patient population.
MATERIALS AND METHODS:
MATERIALS:
Gliclazide, the active pharmaceutical ingredient used in this study, was procured from Dhamtech Pharma and Consultant, Navi Mumbai. Analytical and HPLC-grade reagents were used throughout the analysis. Milli-Q water served as the solvent for all preparations. Potassium dihydrogen phosphate and ortho phosphoric acid (EP grade) were obtained from Dipa Chemical Industry for buffer preparation. HPLC-grade methanol and acetonitrile, sourced from Advent, were used as organic solvents in the mobile phase. All materials were selected to ensure compatibility with UV and RP-HPLC analysis for accurate and reproducible results.
Characterization of Gliclazide
Organoleptic and Physical Properties
The organoleptic properties of Gliclazide, including its color, odor, and texture, were assessed visually against a white background and in a neutral environment. The melting point was determined using a digital melting point apparatus, confirming drug purity by comparing with standard values. Solubility studies were performed using solvents such as water, propylene glycol, methanol, ethanol, and acetonitrile to determine suitable solubilizing agents for further analytical studies.16-18
FTIR and DSC Analysis
FTIR spectroscopy (Jasco FTIR 4600, Japan) was employed to identify functional groups and ensure drug purity. Samples were analyzed in the range of 4000–400 cm?¹ using KBr pellets. DSC analysis was performed on 3–5 mg of pure drug using a calibrated MDSC 2920 calorimeter. The samples were scanned between 0–300°C under a helium atmosphere to assess thermal behavior and purity.
UV Spectrophotometric Method Development19-22
Determination of λmax
Gliclazide standard solutions were scanned between 200–400 nm using a UV-Visible spectrophotometer (Lasany, Model LI-2702). The wavelength of maximum absorbance (λmax) was identified for further analysis.
Calibration Curve and Solvent Selection
Various solvents were tested, and Propylene Glycol: Methanol (10:90) was selected for its good solubility and stability. A standard stock solution (1000 µg/ml) was prepared, and working standards ranging from 5–25 µg/ml were used to plot the calibration curve. Absorbance values at λmax were used to evaluate linearity and construct the Beer-Lambert plot.
Method Validation23-27
Linearity and Accuracy
Linearity was established over a concentration range of 5–25 µg/ml, with five calibration points. Accuracy was assessed by recovery studies at 80%, 100%, and 120% levels, and recovery percentages were calculated to confirm method reliability.
Precision, Robustness, and Ruggedness
Intra-day and inter-day precision studies were conducted at three concentration levels (5, 15, and 25 µg/ml), and %RSD was calculated. Robustness was evaluated by analyzing the drug in different solvent systems, while ruggedness was assessed at varying temperatures (25°C, 37°C, and 60°C).
LOD and LOQ
The limit of detection (LOD) and limit of quantification (LOQ) were calculated using the standard deviation of the y-intercept (σ) and the slope (S) of the calibration curve, using the formulas:
LOD = 3.3 × σ/S
LOQ = 10 × σ/S
Analysis of Marketed Formulation28-30
The marketed Gliclazide tablet (Glycinorm 40 mg, Ipca Laboratories Ltd.) was analyzed using the developed UV method. Tablets were powdered and dissolved in the selected solvent system, sonicated, filtered, and diluted to obtain a 20 µg/ml solution. The absorbance of this sample was compared to that of the standard, and the assay was calculated to determine the drug content.
RP-HPLC Analysis of Gliclazide: Instrumentation31-33
RP-HPLC analysis was conducted using a Shimadzu LC 2010 system equipped with a 20 μL auto-injector and a UV/VIS detector (LC-UV-2075), controlled by LC solution software. Chromatographic separation was performed on an Intersil ODS-3V C18 column (250 × 4.6 mm, 5 μm). Additional equipment included an Elder digital balance and Prama ultrasonicator.
Method Development and Chromatographic Conditions34-38
Several mobile phase compositions were evaluated to optimize chromatographic performance based on the physicochemical properties of Gliclazide. The final optimized mobile phase consisted of Propylene Glycol:Water (pH 4.5):Methanol (50:40:10 v/v/v), adjusted with orthophosphoric acid. The mobile phase was filtered through a 0.45 µm membrane and degassed prior to use. Chromatographic separation was achieved under isocratic conditions at a flow rate of 1 mL/min, with UV detection at 215 nm.
Sample Preparation and System Setup
A standard stock solution of Gliclazide (100 µg/mL) was prepared in mobile phase and diluted appropriately. Samples were filtered through a 0.2 µm nylon membrane before injection. The system was primed and the column was conditioned using sequential washes with water, methanol-water (50:50), and acetonitrile. Baseline stabilization was ensured before analysis, and prepared samples were loaded into autosampler vials for injection.
Method Validation39-42
System Suitability and Specificity
System suitability was confirmed by injecting five replicates of a 10 µg/mL standard solution. Parameters such as retention time, peak area, theoretical plates, and tailing factor were within ICH-specified limits. Specificity was established by confirming the absence of interfering peaks at the retention time of Gliclazide.
Precision and Accuracy
System, method, intraday, and interday precision were evaluated at three concentrations (10, 20, and 30 µg/mL). %RSD values confirmed reproducibility. Accuracy was assessed via recovery studies at 80%, 100%, and 120% levels, with results falling within acceptable recovery limits.
Linearity and Range
Linearity was observed over a concentration range of 10–50 µg/mL, with regression analysis confirming a strong correlation between peak area and concentration. This validated the method’s suitability for quantitative analysis.
LOD, LOQ, and Stability
The LOD and LOQ were calculated using standard formulas based on the calibration curve (LOD = 3.3 × σ/S; LOQ = 10 × σ/S). Stability of analytical solutions was confirmed by analyzing standard solutions stored at ambient and refrigerated conditions over 24 hours, showing no significant degradation.
Robustness and Ruggedness
Robustness was evaluated by varying flow rates and observing system performance, while ruggedness was tested by analyzing samples at different temperatures (25°C, 37°C, and 60°C). In both cases, %RSD values confirmed the method's resilience under minor operational changes.
Analysis of Marketed Formulation by RP-HPLC43-44
The developed RP-HPLC method was applied to estimate Gliclazide content in a marketed formulation (Glycinorm-40, Ipca Laboratories). Tablet powder equivalent to 40 mg of Gliclazide was dissolved in mobile phase, sonicated, filtered, and diluted to obtain a 40 µg/mL test solution. The sample was analyzed, and the percent assay was calculated by comparing peak areas with the standard, confirming content uniformity and method applicability.
RESULTS AND DISCUSSION:
Preformulation Studies
Organoleptic and Physical Properties:
Gliclazide was identified as a white or almost white crystalline powder with a slight characteristic odor and a mildly bitter taste. It was found soluble in methanol, ethanol, and propylene glycol. The melting point was observed at 169.65°C, consistent with standard values (165–170°C).
FTIR Spectroscopy:
FTIR analysis confirmed the presence of functional groups such as N–H, C=O, SO?, and C–N, indicating the structural integrity of Gliclazide. No unusual peaks suggested compatibility with excipients.
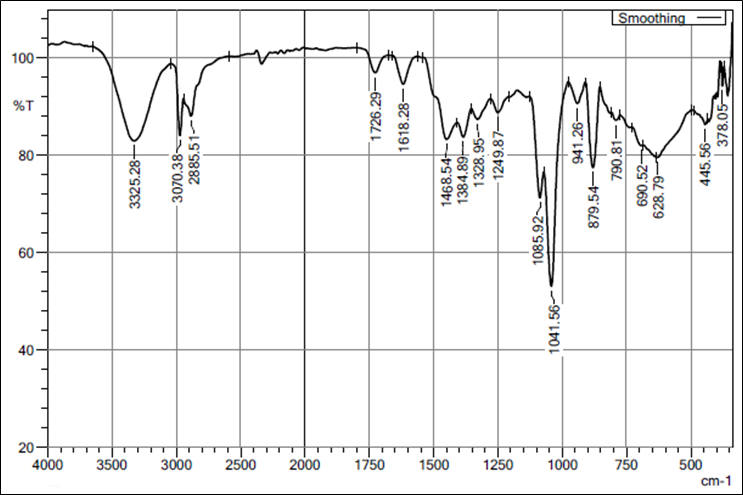
Figure 2: FTIR spectrum of Gliclazide
DSC Study:
The DSC thermogram of Gliclazide showed a sharp endothermic peak at 169.65°C, confirming its crystalline nature and thermal stability with no prior decomposition.
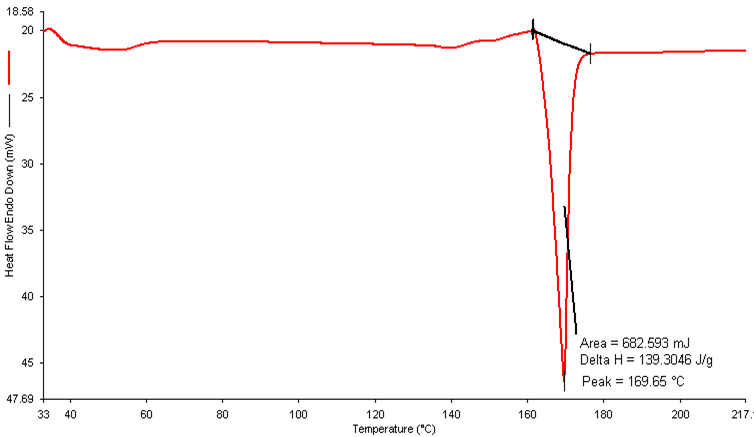
Figure 3: DSC Thermogram of Gliclazide
UV Spectrophotometric Analysis
Determination of λmax:
UV analysis showed that Gliclazide had maximum absorbance at 215 nm in PG: Methanol (10:90), which was used for further method development.
Calibration Curve:
A linear calibration curve was obtained over the range of 5–15 µg/mL with a regression equation of y = 0.0494x – 0.0213 and an R² value of 0.9991, confirming excellent linearity.
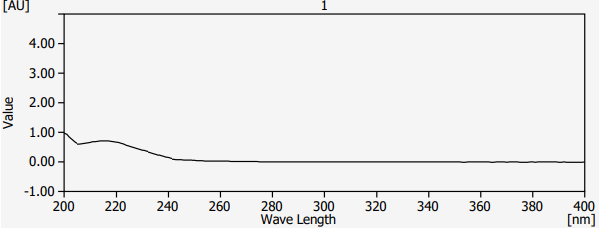
Figure 4: Maximum wavelength detection of Gliclazide
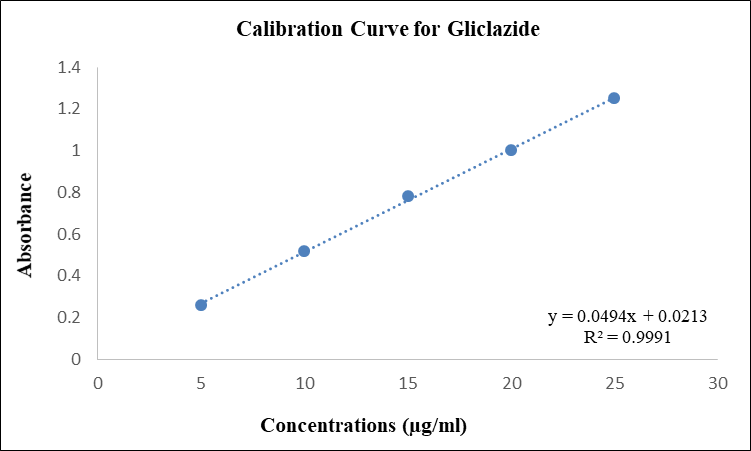
Figure 5: Standard Curve for Gliclazide
Method Validation (UV Method)
Linearity and Accuracy:
The method showed linearity in the 5–15 µg/mL range. Accuracy was validated through recovery studies at 80%, 100%, and 120% levels, with recoveries close to 100%, confirming method reliability.
Precision, Robustness, and Ruggedness:
Intra- and inter-day precision studies showed %RSD values below 2%. The method also proved robust and rugged under slight variations in analytical conditions.
Table 1: Evaluation data for Intra-day and Inter-day study of Gliclazide
|
Intra-day |
Morning |
Afternoon |
Evening |
||||||
|
Concentration Range (µg/ml) |
Mean |
% Assay |
% RSD |
Mean |
% Assay |
% RSD |
Mean |
% Assay |
% RSD |
|
5 |
0.258 |
99.742 |
0.804 |
0.256 |
101.04 |
0.981 |
0.250 |
101.465 |
1.284 |
|
15 |
0.781 |
100.213 |
0.195 |
0.775 |
101.29 |
1.909 |
0.782 |
99.872 |
0.461 |
|
25 |
1.252 |
99.973 |
0.121 |
1.251 |
99.973 |
0.122 |
1.251 |
100.213 |
0.201 |
|
Inter-day |
Day 1 |
Day 2 |
Day 3 |
||||||
|
Concentration Range (µg/ml) |
Mean |
% Assay |
% RSD |
Mean |
% Assay |
% RSD |
Mean |
% Assay |
% RSD |
|
5 |
0.257 |
98.832 |
1.029 |
0.258 |
101.419 |
1.564 |
0.253 |
100.395 |
1.425 |
|
15 |
0.785 |
99.872 |
0.127 |
0.784 |
100.340 |
0.482 |
0.785 |
100.00 |
0.382 |
|
25 |
1.252 |
100.514 |
0.092 |
1.232 |
101.920 |
1.702 |
1.247 |
100.749 |
0.970 |
LOD and LOQ:
The method demonstrated high sensitivity with LOD and LOQ values in the sub-microgram range, suitable for low-level detection and quantification of Gliclazide.
Table 22: Evaluation data for LOD. & LOQ of Gliclazide
|
Gliclazide |
|
|
LOD |
0.211 µg/ml |
|
LOQ |
1.389 µg/ml |
Analysis of Marketed Formulation
Gliclazide tablets (Glycinorm-40, Ipca Laboratories Ltd.) were analyzed using the developed UV method. A sample with 20 µg/mL concentrations showed an absorbance of 0.986 compared to the standard’s 1.004, yielding a % assay of 98.23%, confirming the method's applicability for routine quality control.
Table 3: Analysis of marketed formulation
|
|
Standard (20µg/ml) |
Sample (marketed formulation) (20µg/ml) |
|
Absorbance |
1.004 |
0.986 |
|
% assay |
100 |
98.23 |
RP-HPLC Method Development and Validation
Chromatographic Optimization
The RP-HPLC method for Gliclazide was optimized through multiple trials by adjusting mobile phase composition and chromatographic conditions. The final method employed a C18 column with a mobile phase of Propylene Glycol: Water (pH 4.5): Methanol (50:40:10 v/v/v) at a flow rate of 1 mL/min, with detection at 215 nm. The retention time for Gliclazide was 5.765 min.
Table 4: Various Trials and Optimization of Chromatographic Conditions
|
Trial No |
HPLC System |
Chromatographic Conditions |
Observations |
Remarks |
|
1 |
HPLC (Shimazdu LC 2010 with Uv detector) |
Mobile Phase- Propylene glycol: Methanol (40:60) Column - Inertsil C18 (4.6 x 250mm, 5μm) Flow rate- 1 ml/min Injection Volume- 20µl Pump mode- Isocratic Column temperature- Ambient Wavelength- 215 nm |
Peak is not fully separated. peak shape was not acceptable |
Rejected |
|
2 |
HPLC (Shimazdu LC 2010 with Uv detector) |
Mobile Phase- Propylene glycol: Acetonitrile (40:60) Column - Inertsil C18 (4.6 x 250mm, 5μm) Flow rate- 1 ml/min Injection Volume- 20µl Pump mode- Isocratic Column temperature- Ambient Wavelength- 215 nm |
Peak was not fully separated but peak shape was good as compared to first trial |
Rejected |
|
3 |
HPLC (Shimazdu LC 2010 with Uv detector) |
Mobile Phase- Propylene glycol: Water: Methanol (50:30:20) Column - Inertsil C18 (4.6 x 250 mm, 5μm) Flow rate- 1 ml/min Injection Volume- 20µl Pump mode- Isocratic Column temperature- Ambient Wavelength- 215 nm |
Peaks were separated but the peak shapes was not good |
Rejected |
|
4 |
HPLC (Shimazdu LC 2010 with Uv detector) |
Mobile Phase- Propylene glycol: Water: Methanol (50:40:10) Column - Inertsil C18 (4.6 x 250 mm, 5μm) Flow rate- 1 ml/min Injection Volume- 20µl Pump mode- Isocratic Column temperature- Ambient Wavelength- 215 nm |
Peaks were separated but the first peak shape was not good |
|
|
5 |
HPLC (Shimazdu LC 2010 with Uv detector) |
Mobile Phase- Propylene glycol: Water (pH 4.5) (pH adjusted with Orthophosphoric acid): Methanol (50:40:10) Column - Inertsil C18 (4.6 x 250 mm, 5μm) Flow rate- 1 ml/min Injection Volume- 20µl Pump mode- Isocratic Column temperature- Ambient Wavelength- 215 nm |
Peaks shape were good, with good resolution and intensity at pH 4.5 |
Accepted |
Blank Chromatogram
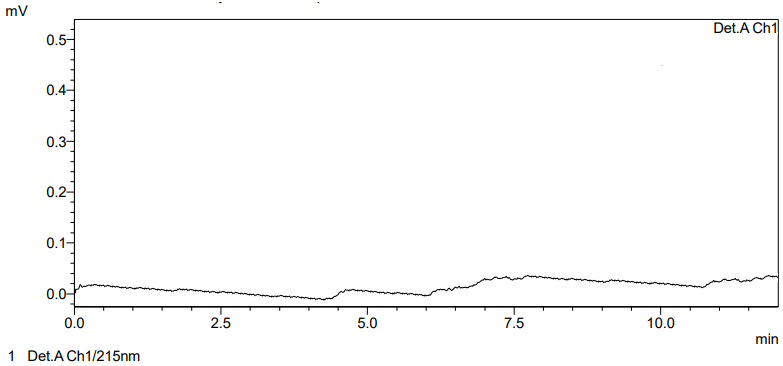
Figure 6: Blank Chromatogram
Optimized trial
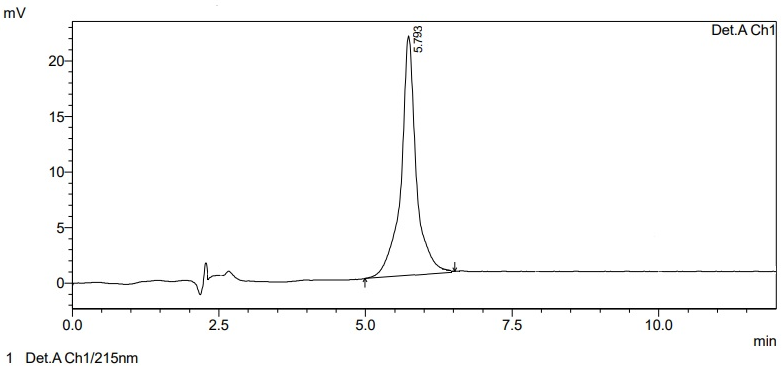
Figure 7: Optimized HPLC Fingerprinting of Gliclazide
Table 5: Evaluation parameter of Optimized Gliclazide trial
|
Sr. No. |
Name |
Retention Time (min) |
Area (μV*sec) |
Height (μV) |
|
1 |
Gliclazide |
5.793 |
391862 |
21486 |
Method Validation
System Suitability:
All system parameters, including retention time, peak area, theoretical plates, and tailing factor, met the acceptance criteria, confirming system adequacy.
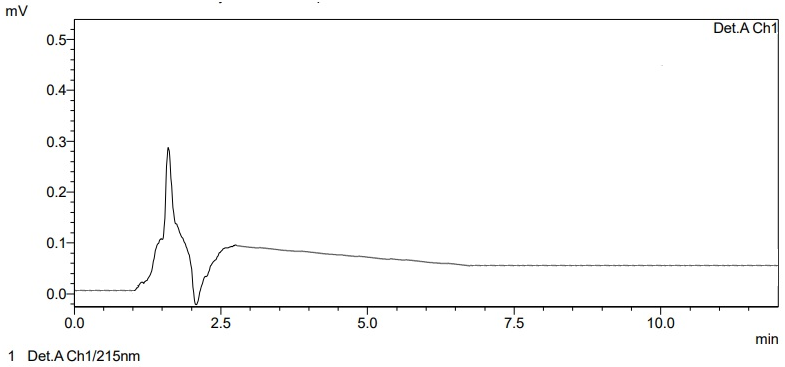
Figure 8: Blank Chromatogram for System Suitability
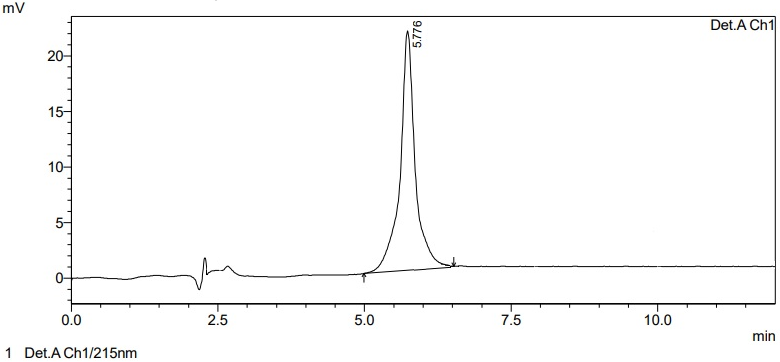
Figure 9: System Suitability Chromatogram of Standard Gliclazide 5
Table 6: System Suitability Parameters of Gliclazide
|
Replicates |
|
Retention time |
Peak area |
Tailing Factor |
Theoretical Plates |
|
1 |
GLZ |
5.730 |
391567 |
1.015 |
3592.494 |
|
2 |
GLZ |
5.657 |
392684 |
1.011 |
3592.685 |
|
3 |
GLZ |
5.630 |
393742 |
0.949 |
3827.273 |
|
4 |
GLZ |
5.795 |
392504 |
0.947 |
3794.905 |
|
5 |
GLZ |
5.776 |
392517 |
1.018 |
3670.583 |
Specificity:
No interfering peaks were observed in blank or placebo samples, confirming the method’s specificity for Gliclazide.
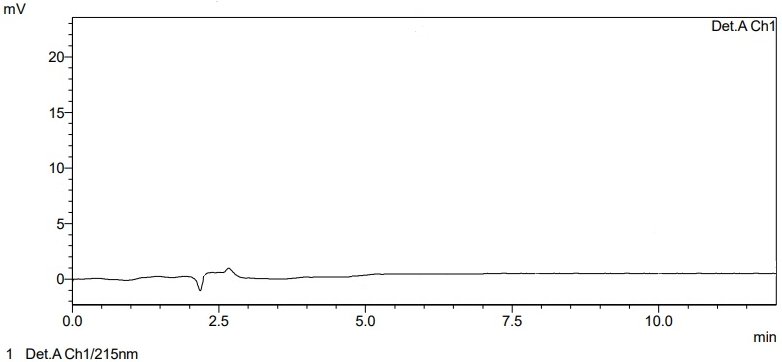
Figure 10: Blank chromatogram for Specificity
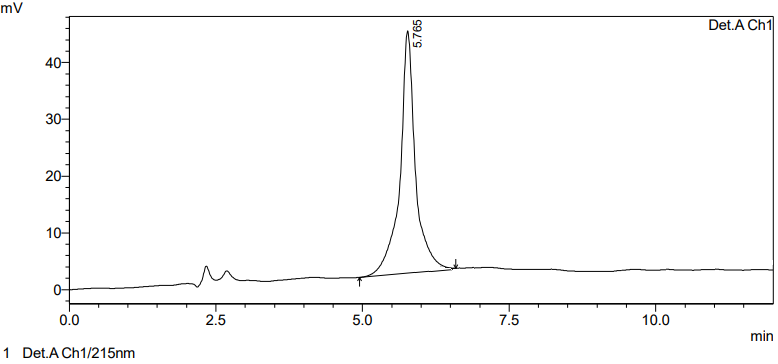
Figure 11: Standard Chromatogram of Gliclazide
Precision:
System precision (%RSD = 1.230%) and method precision (%RSD = 0.705%) demonstrated excellent repeatability. Intraday and interday precision studies at 10, 20, and 30 µg/mL showed %RSD values <2%, indicating high reproducibility.
Table 7: System Precision Data of Gliclazide
|
Sr. No. |
Peak areas of GLZ |
|
1 |
794123 |
|
2 |
789547 |
|
3 |
794263 |
|
4 |
794052 |
|
5 |
794127 |
|
6 |
786542 |
|
Mean |
792109.00 |
|
SD (±) |
3289.341 |
|
RSD (%) |
0.415 |
|
Acceptance Criteria |
% RSD Should not be more 2 |
Table 8: Intraday Precision data of Gliclazide
|
Gliclazide |
|||||
|
Sr. no. |
Conc. (µg/ml) |
Area |
mean peak area |
SD (±) |
%RSD |
|
1 |
10 |
392746 |
391947 |
2041.352 |
0.520 |
|
393468 |
|||||
|
389627 |
|||||
|
2 |
20 |
794163 |
791359 |
4964.149 |
0.627 |
|
785627 |
|||||
|
794286 |
|||||
|
3 |
30 |
1252486 |
1252339 |
1424.725 |
0.113 |
|
1250846 |
|||||
|
1253684 |
|||||
Table 9: Inter-day precision data of Gliclazide
|
Gliclazide |
||||||
|
Sr. no. |
Day |
Conc. (µg/ml) |
Area |
mean peak area |
SD(±) |
%RSD |
|
1 |
Day 1 |
10 |
392777 |
389929 |
2675.57 |
0.686 |
|
Day 2 |
387468 |
|||||
|
Day 3 |
389542 |
|||||
|
2 |
Day 1 |
20 |
788234 |
788840 |
1953.00 |
0.247 |
|
Day 2 |
791025 |
|||||
|
Day 3 |
787263 |
|||||
|
3 |
Day 1 |
30 |
1253864 |
1251839 |
2001.42 |
0.159 |
|
Day 2 |
1251792 |
|||||
|
Day 3 |
1249862 |
|||||
Accuracy:
Recovery studies at three levels (80%, 100%, 120%) showed a mean recovery of 100.19%, validating the method's accuracy.
Table 10: Recovery study for Gliclazide
|
Gliclazide |
|||||||
|
Level |
Set |
Amount added(µg/ml) |
Amount found(µg/ml) |
%Recovery |
Mean |
SD |
%RSD |
|
80% |
1 |
10 |
9.915 |
100.86 |
100.23 |
0.553 |
0.551 |
|
2 |
10 |
10.019 |
99.80 |
||||
|
3 |
10 |
9.996 |
100.04 |
||||
|
100% |
1 |
20 |
19.886 |
100.57 |
100.34 |
0.391 |
0.390 |
|
2 |
20 |
20.024 |
99.88 |
||||
|
3 |
20 |
19.892 |
100.54 |
||||
|
120% |
1 |
30 |
29.983 |
100.05 |
100.02 |
0.079 |
0.007 |
|
2 |
30 |
30.021 |
99.93 |
||||
|
3 |
30 |
29.977 |
100.08 |
||||
Linearity and Range:
The method was linear over the range of 10–50 µg/mL with a correlation coefficient (R²) of 0.9993.
Table 11: Linearity and Range for Gliclazide
|
Concentration in µg/ml for GLZ |
Average Peak Area* |
|
10 |
392843 |
|
20 |
794156 |
|
30 |
1252578 |
|
40 |
1684623 |
|
50 |
2063462 |
|
Slope |
41860 |
|
CC |
15230 |
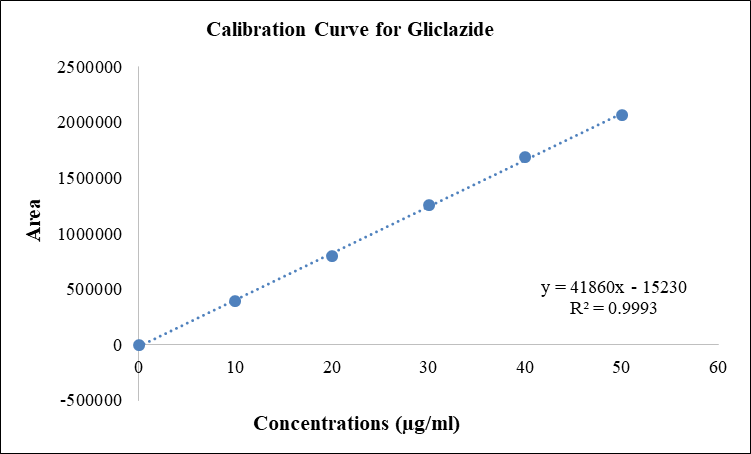
Figure 12: Standard Curve for Gliclazide
Stability:
Gliclazide solutions remained stable at both room and refrigerated conditions for 24 hours, with no significant changes in % assay.
Table 12: Solution Stability Data of Gliclazide
|
Time level |
Refrigerator (25°C) |
Room Condition (37°C) |
|
Time in hrs |
% Assay of GLZ |
|
|
Initial |
100.25 (±0.34) |
99.12 (±0.032) |
|
After 24 hrs |
101.23 (±0.58) |
100.09 (±0.046) |
*Average of Six determination
LOD and LOQ:
The limit of detection and quantitation were found to be 1.154 µg/mL and 3.808 µg/mL, respectively, confirming the method’s sensitivity.
Robustness and Ruggedness:
Robustness studies showed %RSD <2% under varied chromatographic conditions. Ruggedness evaluation across different temperatures (25°C, 37°C, and 60°C) yielded consistent assay results, demonstrating method reliability.
Table 13: Robustness data of Gliclazide at flow rate 0.8 ml/min
|
GLZ |
||||
|
Flow Rate (0.8ml/min) |
||||
|
|
Retention Time (min) |
Area |
Theoretical Plate |
Tailing factor |
|
|
5.884 |
392762 |
3594.12 |
1.102 |
|
|
5.846 |
392887 |
3498.02 |
1.113 |
|
|
5.882 |
388624 |
3584.26 |
1.128 |
|
Avg |
5.870 |
391424 |
3558.80 |
1.114 |
|
SD |
0.021 |
2425.97 |
52.871 |
0.013 |
|
%RSD |
0.364 |
0.619 |
1.485 |
1.171 |
Table 14: Robustness data of Gliclazide at flow rate 1.2 ml/min
|
GLZ |
||||
|
Flow Rate (1.2 ml/min) |
||||
|
|
Retention Time (min) |
Area |
Theoretical Plate |
Tailing factor |
|
|
5.693 |
389674 |
3486.26 |
1.110 |
|
|
5.564 |
392760 |
3562.22 |
1.103 |
|
|
5.676 |
392864 |
3524.38 |
1.116 |
|
Avg. |
5.644 |
391766 |
3524.29 |
1.109 |
|
SD |
0.070 |
1812.47 |
37.982 |
0.006 |
|
%RSD |
1.241 |
0.462 |
1.077 |
0.586 |
Table 15: Data of Ruggedness for Gliclazide
|
GLZ |
||||
|
Change in Parameters |
Area of Standard |
Mean |
SD |
%RSD |
|
25°C |
392846 |
387338 |
5060.16 |
1.306 |
|
382895 |
||||
|
386274 |
||||
|
37°C |
794153 |
791710 |
5173.28 |
0.653 |
|
785768 |
||||
|
795210 |
||||
|
60 °C |
1251684 |
1246304 |
10074.70 |
0.808 |
|
1252546 |
||||
|
1234681 |
||||
Analysis of Marketed Formulation
Gliclazide tablets (Glycinorm-40, Ipca Laboratories Ltd.) were analyzed using the developed RP-HPLC method. The formulation showed a retention time of 5.803 min and a % assay of 98.68%, confirming the method's suitability for routine quality control of commercial products.
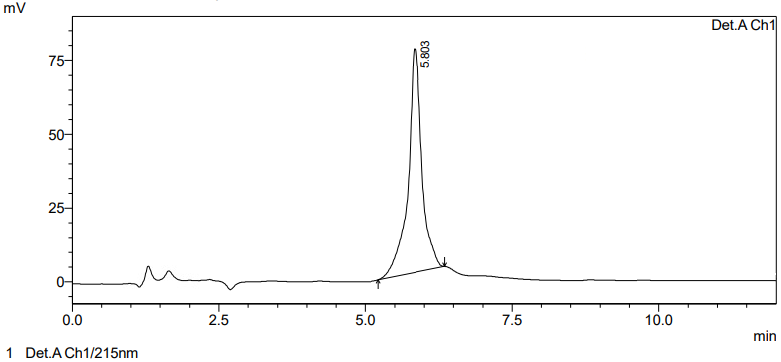
Figure 13: Chromatogram of Marketed Formulation (Glycinorm-40 Ipca Laboratories Ltd.)
CONCLUSION:
In this study, simple, precise, accurate, and cost-effective UV and RP-HPLC methods were developed for the determination of Gliclazide (GLZ) in pharmaceutical formulations without interference from excipients. Drug identification was confirmed through organoleptic evaluation, melting point determination, UV and FTIR spectroscopy, solubility testing, and DSC analysis. The UV method utilized a Lasany LI-2702 double beam spectrophotometer with Propylene Glycol: Methanol (10:90) as the solvent system. Scanning from 200 to 400 nm identified 215 nm as the optimal wavelength for GLZ, with the method adhering to Beer-Lambert’s law. Validation parameters included linearity, accuracy, precision (intra- and inter-day), LOD, LOQ, ruggedness, and robustness. For the HPLC method, a Shimadzu LC 2010 system equipped with a C18 Intersil ODS-3V column was employed. Various mobile phases were tested to optimize peak resolution, settling on a triphasic mixture of Propylene Glycol: Water (pH 4.5, adjusted with orthophosphoric acid): Methanol (50:40:10) at a flow rate of 1 ml/min, with detection at 215 nm. GLZ showed a retention time of 5.793 minutes and demonstrated a linear calibration curve over 10–50 μg/ml. Low % RSD values confirmed the method’s precision and accuracy, and mean recoveries ranged from 99.80% to 100.86%. Both methods were validated according to ICH guidelines, showing consistent results closely matching the labeled tablet content. The developed UV and RP-HPLC methods are thus suitable for routine quality control of Gliclazide in various dosage forms.
CONFLICT OF INTEREST:
None.
REFERENCES

Mahindra Pawar*, Vijay Salunkhe, UV and RP-HPLC Method Development of Gliclazide in Tablet Dosage Form and its Validation, Int. J. of Pharm. Sci., 2025, Vol 3, Issue 6, 5175-5193. https://doi.org/10.5281/zenodo.15753708
 10.5281/zenodo.15753708